
Global equity markets were always concentrated. The U.S. is just catching up.
Rising U.S. equity concentration is real, but a global view shows it is not unique - and international diversification does not automatically reduce concentration risk.


Sanjeev Pati, CFA
Founder, Scatterplot
TL;DR, Key Takeways
- The top 10 U.S. stocks now represent ~39% of the S&P 500, up from ~18% in 2015.
- Amazon, Meta, and Alphabet are not classified as technology companies under traditional sector systems like GICS. Add them in, and "real tech" is closer to ~45% of the S&P 500 today
- Other major markets like Canada, UK, China, South Korea, and France have concentration levels well above the U.S. and have been concentrated for years.
- Switching from U.S. to international equities, if not done thoughtfully, simply moves concentration risk. It does not remove it.
- The type of concentration matters as much as the level.
Intro
One of the most common arguments in markets today is that U.S. equity returns have been great, but driven by only a handful of companies - a sign that, many argue, that the market has become dangerously concentrated. The concern is reasonable, and the data supports it. But the conclusion that typically follows does not: selling U.S. equities in favor of international equities does not automatically reduce concentration risk. In many cases, it simply moves the concentration elsewhere.
This piece examines what equity market concentration actually looks like across the world's major markets, what has driven the U.S. increase, and why the global context is almost always missing from this conversation.
U.S. market concentration has risen sharply
Over the past decade, concentration in U.S. equities has increased in a meaningful way. The top 10 stocks in the U.S. equity market rose from about 18% of the index in 2015 to roughly 39% today, more than doubling over the past decade. This reflects a structural change in market organization, not a temporary momentum effect.
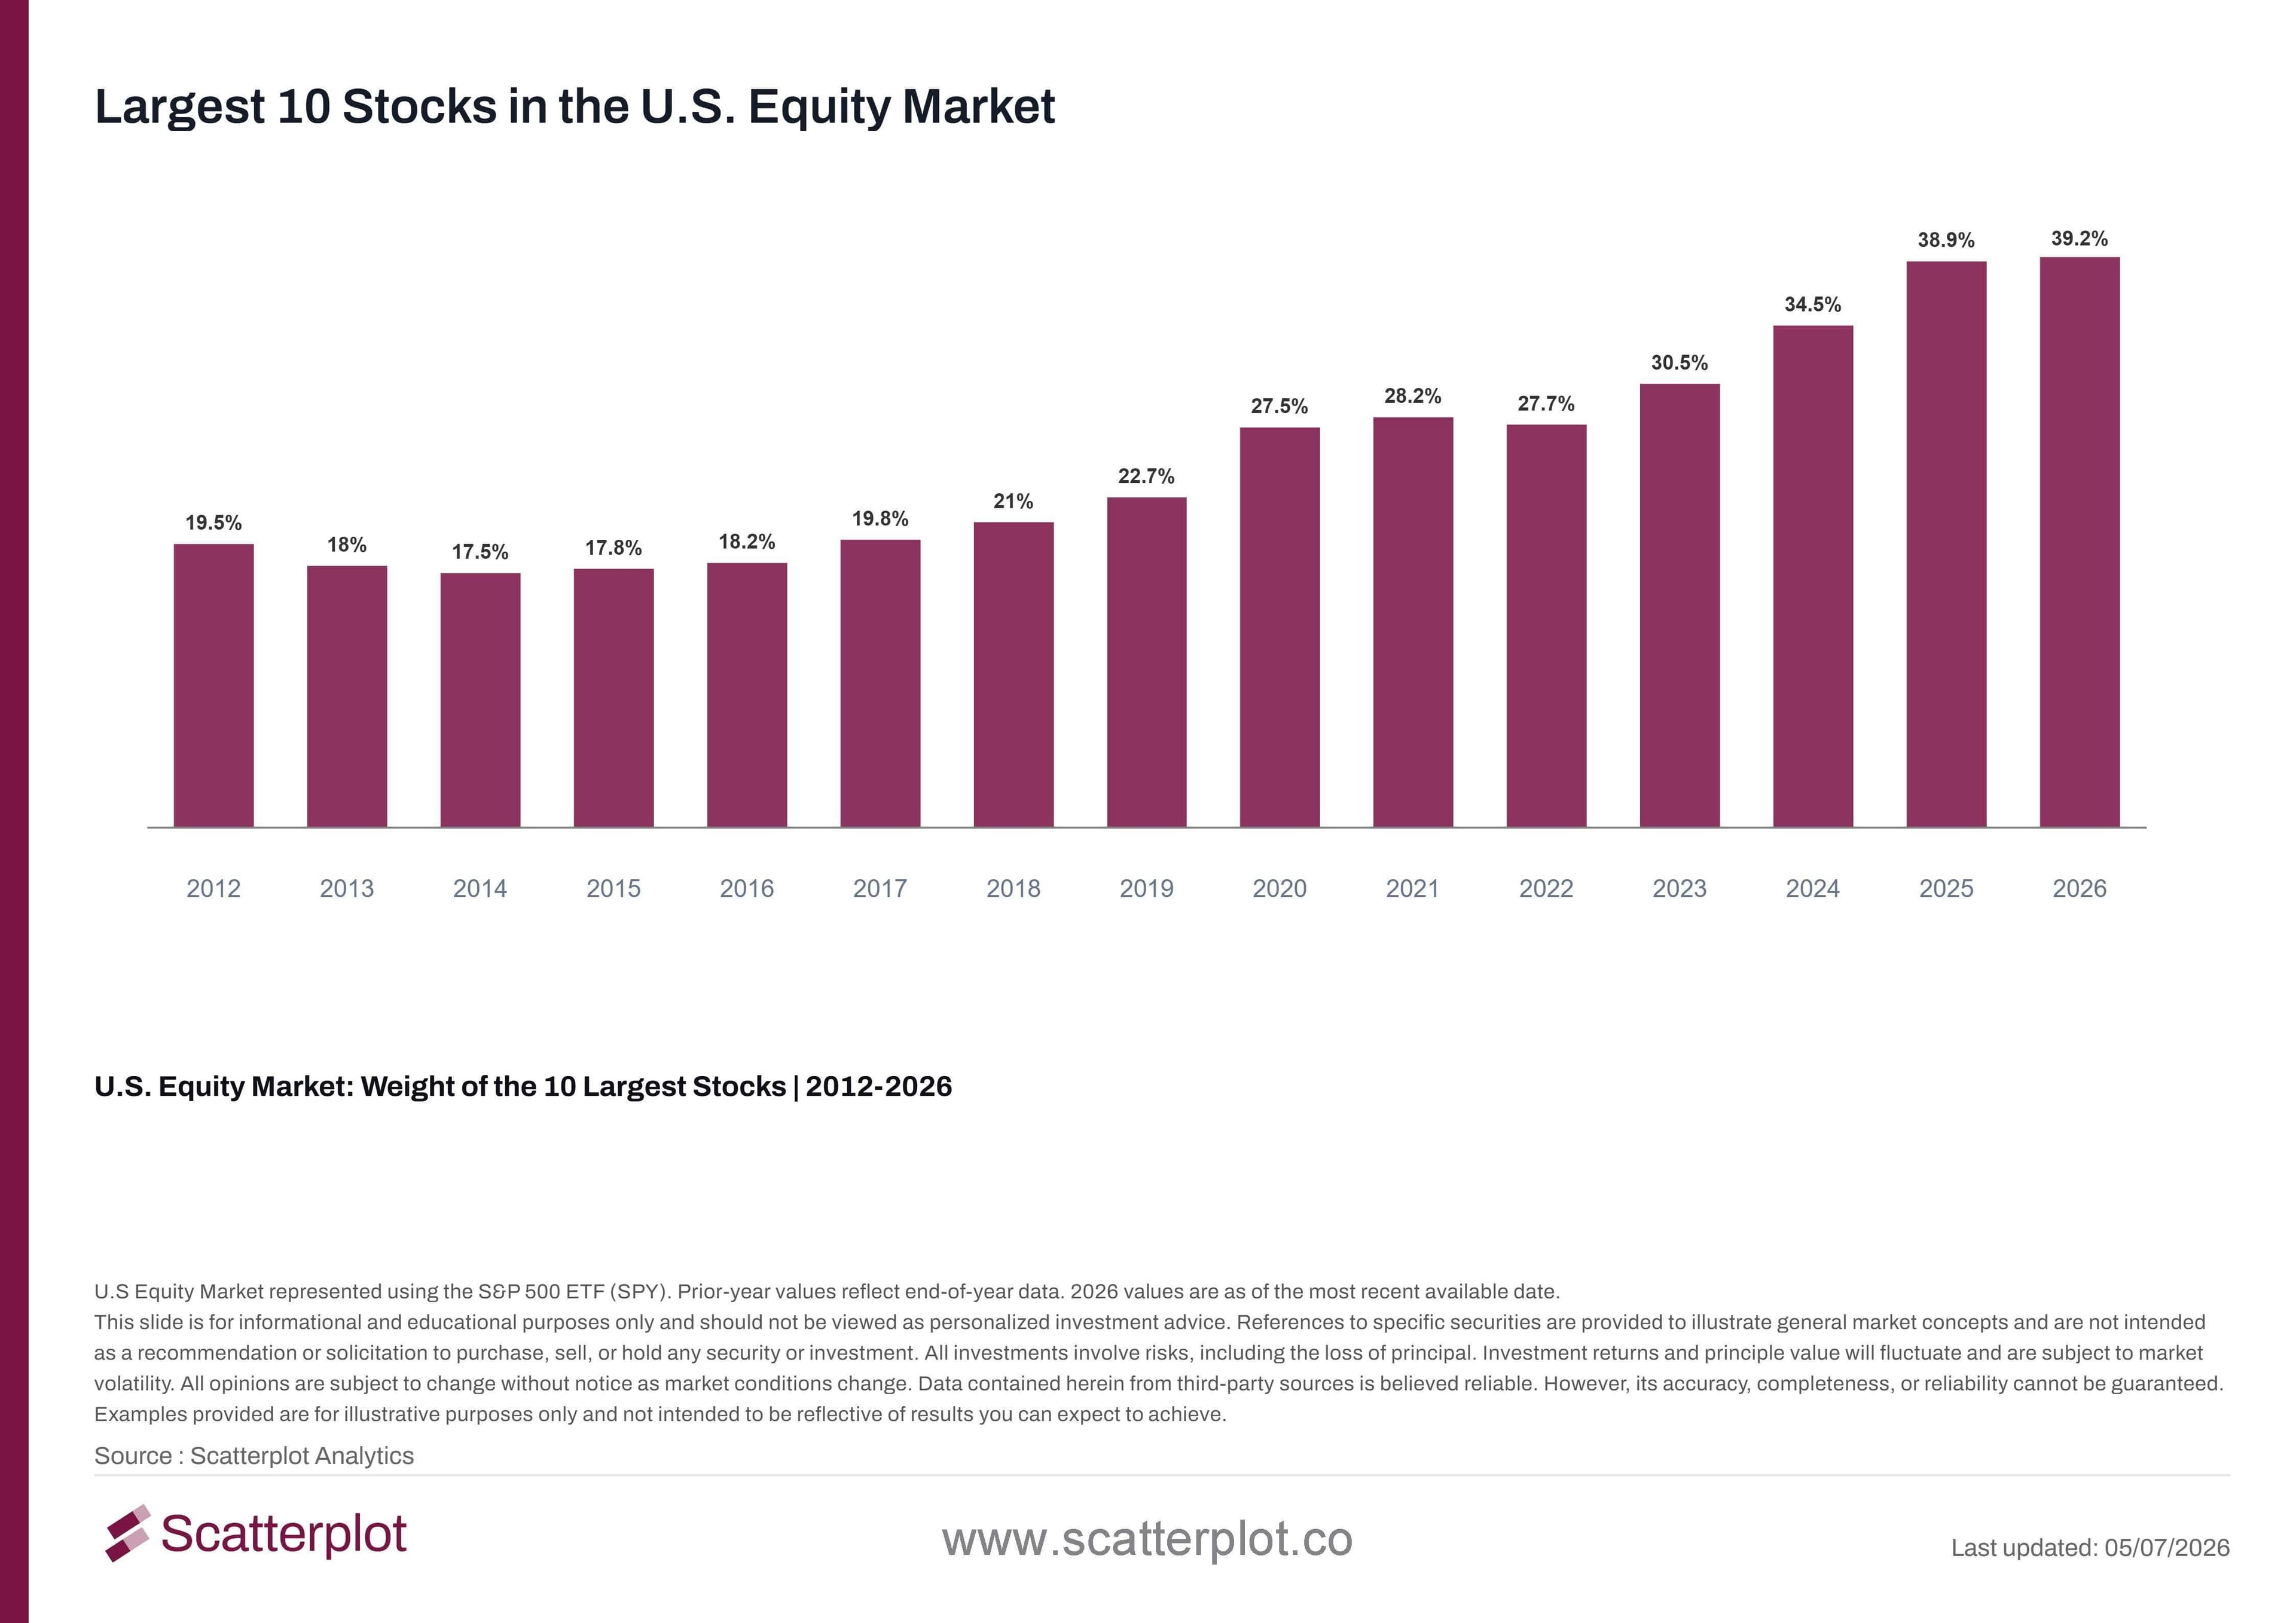
This chart updates daily in the Scatterplot portal.
The driver is well understood: a small group of mega-cap technology and technology-adjacent companies delivered extraordinary returns, grew their earnings at scale, and attracted ever-larger passive flows. As their market caps rose, their index weights rose with them, creating a self-reinforcing cycle that compressed performance into fewer and fewer names.
The technology sector was already dominant, before AI made it unmissable
The concentration in U.S. equities has been driven by one force above all others: the rise of the technology sector. Even before the AI boom, tech was already a dominant and growing force within the U.S. Equity market. The Information Technology sector grew from roughly 15% of the index in 2013 to close to 36% today, and that trajectory was well established long before generative AI entered the picture.
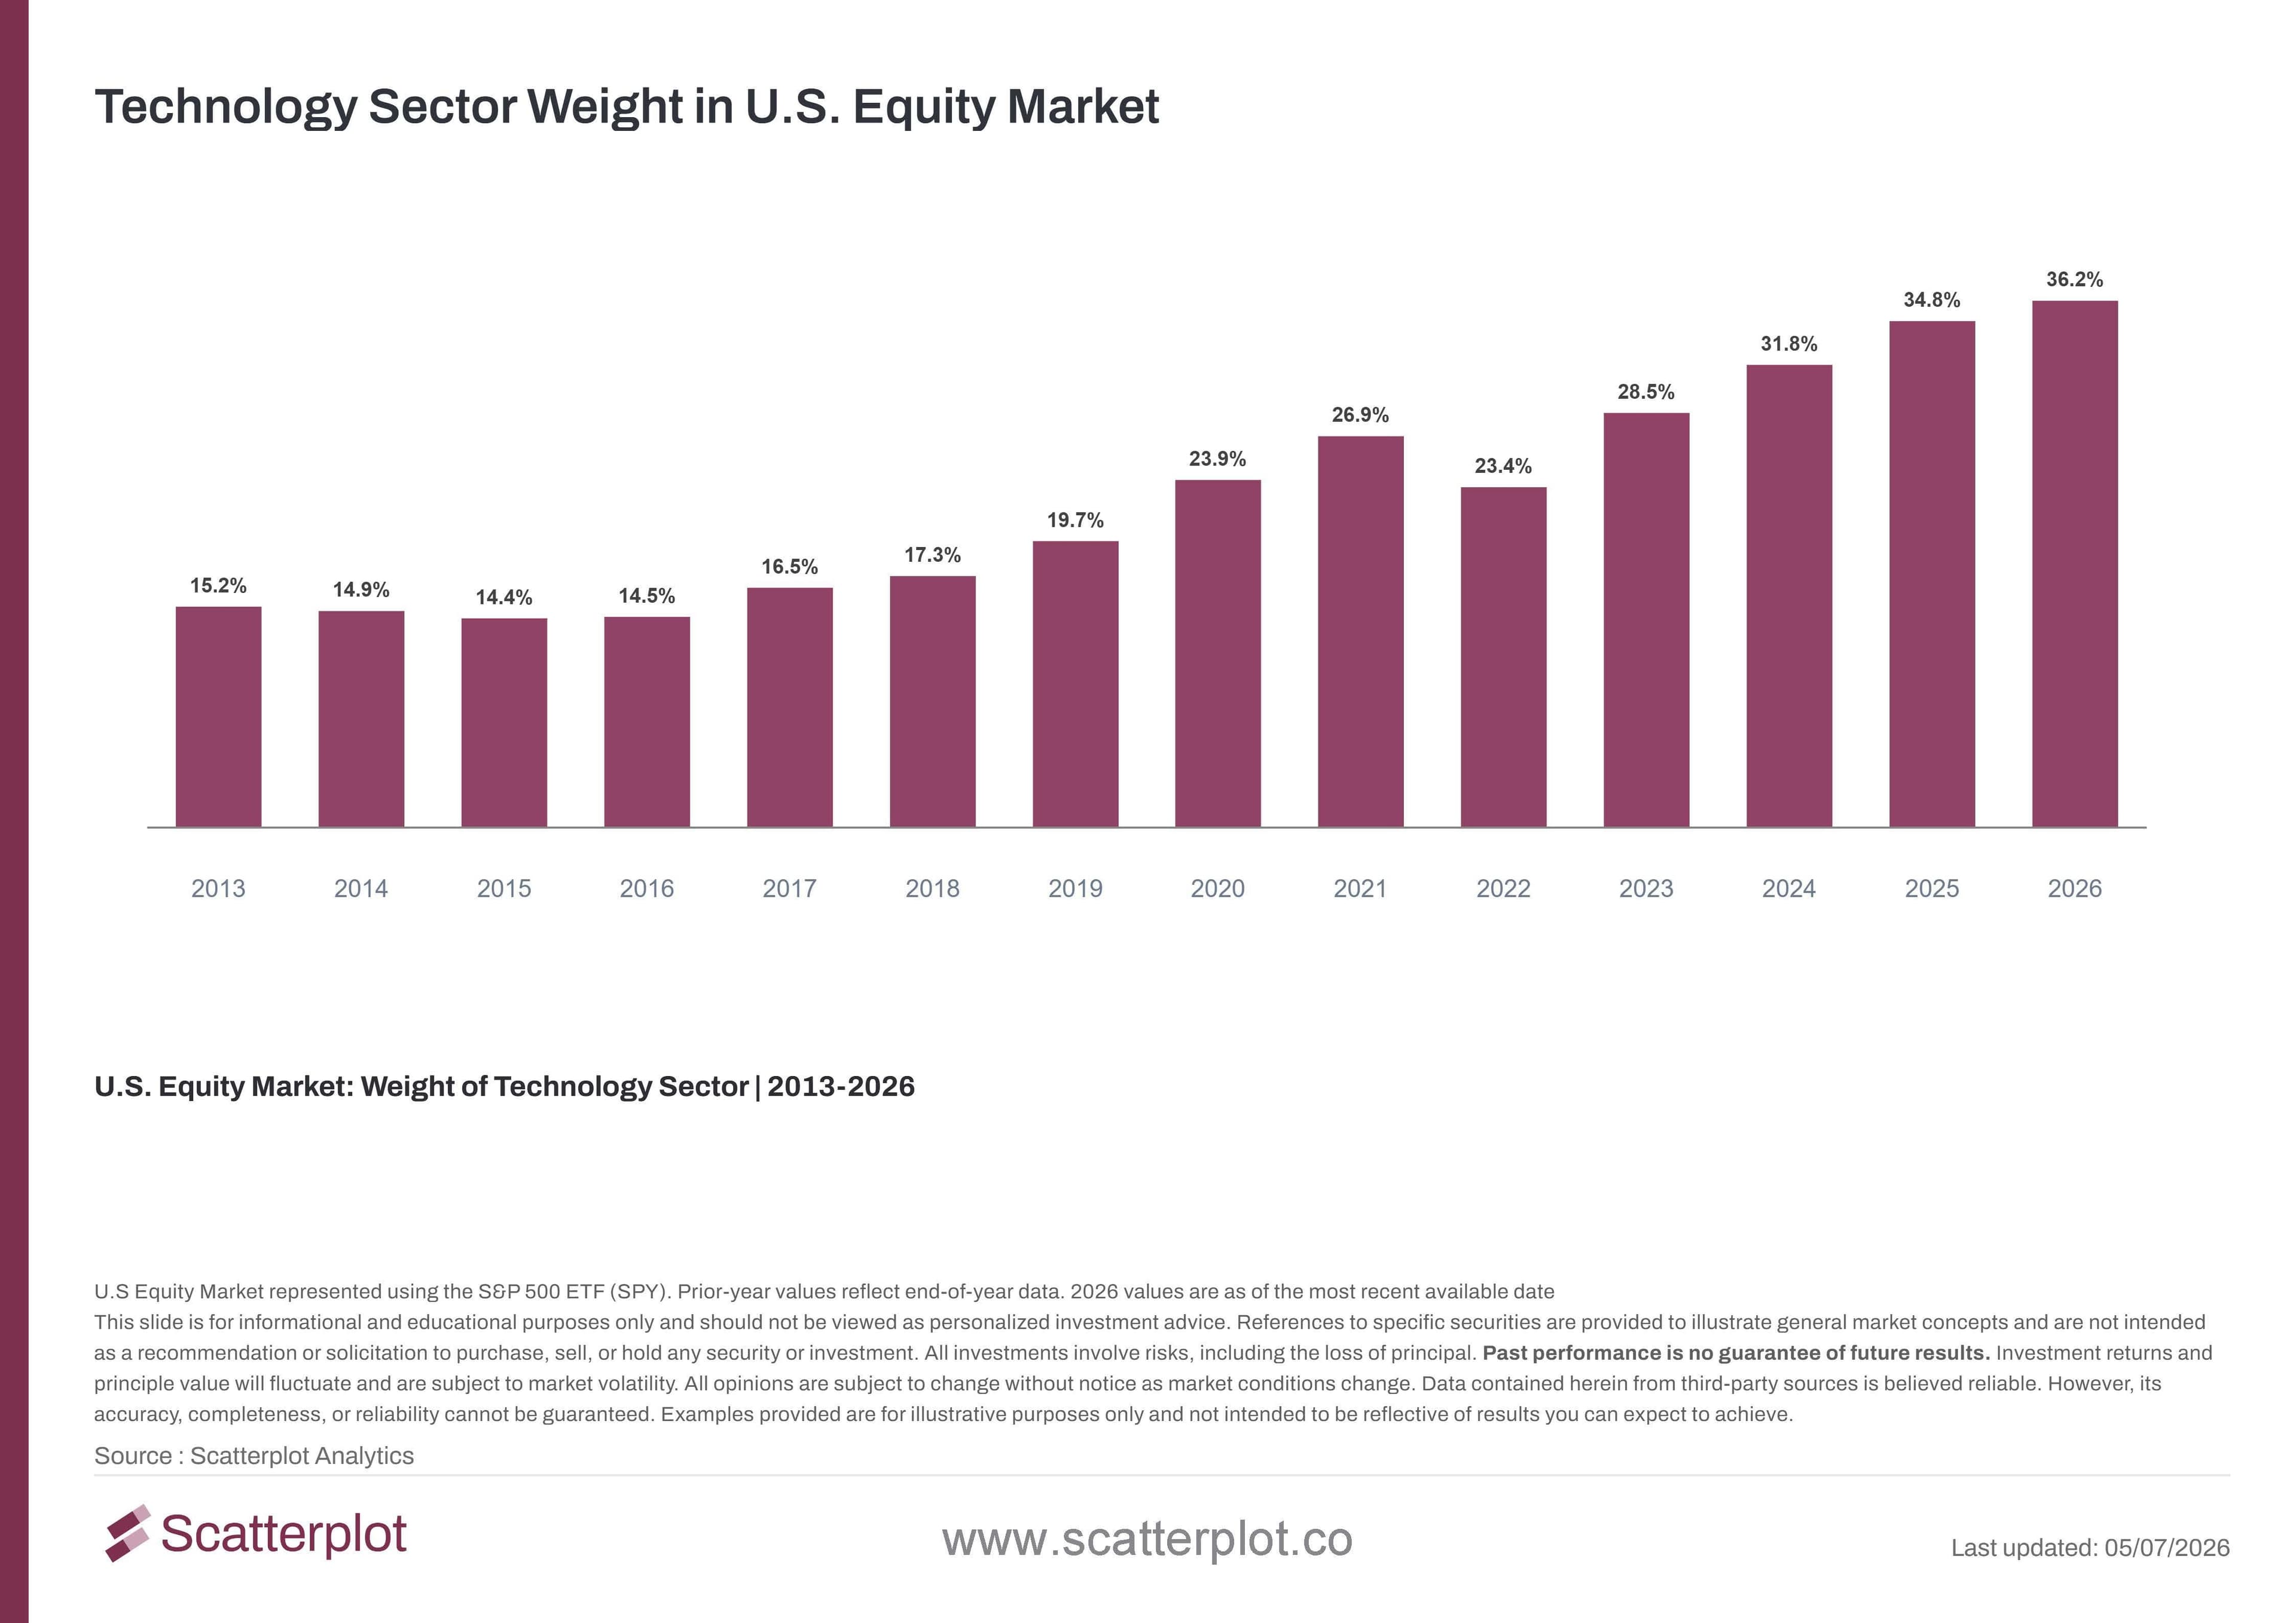
This chart updates daily in the Scatterplot portal.
And the 36% figure is itself an undercount. Amazon, Meta, and Alphabet are not classified as technology companies under traditional sector classification systems like GICS. Amazon sits in Consumer Discretionary, while Alphabet and Meta fall under Communication Services. By the formal definition, they are not tech. But by any practical measure, they are. Add those names to the formal technology sector, and the "true tech" share of the S&P 500 is closer to ~45%. That means nearly half the index, by market cap, is concentrated in a handful of technology-driven enterprises.
The global context is often missing
The global context is often missing from discussions about concentration. Many large equity markets outside the U.S. have been concentrated for years. Markets such as the U.K., Canada, China, and South Korea, when viewed through their MSCI ETFs, have shown higher levels of concentration than the U.S. for much of the past decade. While U.S. concentration has risen quickly, other markets have long depended on a small number of dominant companies to drive index performance.
The examples are striking. HSBC and AstraZeneca alone represent close to 20% of the UK index. In South Korea, Samsung and SK Hynix together account for roughly 50% of the market. In Canada, RBC and TD Bank alone represent approximately 14% of the index. These are not diversified markets, they are markets built around a small number of dominant national champions, much as the U.S. market is increasingly built around a small number of dominant technology companies
This chart updates daily in the Scatterplot portal.
Top equity markets: how concentrated are they?
The chart below will show the weight of the top 10 stocks across the world's largest equity markets. The picture is consistent: high concentration in a small number of dominant companies is the global norm, not a U.S. anomaly.
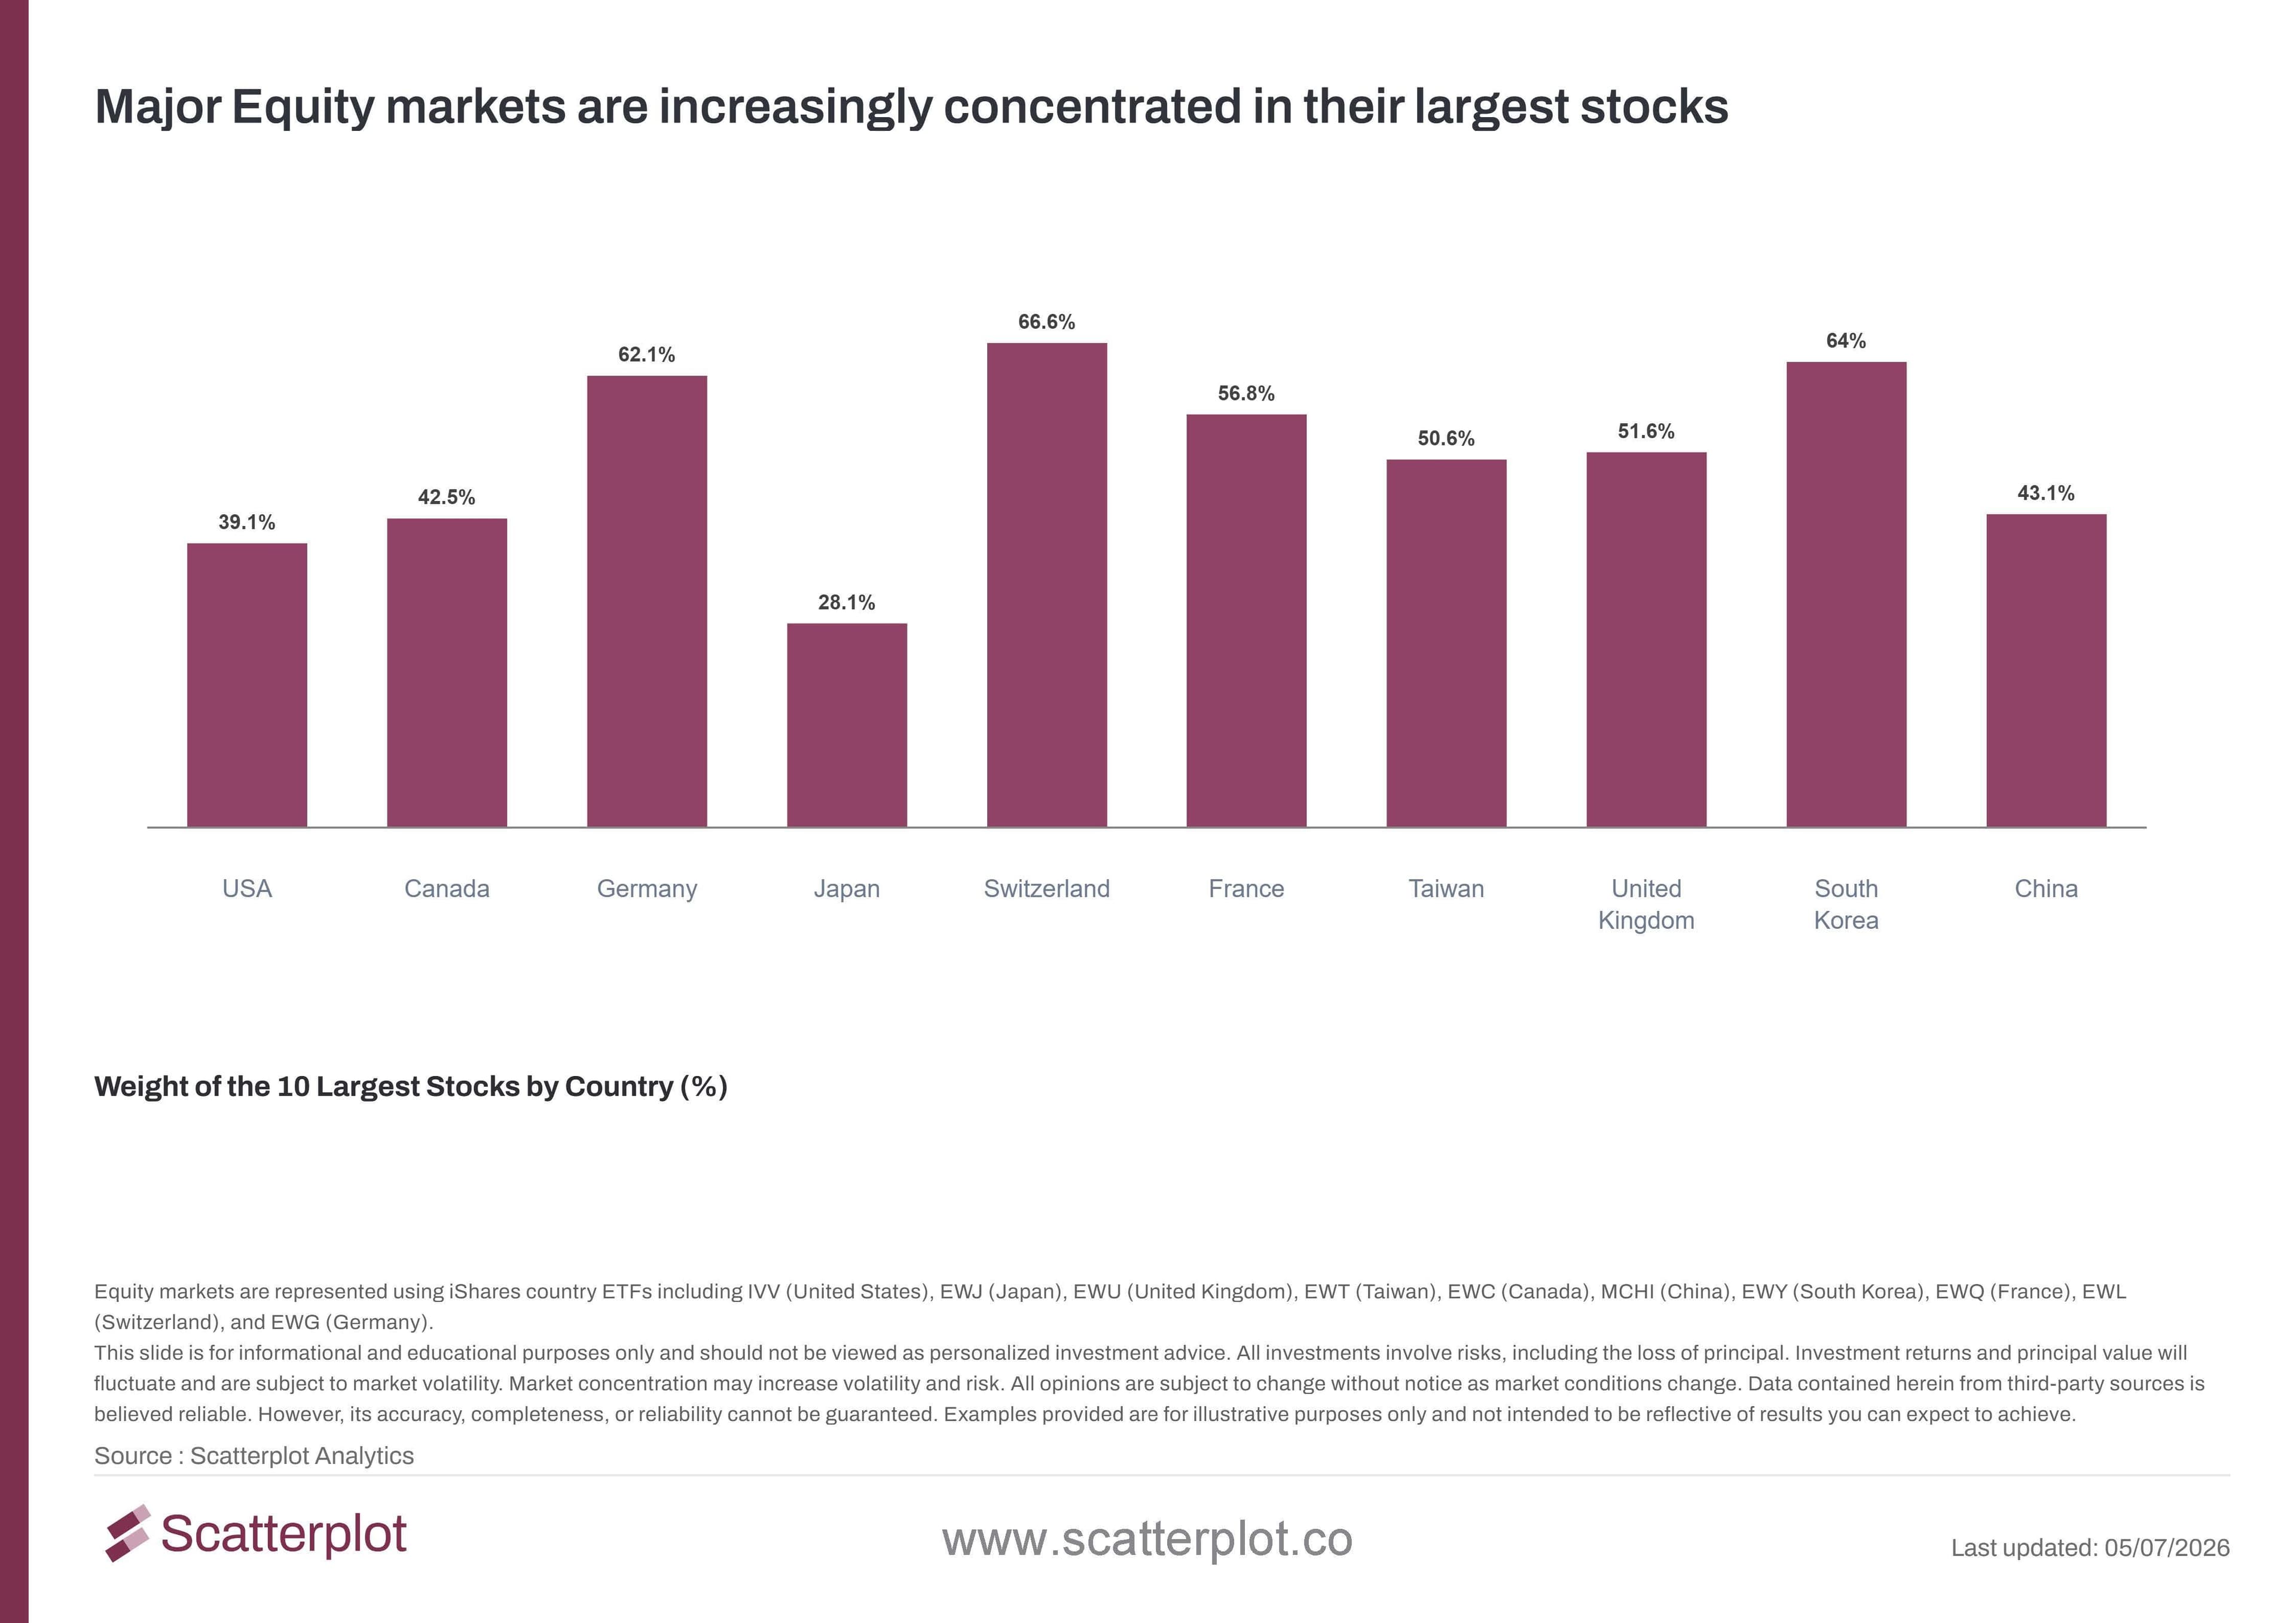
This chart updates daily in the Scatterplot portal.
Conclusion
The concentration of the U.S. equity market is real, measurable, and worth understanding. But the argument that frames it as uniquely dangerous , and international diversification as the automatic remedy , does not hold up when you look at the full picture.
The U.S. arrived at concentration through the extraordinary growth of a handful of digital companies that were already well on their way to dominating the world. AI just accelerated the journey. Other markets got there through banks, energy pipelines, miners, state enterprises, and some tech. The path was different. The destination is the same.
It is also true that most model-based portfolios access international exposure through broadly diversified vehicles like the MSCI EAFE ETF (EFA) or MSCI Emerging Market ETF (EEM). Although some of these ETFs do dilute concentration risk, not all do. For example, the MSCI Emerging Markets ETF (EEM) currently has over a quarter of its assets in just three names across two countries. In many cases, the returns of entire regions can be driven by just one or two dominant companies.
Concentration does not go away when you cross a border. It just shows up in different companies.
FAQs
How concentrated is the U.S. equity market today?
The top 10 stocks in the S&P 500 represent approximately 39% of the index, up from about 18% in 2015. That represents more than a doubling over the past decade.
Why is the U.S. tech sector's weight understated at 36%?
Because Amazon, Alphabet, and Meta are not classified as technology companies under standard sector systems like GICS. Add them in and the true tech share of the S&P 500 is closer to 45%.
Does switching to international equities reduce concentration risk?
Not automatically. Markets like Canada, the UK, South Korea, and China have concentration levels close to or above 50% in their top names, and in many cases, these concentrations have been there for years. Simply switching markets moves the concentration. It does not remove it.
Which global markets are more concentrated than the U.S.?
Several. Samsung and SK Hynix alone account for roughly 50% of the South Korean equity market. HSBC and AstraZeneca represent close to 20% of the UK equity market. RBC and TD Bank make up around 14% of the Canadian equity market. All as measured by their MSCI ETFs. These are not edge cases. They are the norm.
Where can I access the live data and charts behind this analysis?
All charts and data in this piece update daily in the Scatterplot portal. The Scatterplot portal includes the full interactive chart library, additional market context, white-label ready visuals, and deeper analysis beyond what is published here. To get started, open the portal and run a smart search for "Global Concentration" to pull up the full suite of charts and data behind this piece.
Disclosure
This content is provided for informational and educational purposes only and should not be relied upon as investment advice. No representation is made that any investment strategy or market view will be successful. Past performance is not indicative of future results. All investing involves risk, including the loss of principal. Please refer to our Terms and Conditions for more information.


Enjoyed this? Get more in your inbox.
Weekly insights for advisors
— charts, research, and practical tools. No fluff.
Investment Foundations
Understanding Recency Bias: What U.S. Equity Returns Reveal About Investor Expectations
Exploring Recency Bias in Investors Using Recent and Long-Term U.S. Equity Data.
Read moreSanjeev Pati, CFA
July 6, 2026 · 4 min read
Investment Foundations
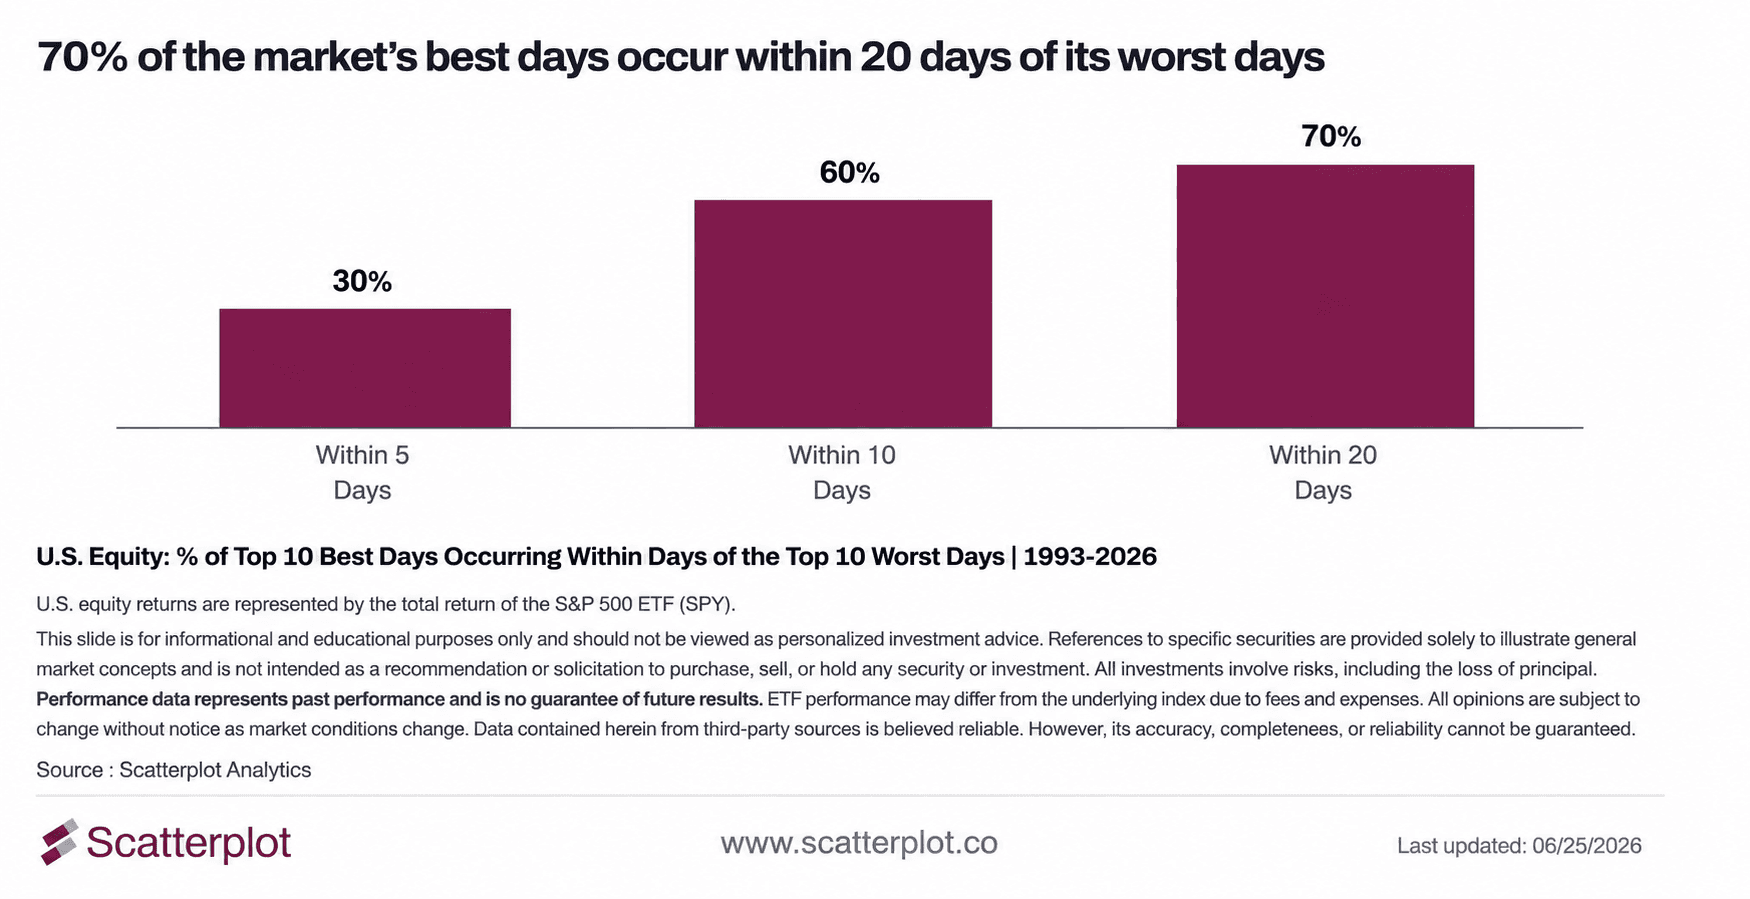
Why Market Timing Is So Hard: 70% of the best days in the market land near the worst ones
Market timing is hard. Since 1993, 70% of the S&P 500's ten best trading days occurred within 20 days of one of its ten worst trading days, making it difficult to capture one without being exposed to the other.
Read moreSanjeev Pati, CFA
June 26, 2026 · 5 min read