
Does Gold Hedge Equity Portfolios? The Evidence Says Yes
We examined gold's behavior across four distinct market stress scenarios. Each one points to the same conclusion: gold has been a reliable hedge for equity portfolios - and the way you hold it matters as much as the decision to hold it.

Sanjeev Pati, CFA
Founder, Scatterplot
Key Takeways
- Across every major macro and geopolitical event since 1993, gold outperformed SPY in all but one instance, with an average outperformance of +7.3 percentage points. The only exception was the 2026 Iran War.
- Analyzing gold's return relative to SPY during every equity drawdown of more than -10% shows that gold outperformed SPY in each one of those scenarios. On the flipside, when equities recovered from those drawdowns, gold underperformed every single time. This asymmetry defines how you should hold it.
- Gold outperformed U.S. equities during 24 of 27 annual maximum annual equity drawdown periods from 2000 to 2026. The protection has held across bull markets, rate cycles, and geopolitical environments.
- Allocating gold in a portfolio should be a strategic allocation as a percentage of equity or risk assets, with a robust rebalancing process. The asymmetry shown in Section 2 - gold outperforming in drawdowns and underperforming in recoveries - is exactly why a disciplined rebalancing process is as important as the allocation itself
Introduction
Gold is a complicated asset. It trades on volatility, central bank buying, inflation expectations, and currency moves. It is notoriously difficult to predict and even harder to explain with a single framework - and we are not trying to here.
That complexity is precisely what makes Gold a useful portfolio allocation.
To test this more rigorously, we examined gold's behavior across four distinct types of market stress events: major macro and geopolitical shocks, equity market corrections of 10% or more, the subsequent recovery phases from those corrections, and annual maximum drawdown periods. We then draw conclusions on the best way to hold it.
Gold During Major Macro and Geopolitical Events
Major macro and geopolitical events are the moments when investors most instinctively reach for safety. The question is whether that instinct is justified by the data.
The chart below examines gold's performance during major macro and geopolitical market events since 1993, measured against the S&P 500 ETF (SPY) maximum drawdown over a 3-month window from each event date. The dataset includes the 2026 Iran War, for which the 3-month measurement window is now complete.
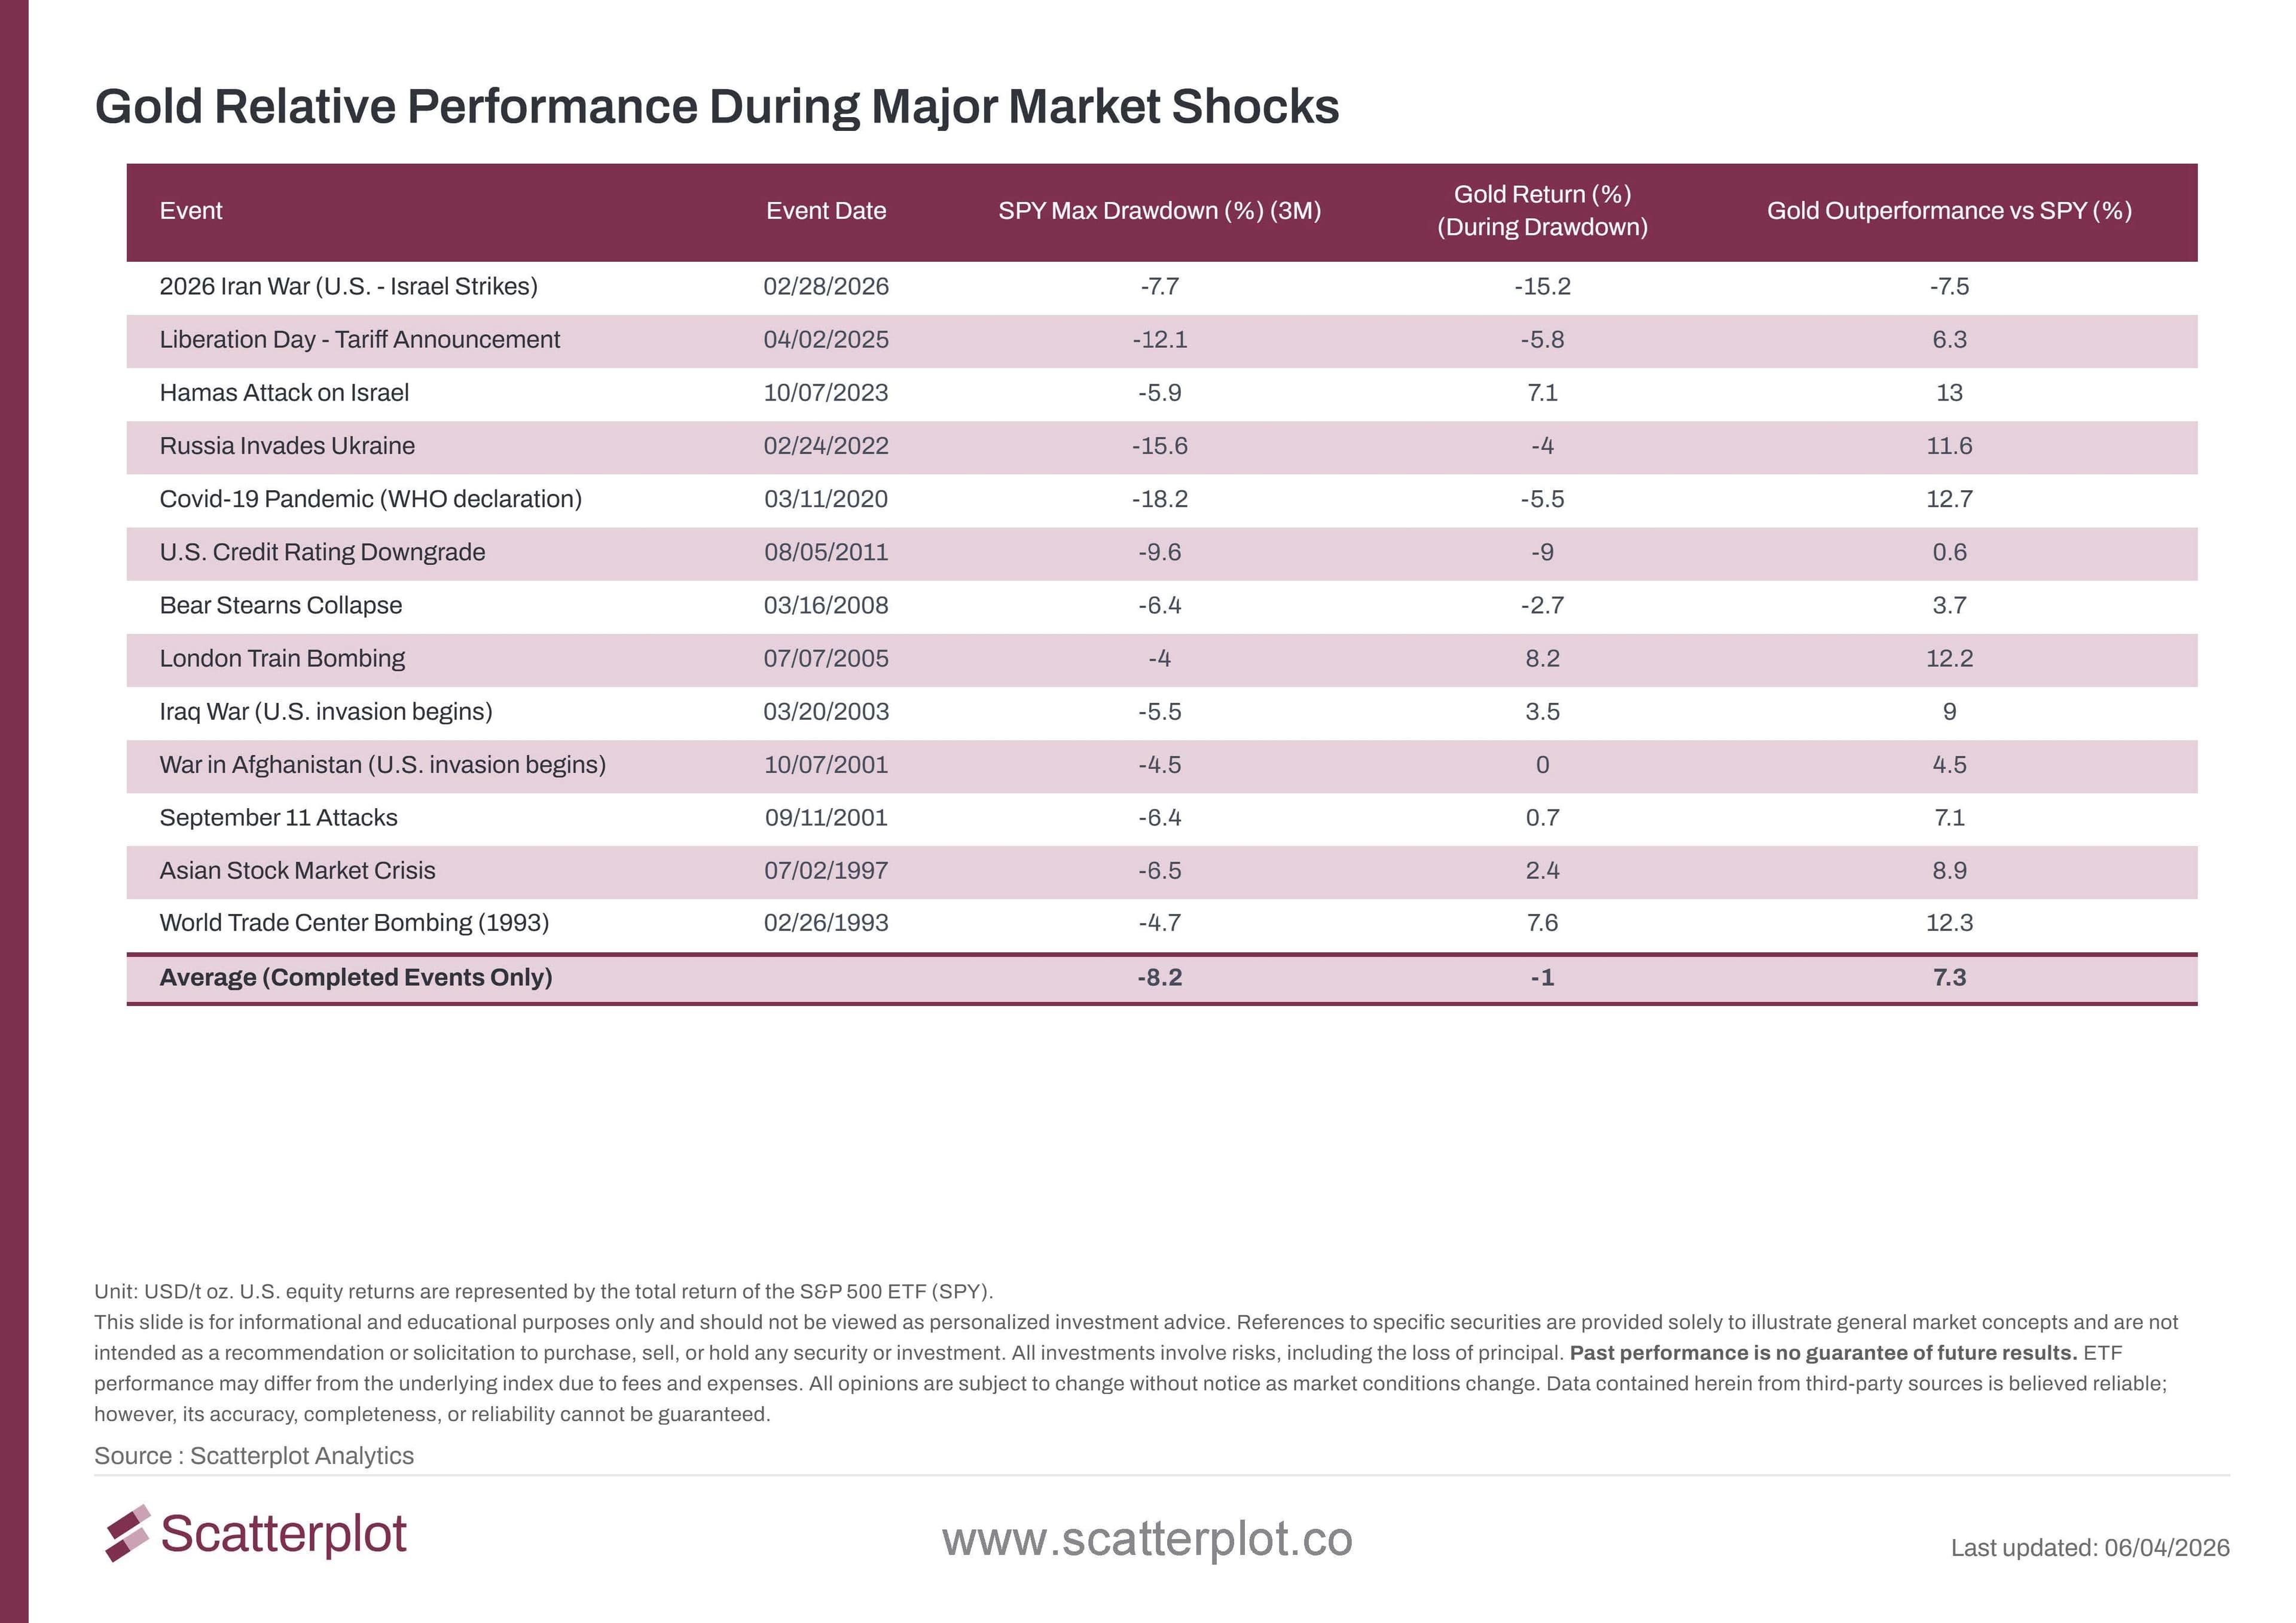
This chart updates daily in the Scatterplot portal.
Across all completed events, gold outperformed SPY by an average of +7.3 percentage points. The pattern holds across very different types of events - military conflicts, financial system shocks, and pandemic declarations.
It is worth noting that in some of these events, gold itself posted a negative absolute return. But for a portfolio investor, absolute return is not the right measure. What matters is relative performance. If gold falls 3% while equities fall 20%, gold has done exactly what a hedge is supposed to do - it has reduced the overall drawdown of the portfolio.
That is a very high success rate. In fact, looking at the full table above, the 2026 Iran War is the only event where gold underperformed SPY during the drawdown window. Every other completed event shows gold outperforming.
Gold During Market Corrections and Recoveries
Macro and geopolitical events are sharp and short. A more systematic test is to look at every major equity market correction since 1993 - defined as an SPY drawdown of 10% or more from peak to trough - and measure what gold did during the same window.
We then look at the recovery phase: from the trough back to the previous peak. This two-part view is where the story becomes more nuanced.
The chart below shows gold's return versus SPY across every equity drawdown of 10% or more since 1993, measured peak to trough.

This chart updates daily in the Scatterplot portal.
The key finding is unambiguous: gold outperformed SPY in every single one of the 12 drawdown events. Whether gold posted positive or negative absolute returns during those periods, it consistently fell less than equities - with an average outperformance of +27.5 percentage points across all 12 events.
Now the second half of the picture: what happens when markets recover from these drawdowns we show above? The chart below shows gold's return versus SPY across the same 12 events, this time measured from the trough back to the previous peak.

This chart updates daily in the Scatterplot portal.
During recovery phases, gold underperformed SPY in every single one of the 12 events. SPY averaged +36.6% from trough to recovery peak; gold averaged +17.4%. Gold still posted positive returns in most recovery periods - but it consistently participated less than equities on the way back up.
This asymmetry is the most important finding in this analysis. Gold protects when markets fall and gives up relative ground when markets rise. This is not a flaw. It is what a hedge is supposed to do. But it has direct consequences for how you should hold it - which we address in Section 4.
Gold During Annual Maximum Drawdown Periods
Major equity corrections of 10% or more and large macro and geopolitical shocks do happen - but they are still relatively rare. You can go several years between one. Sections 1 and 2 capture gold's behavior during those acute stress events, but they leave a gap: what about every other year, when markets are not in a full-blown crisis but still experience painful pullbacks?
This third lens addresses that. Rather than waiting for a 10% correction to qualify, we looked at every single year from 2000 to 2026 and identified the worst peak-to-trough drawdown that occurred within that calendar year for equities - even in years where equities finished strongly. We then measured what gold returned over that exact same window.
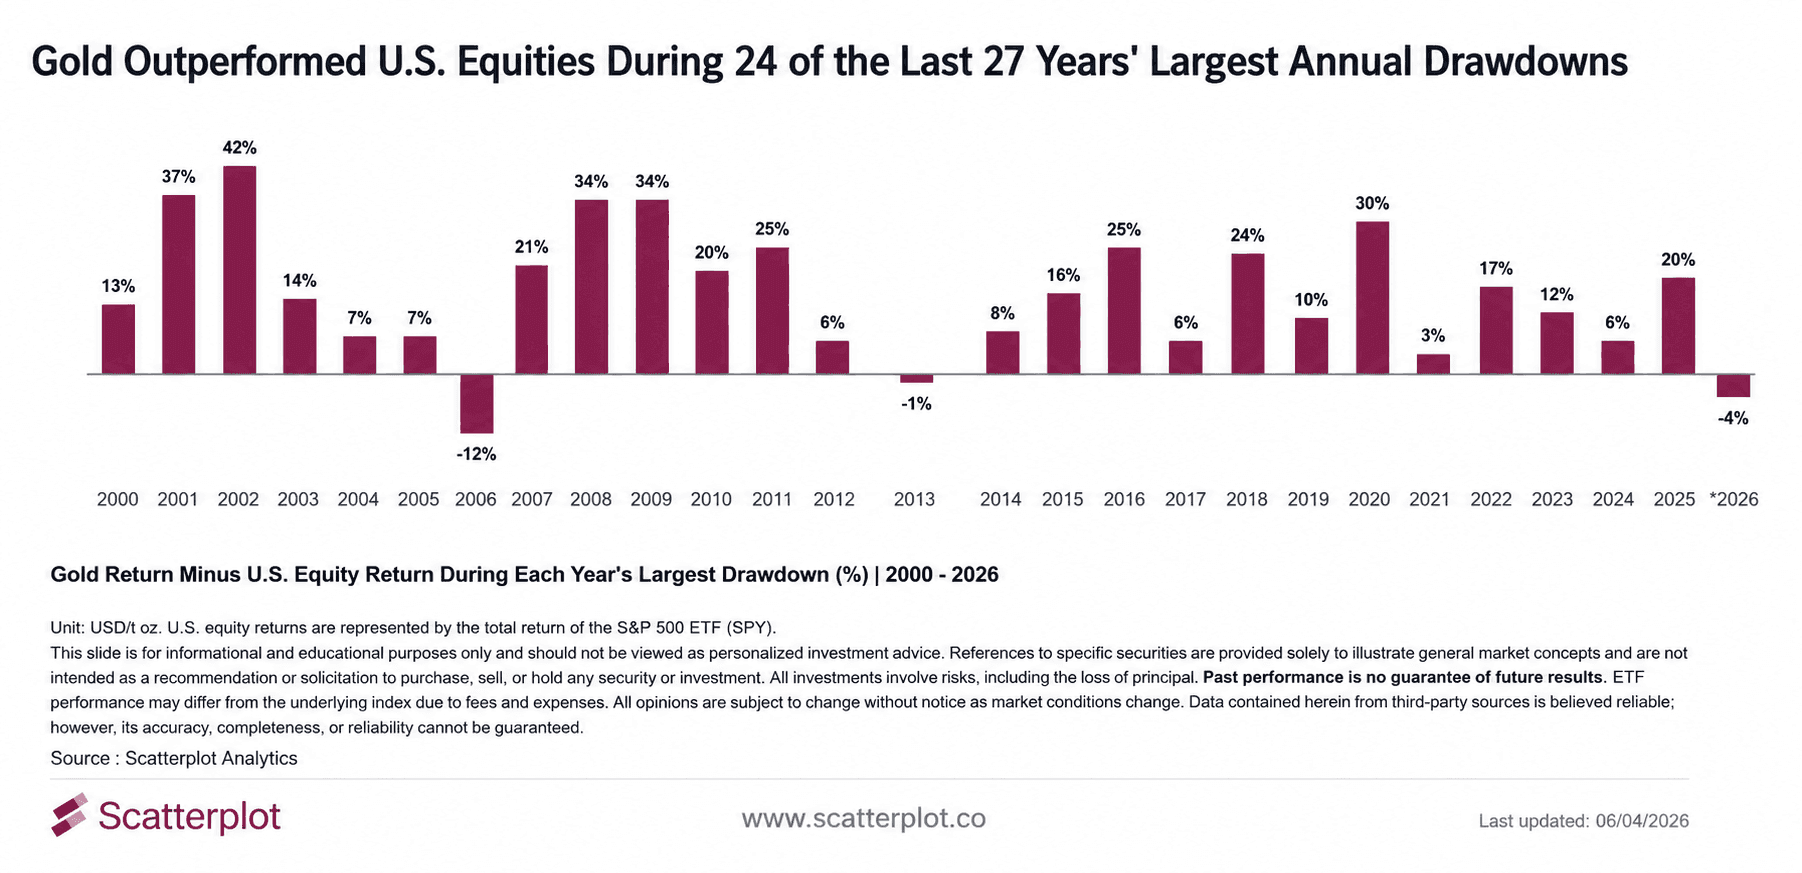
The chart below shows the difference: gold's return minus SPY's return during each year's worst annual equity drawdown period. A bar above zero means gold fell less than equities, or rose while equities fell. A bar below zero means gold fell more than equities during that window. The larger the bar, the stronger the protection gold provided at the moment it was most needed.
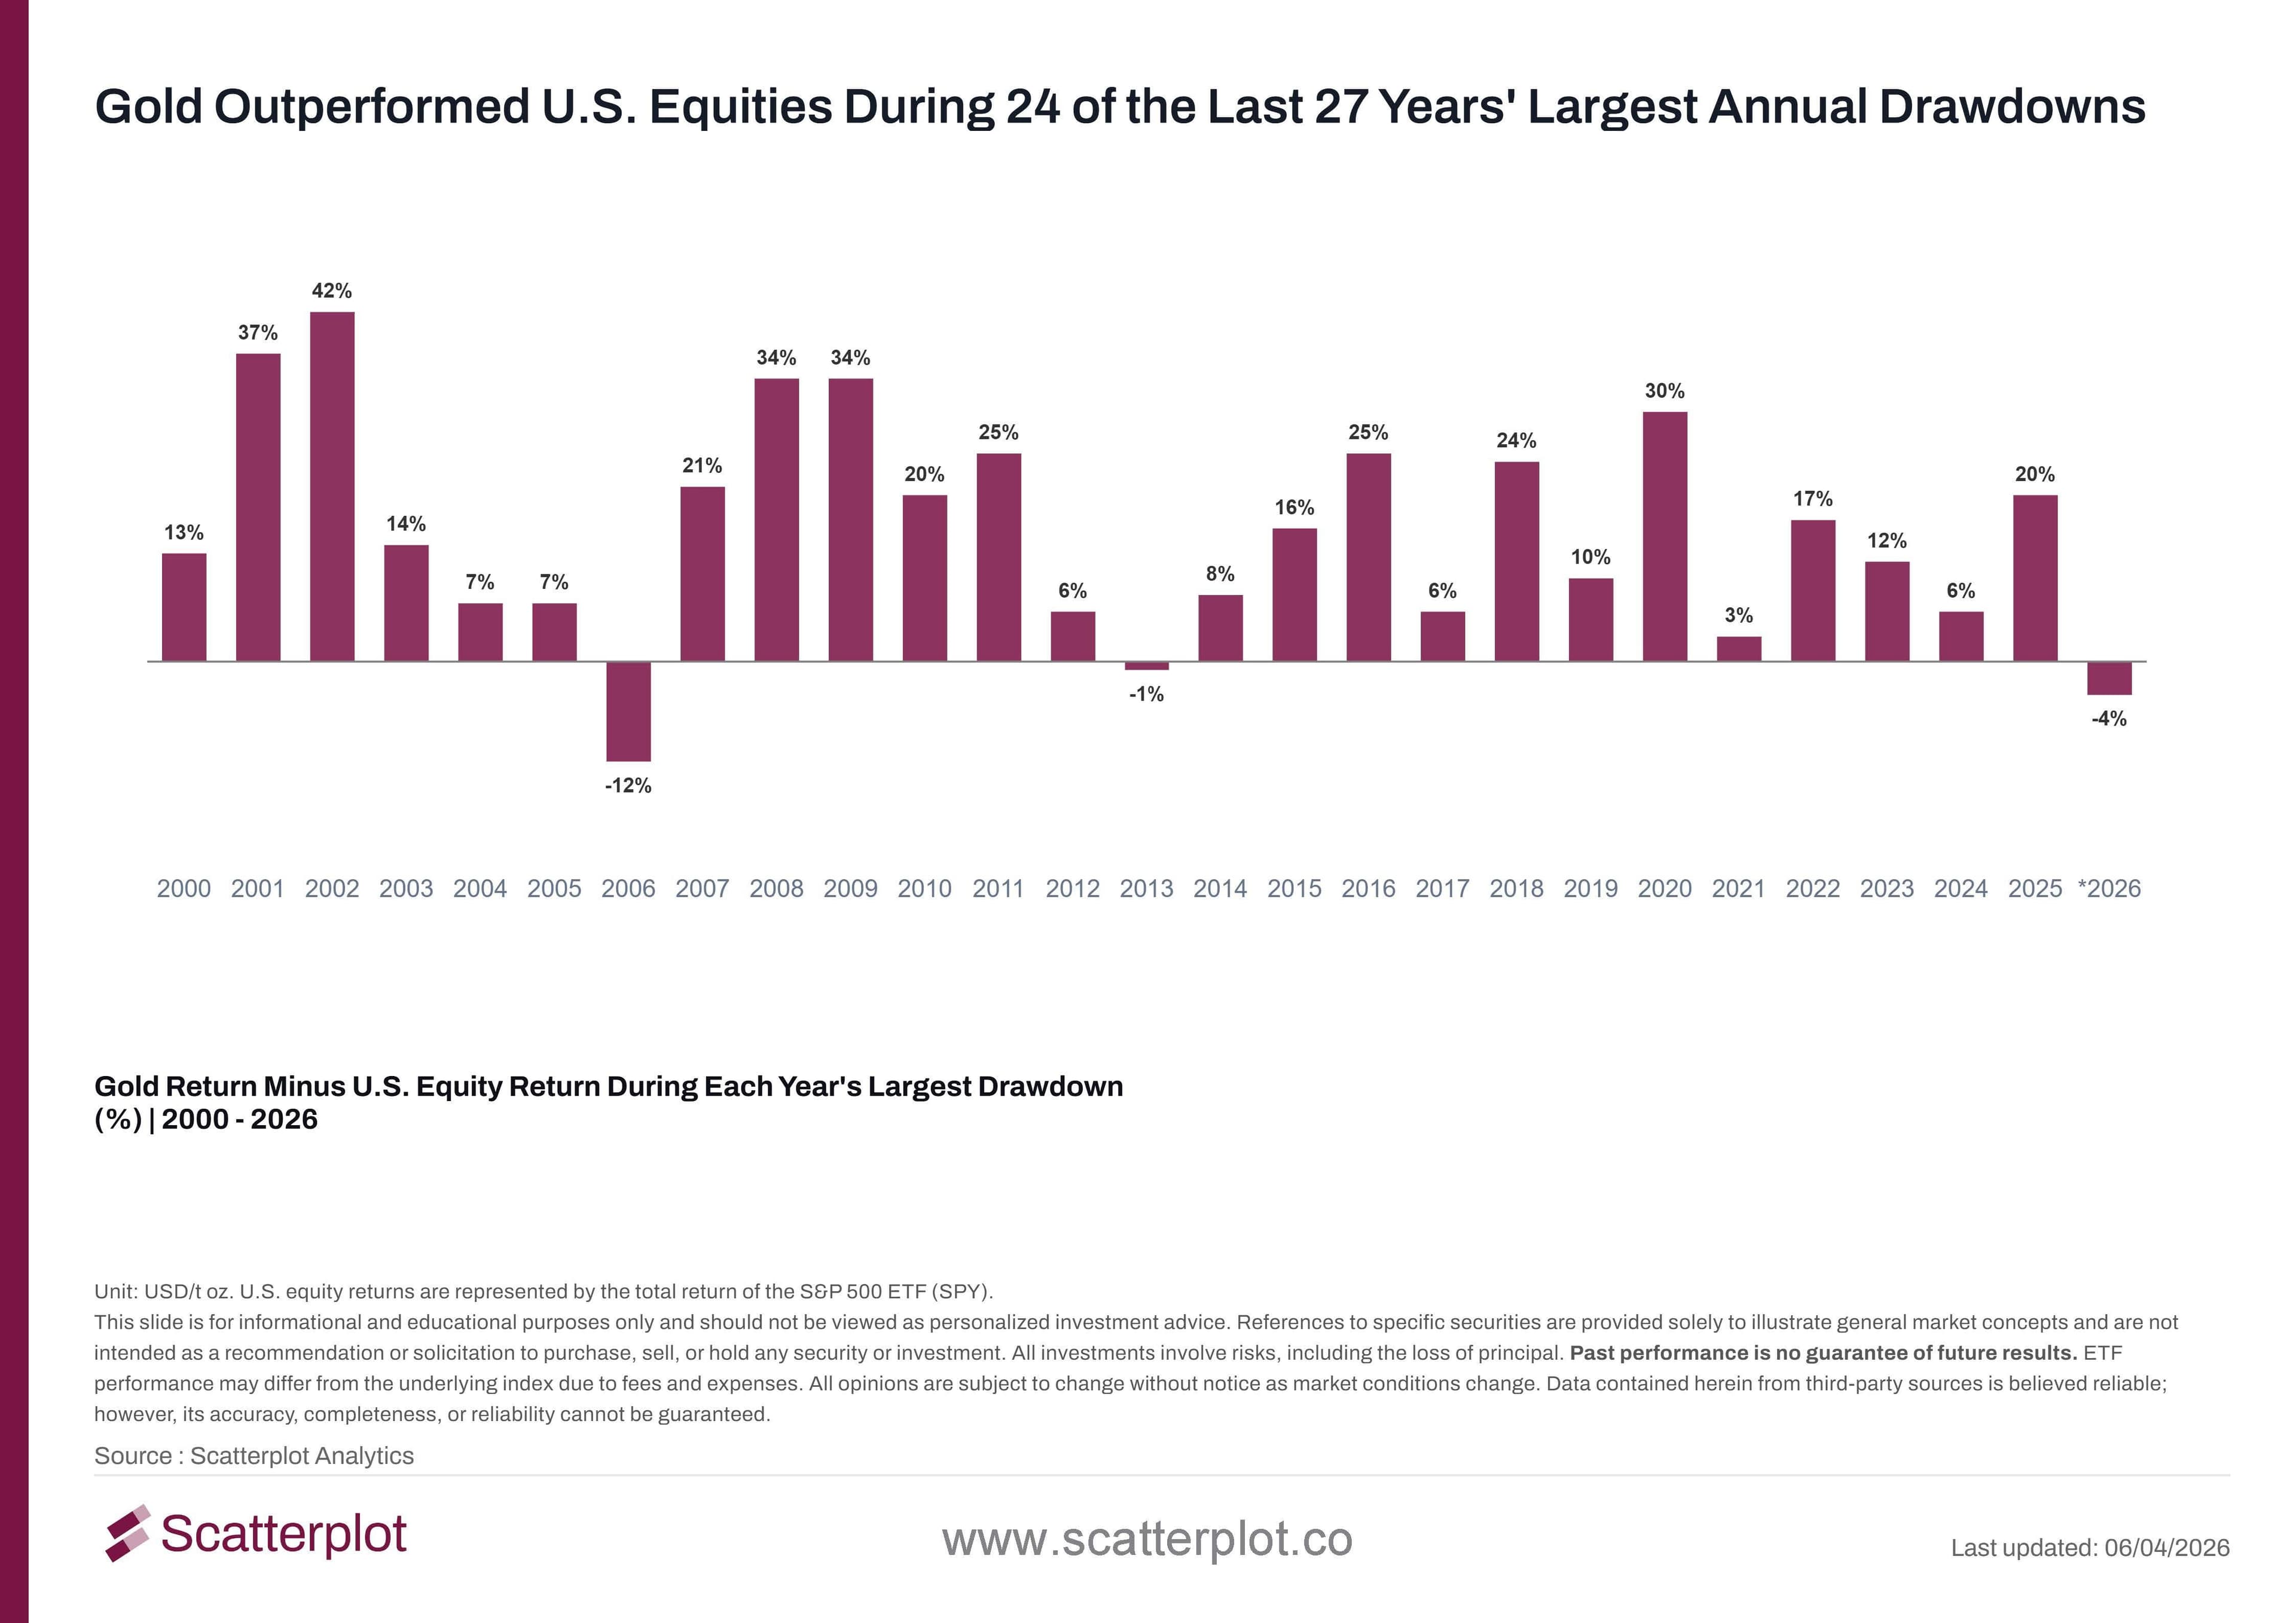
This chart updates daily in the Scatterplot portal.
Gold outperformed equities during the annual worst drawdown in 24 of 27 years. The breadth of this result across very different market environments - the dot-com bust, the financial crisis, the COVID crash, the 2022 rate shock - is notable.
The three exceptions - 2006, 2013, and 2026 year-to-date - are worth acknowledging. In each case, gold fell more than equities during the worst drawdown of that year. Each has its own story, which we will cover in a separate analysis.
The 24 out of 27 result is a high hit rate for any asset class. It suggests that at the moment equity investors most need protection - the worst drawdown of any given year - gold has more often than not been on the right side.
What Is the Best Way to Add Gold to Your Portfolio?
The data across four analytical lenses makes a consistent case for gold as a portfolio hedge. The harder question is how to hold it.
The answer from the data is straightforward: hold it as a strategic allocation as a percentage of your equity or risk assets, have a robust rebalancing process, and do not try to be tactical about it.
Gold protects during drawdowns and lags during recoveries. That asymmetry means that an investor who tries to add gold when markets start falling and reduce it when markets recover will consistently be late on both moves.
A strategic allocation - a fixed percentage of the equity sleeve, held consistently - captures the protection without requiring the investor to predict when it will be needed. The rebalancing discipline is what forces the investor to buy more gold after it has underperformed (during recoveries, when it is cheaper) and to trim it after it has outperformed (during drawdowns, when it is more expensive). This is structurally sound portfolio behavior.
Frequently Asked Questions
Does gold protect during major macro and geopolitical events?
The data across every major macro and geopolitical event since 1993 shows gold outperformed SPY in all but one instance, with an average outperformance of +7.3 percentage points. The only exception is the 2026 Iran War, for which the 3-month measurement window is now complete. Gold is not a mechanical hedge to every shock, but the historical hit rate is very high.
Did gold outperform equities during every major market correction?
Yes - across every equity drawdown of more than 10% since 1993, gold outperformed SPY in each one of those events. Whether gold posted positive or negative absolute returns during those periods, it consistently fell less than equities. The flip side is equally consistent: during the recovery phases that followed those same corrections, gold underperformed SPY every single time.
How often does gold outperform equities during annual market downturns?
Looking at the worst equity drawdown within each calendar year from 2000 to 2026, gold outperformed SPY in 24 of those 27 years. This is not just a financial crisis result - it has held across very different market environments including mild pullbacks in otherwise strong bull market years.
How do I get access to these charts?
All charts are available in our portal at Scatterplot.co and update every day. Our portal covers a much broader set of charts across gold, other commodities, and asset classes. Use the smart keyword search to find exactly what you need - search "gold" to pull up the full suite of gold analytics in one click. Monitor performance in real time as market conditions evolve.
Disclosure
This content is provided for informational and educational purposes only and should not be relied upon as investment advice. No representation is made that any investment strategy or market view will be successful. Past performance is not indicative of future results. All investing involves risk, including the loss of principal. Please refer to our Terms and Conditions for more information.


Enjoyed this? Get more in your inbox.
Weekly insights for advisors
— charts, research, and practical tools. No fluff.
Investment Foundations
Understanding Recency Bias: What U.S. Equity Returns Reveal About Investor Expectations
Exploring Recency Bias in Investors Using Recent and Long-Term U.S. Equity Data.
Read moreSanjeev Pati, CFA
July 6, 2026 · 4 min read
Investment Foundations
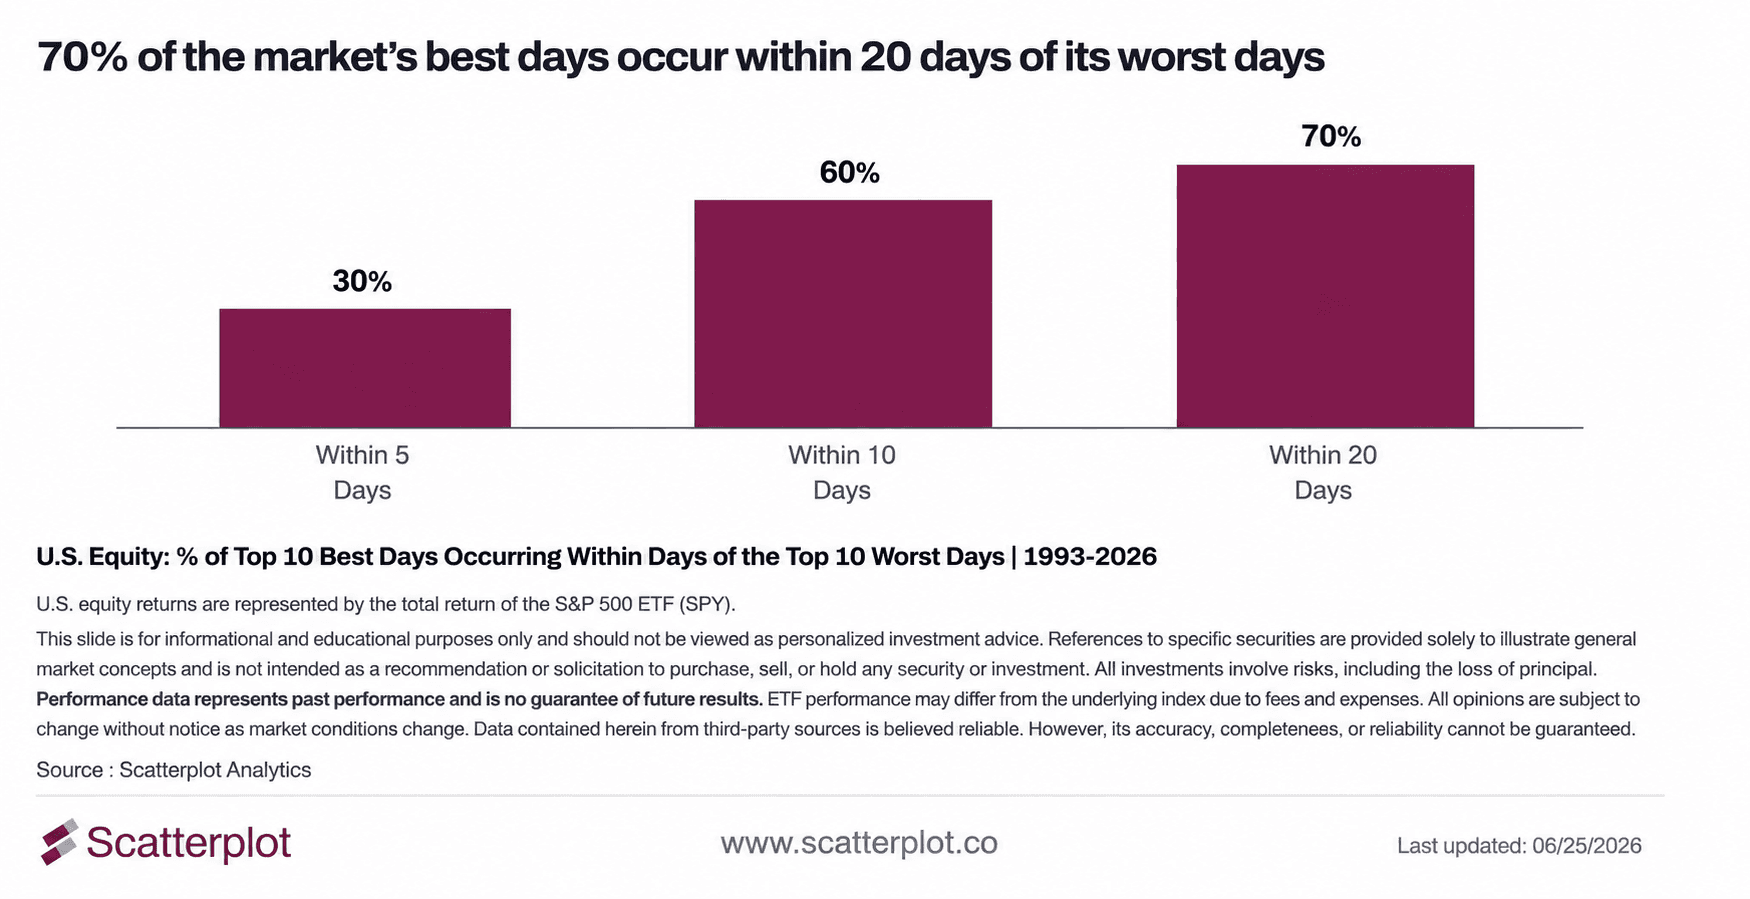
Why Market Timing Is So Hard: 70% of the best days in the market land near the worst ones
Market timing is hard. Since 1993, 70% of the S&P 500's ten best trading days occurred within 20 days of one of its ten worst trading days, making it difficult to capture one without being exposed to the other.
Read moreSanjeev Pati, CFA
June 26, 2026 · 5 min read