

Understanding Recency Bias: What U.S. Equity Returns Reveal About Investor Expectations
Exploring Recency Bias in Investors Using Recent and Long-Term U.S. Equity Data.

Sanjeev Pati, CFA
Founder, Scatterplot
Recency bias is the tendency to weight recent experiences more heavily than longer-term history when forming expectations about the future. It's a well-documented pattern in behavioral finance that shapes how people forecast what comes next based on what has happened most recently.
Using recent U.S. equity return data, this post looks at how recency bias sets in for investors, comparing short-term returns against the longer-term record.
Every time an investor has checked a performance statement in the last six years, there has been roughly a coin-flip chance the trailing 12-month U.S. equity return was above 20%. That kind of repeated exposure sets an expectation based on recent experience, whether an investor intends it to or not.
Key Takeaways
- Since 2020, the average 12-month U.S. equity return, as measured by daily rolling periods, has been 17.6%, well above the 12.3% long-term average since 1994.
- About half (44.9%) of rolling 12-month returns for US Equity since 2020 have been above 20%, versus 32.5% since 1994.
How Often Have U.S. Stocks Delivered 20%+ Returns in a 1-Year Period?
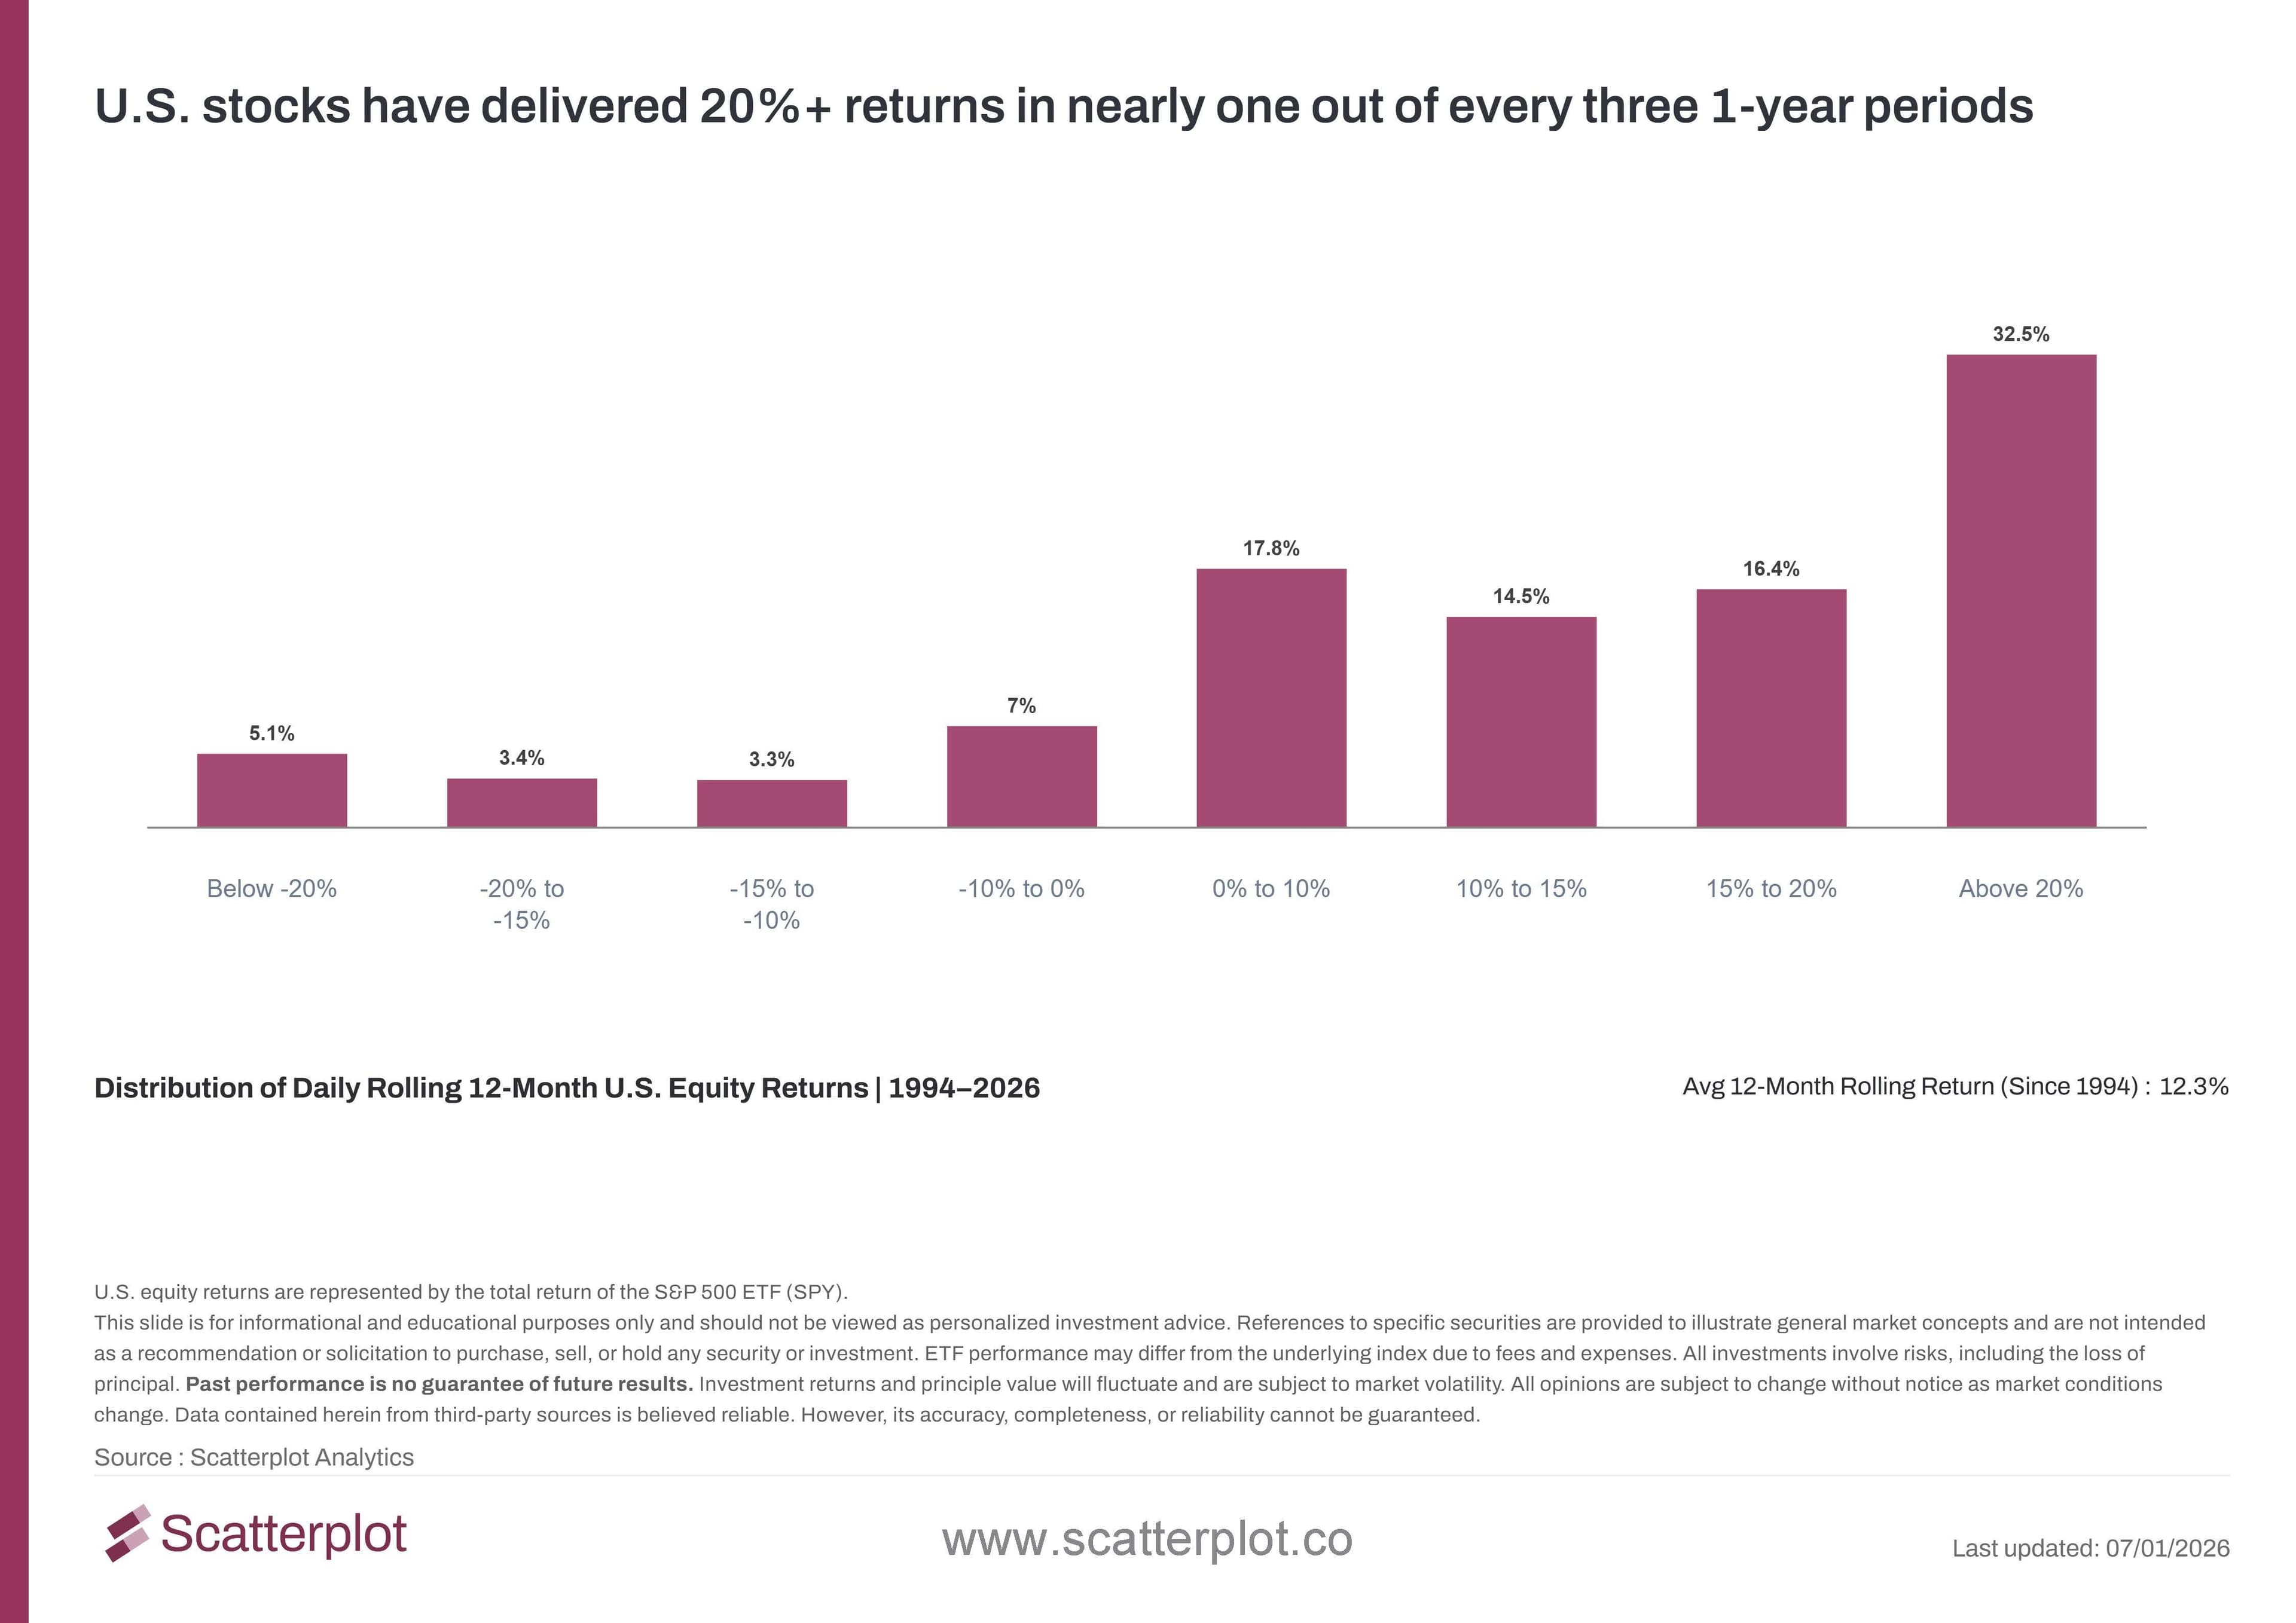
Measuring since 1994, the chart below shows the distribution of U.S. equity returns. We use daily rolling periods of 12 months, covering over 8,000 observations in total. Returns above 20% would have occurred in almost one-third of all periods (32.5%), the highest-occurring return group in the data set.
This chart updates daily in the Scatterplot portal.
Has Recent Performance Been Unusual Compared to History?
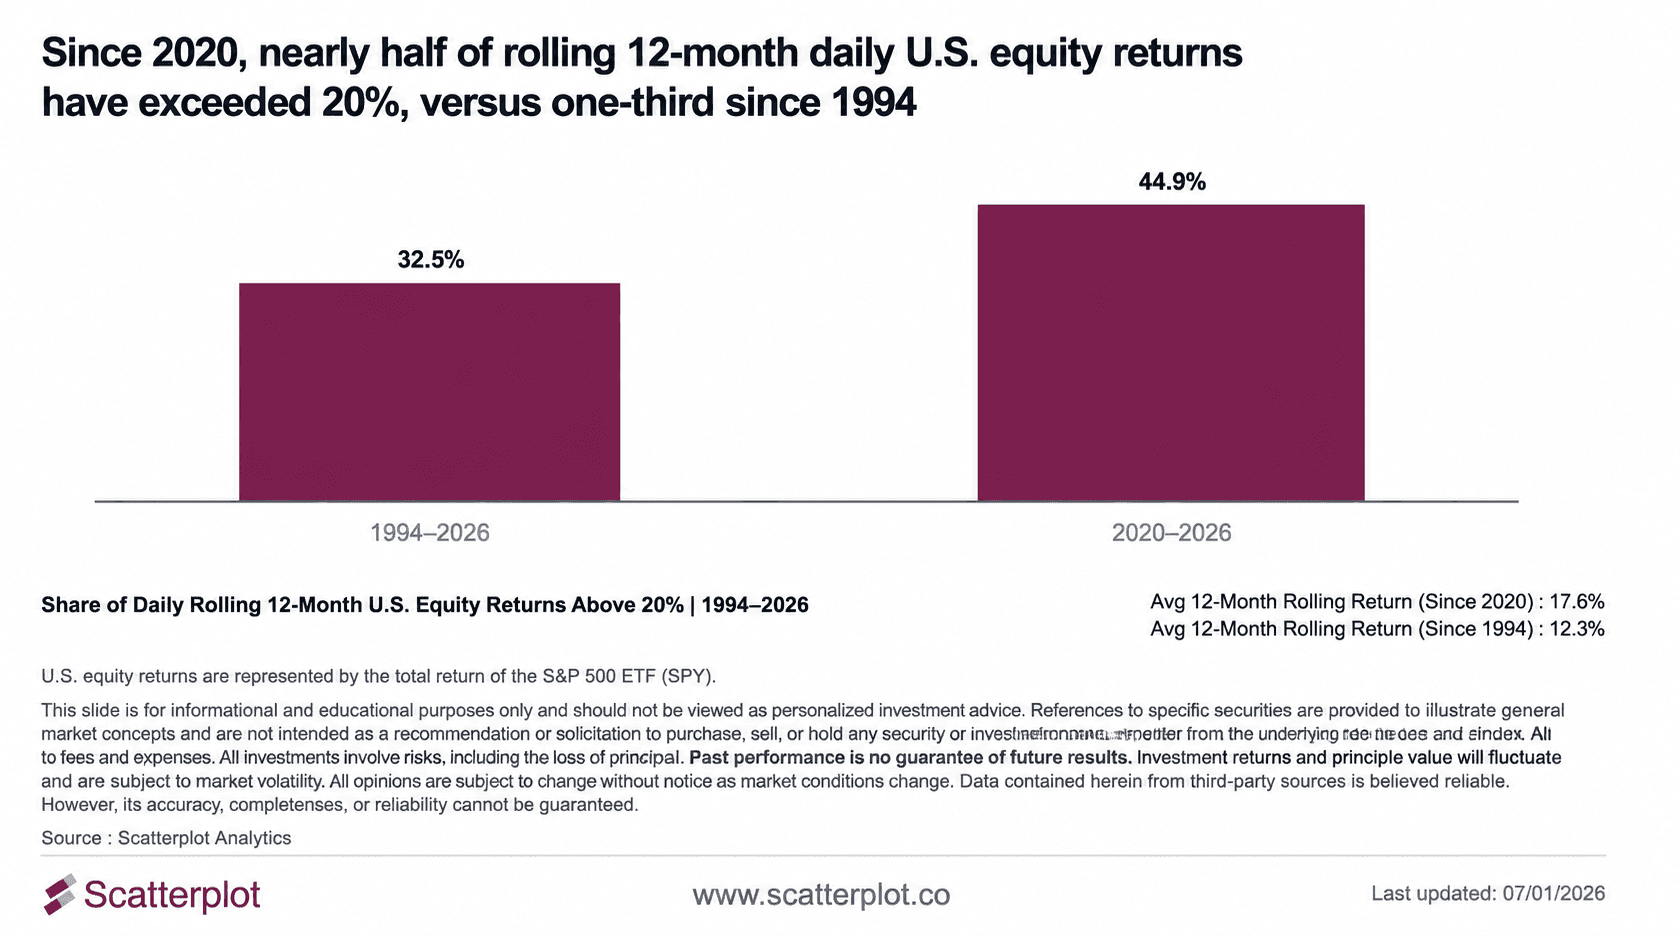
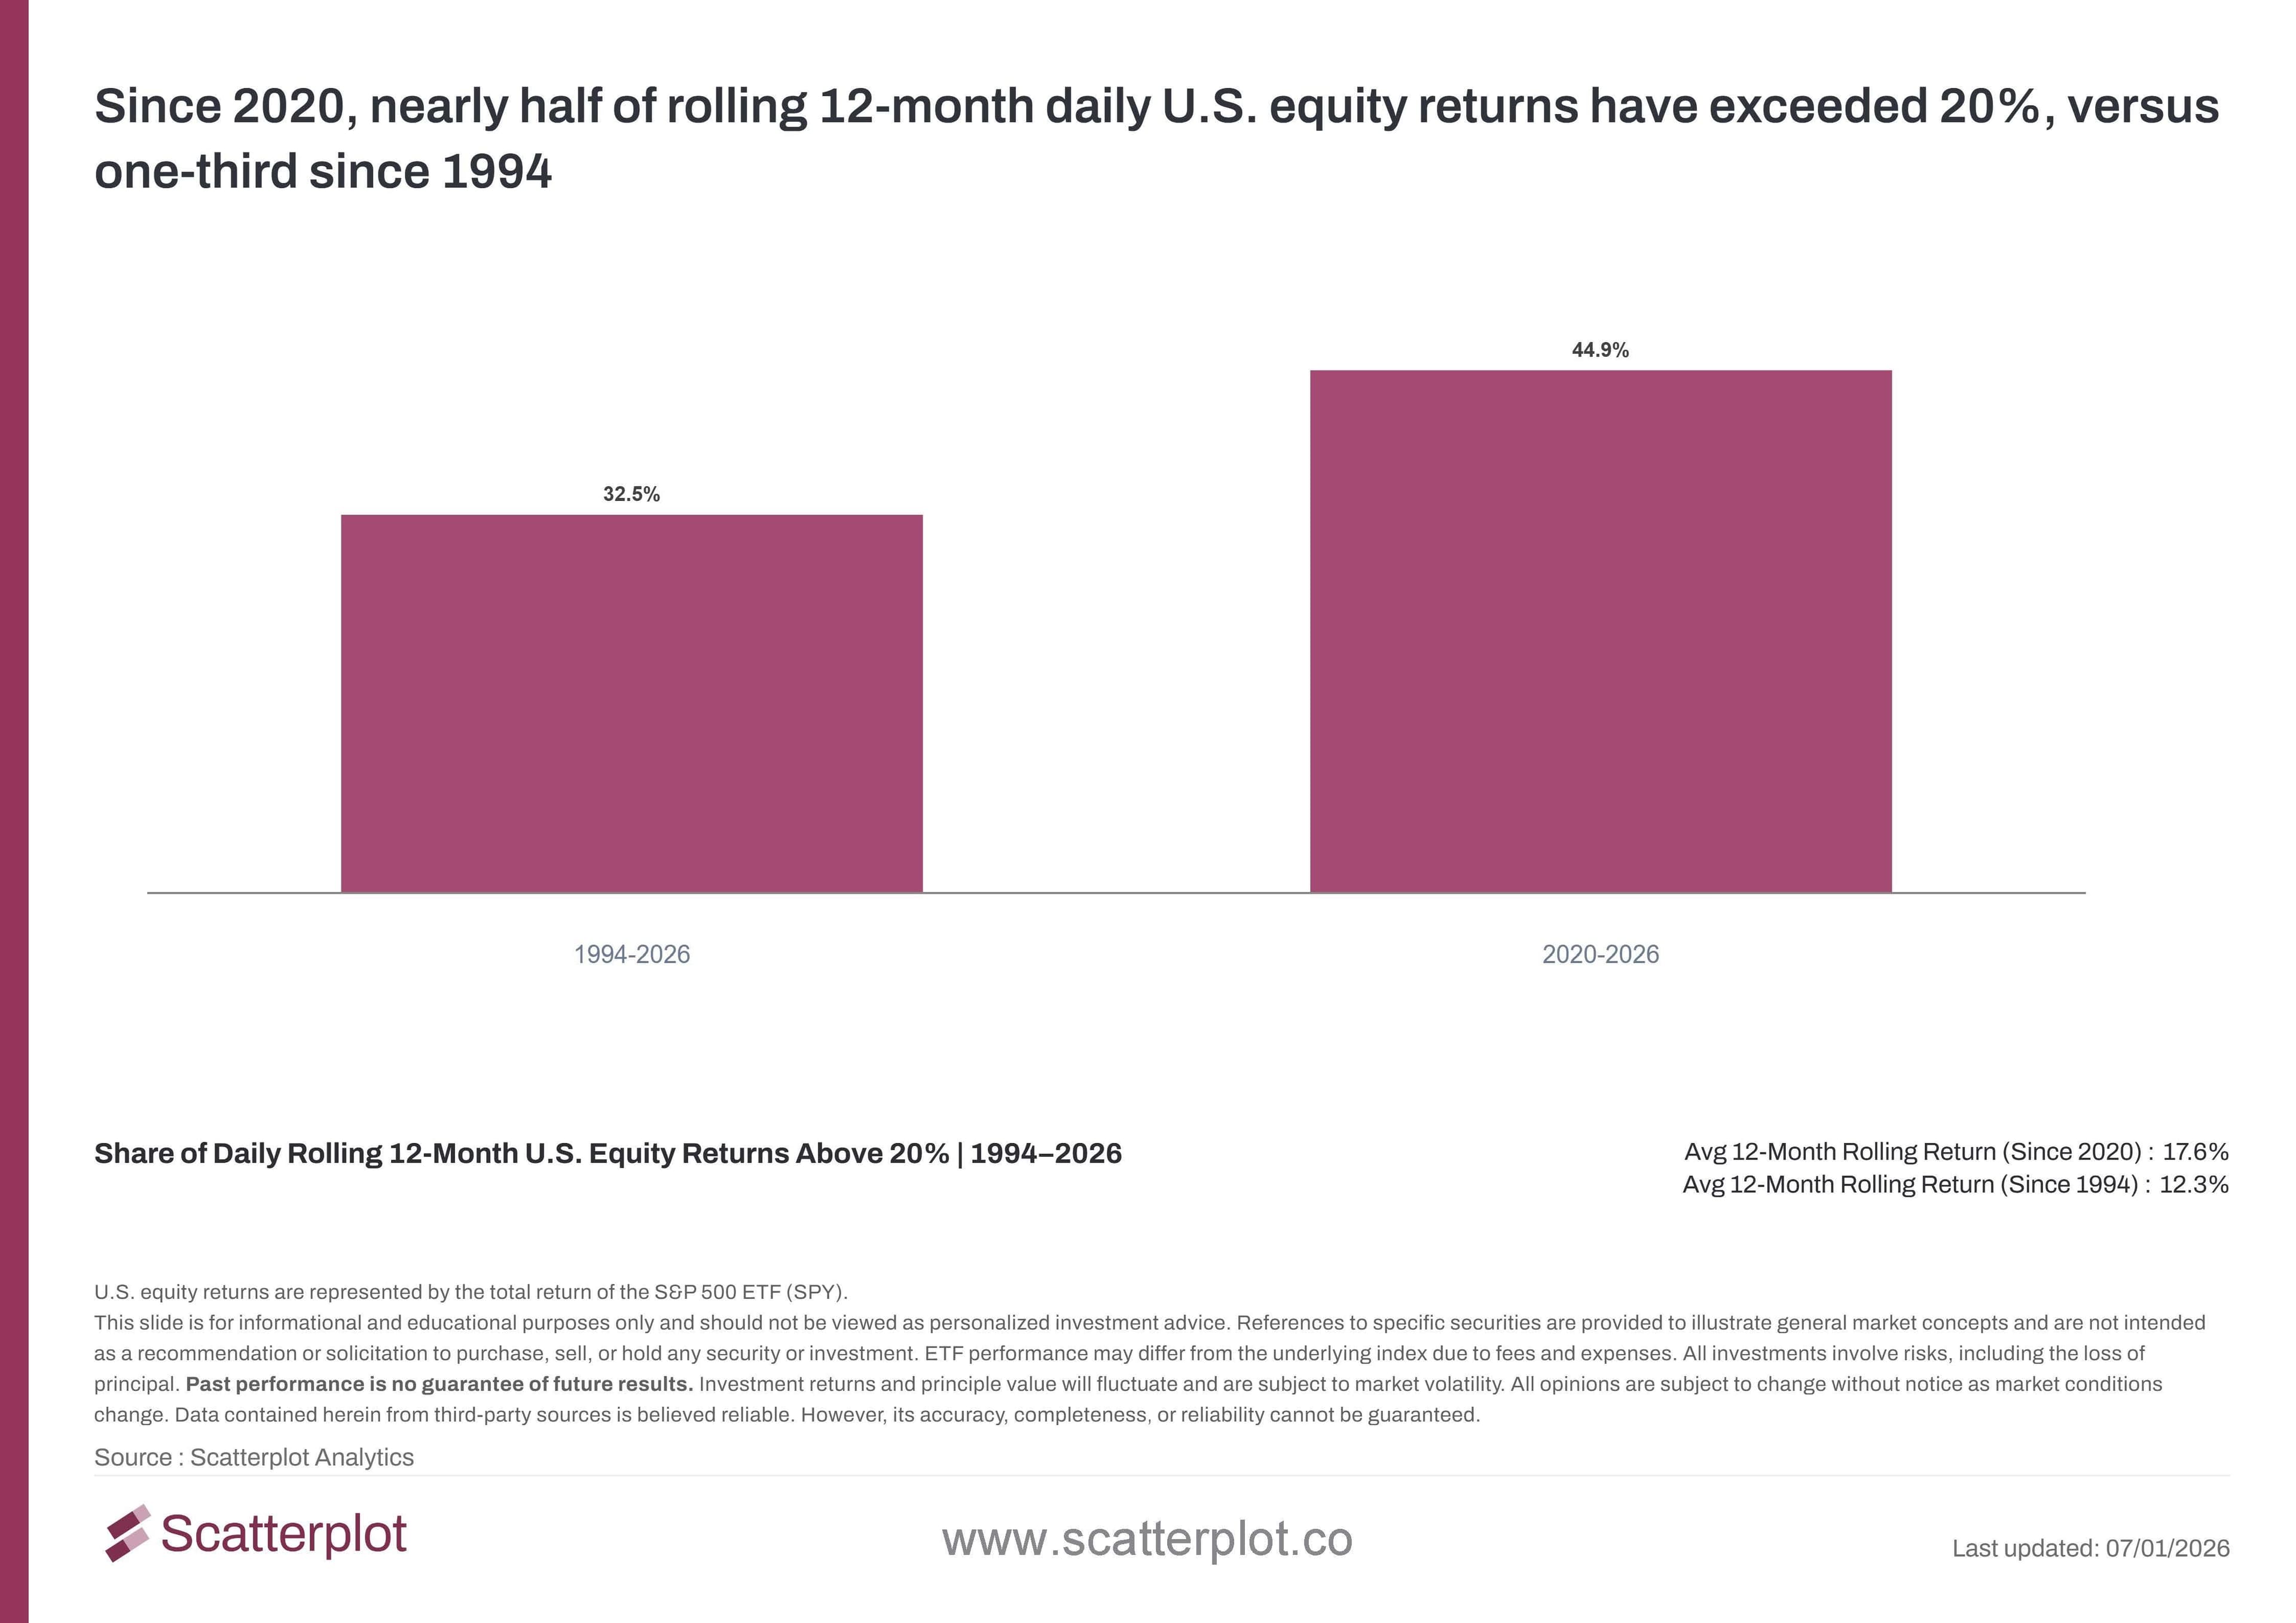
The next chart isolates that 32.5% figure above and compares it directly to the same measure since 2020.
This chart updates daily in the Scatterplot portal.
Using the same rolling 12-month methodology, the share of periods with returns above 20% since 2020 would have been 44.9%, compared with 32.5% since 1994.
The average rolling 12-month return since 2020 has been 17.6%, versus 12.3% since 1994.
This gap is a useful illustration of recency bias: when a shorter, more recent stretch of data produces outcomes well above the long-term average, it can shift what investors expect going forward.
What Does This Mean for Portfolio Expectations?
For advisors with clients invested in U.S. equities, this pattern shows up directly in client conversations. Over the last six years, a client checking a performance statement has seen a 12-month return above 20% almost half the time. Repeated across several years, that kind of experience shapes expectations even in the most rational investors, not because of a lapse in judgment, but because recent, repeated outcomes are a powerful input into how people forecast the future. This is recency bias in practice.
Frequently Asked Questions
What is recency bias in investing?
Recency bias is the tendency to weight recent experiences more heavily than longer-term history when forming expectations about the future. In U.S. equity markets, several years of unusually strong returns can lead investors to view those returns as typical rather than as one period within a wider historical range.
How often have U.S. equity returns exceeded 20% in a rolling 12-month period?
Since 1994, rolling 12-month U.S. equity returns above 20% would have occurred in 32.5% of periods, based on SPY total return data adjusted for dividends. Since 2020, that share rises to 44.9%.
Disclosure
U.S. equity returns are represented by the total return of the S&P 500 ETF (SPY). This post is for informational and educational purposes only and should not be viewed as personalized investment advice. References to specific securities are provided to illustrate general market concepts and are not intended as a recommendation or solicitation to purchase, sell, or hold any security or investment. ETF performance may differ from the underlying index due to fees and expenses. All investments involve risks, including the loss of principal. Past performance is no guarantee of future results. Investment returns and principal value will fluctuate and are subject to market volatility. All opinions are subject to change without notice as market conditions change. Data contained herein from third-party sources is believed reliable; however, its accuracy, completeness, or reliability cannot be guaranteed.


Enjoyed this? Get more in your inbox.
Weekly insights for advisors
— charts, research, and practical tools. No fluff.
Investment Foundations
Fed Rate Hikes Since 1994: What Happened in Each Cycle
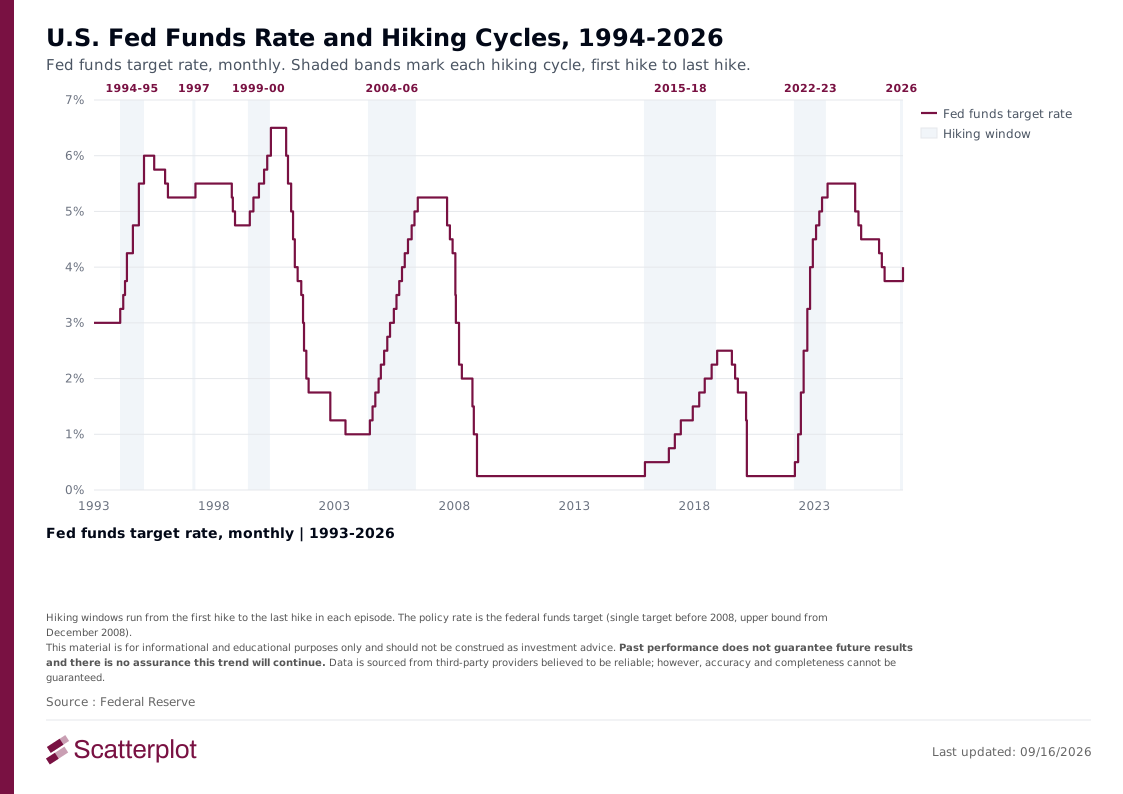
Inflation, unemployment and equity returns across seven Fed rate-hike episodes since 1994, each with its start, end and accompanying FOMC statement.
Read moreSanjeev Pati, CFA
September 21, 2026 · 10 min read
Market Insights
September 2026 Market Update: Oil Up, Gold and Long-Term Treasuries Down Since the Iran Conflict
September 2026 market update: U.S. stocks sit 2.6% below their August high, and gold and long-term Treasuries are down since the Iran conflict. 10 charts.
Read moreSanjeev Pati, CFA
September 11, 2026 · 10 min read