

Why Market Timing Is So Hard: 70% of the best days in the market land near the worst ones
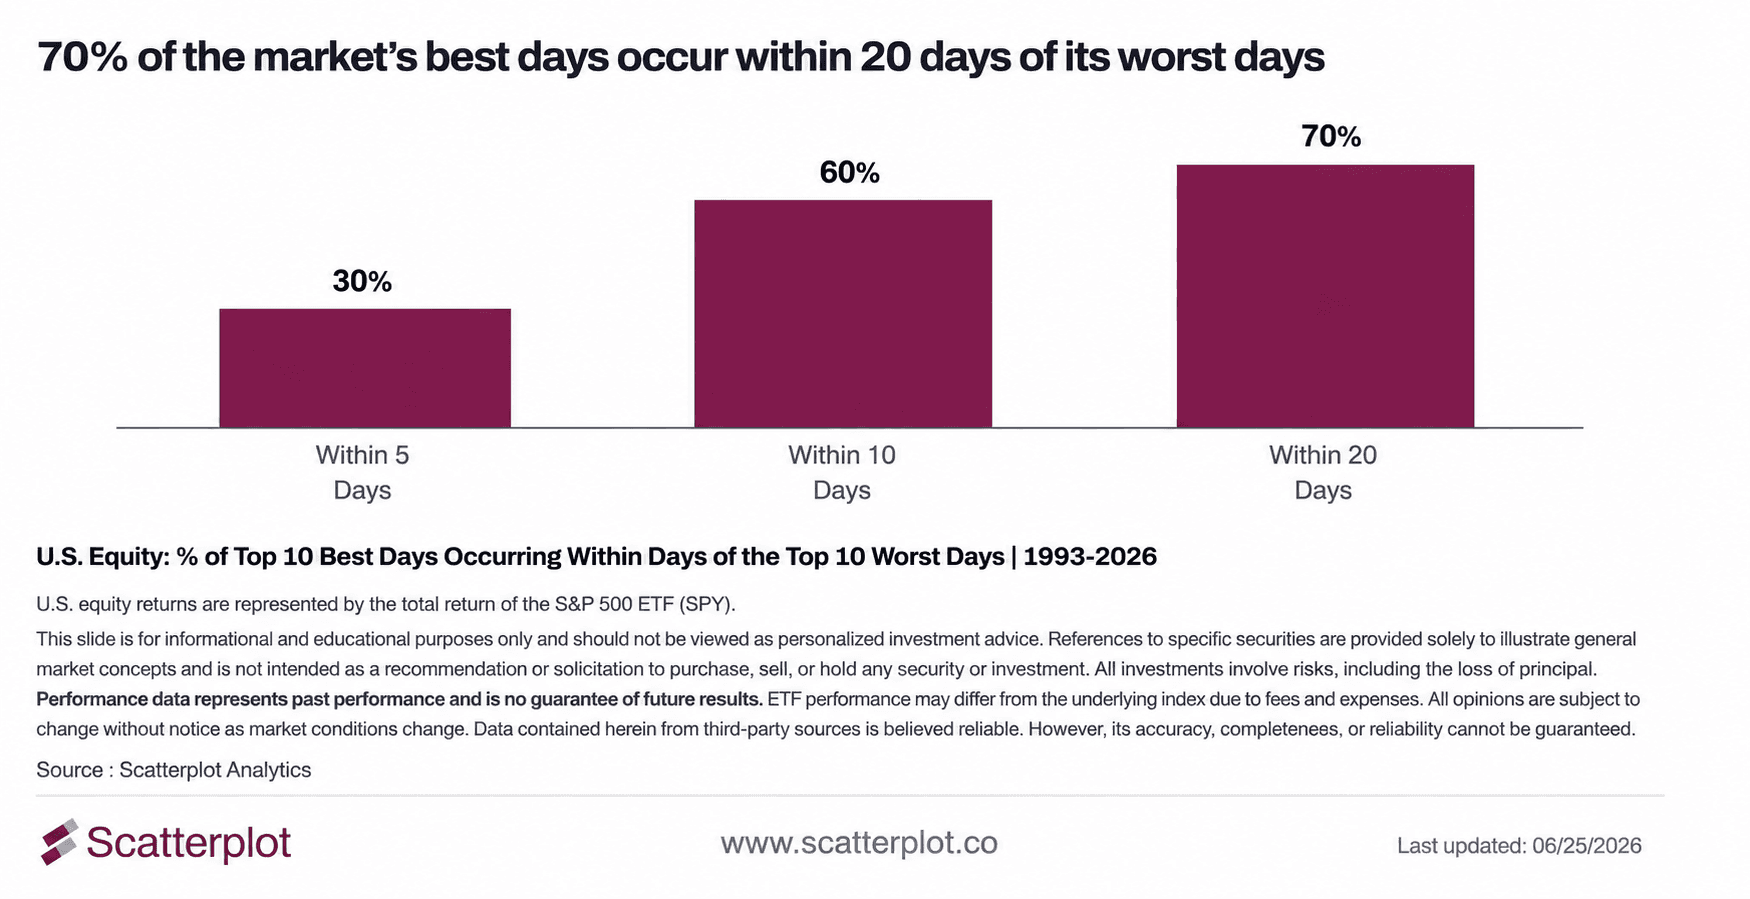
Market timing is hard. Since 1993, 70% of the S&P 500's ten best trading days occurred within 20 days of one of its ten worst trading days, making it difficult to capture one without being exposed to the other.

Sanjeev Pati, CFA
Founder, Scatterplot
Key Takeaways
- 70% of the ten best days since 1993 occurred within 20 days of one of the ten worst days, and 60% occurred within 10 days.
- Because the best and worst days fall so close together, an investor stepping out of the market to avoid one of the worst days would, in most cases, have also missed one of the best days during the same window.
- Since 1993, missing the 10 best days would have cut SPY's annualized return from 10.8% to 8.0%, while avoiding the 10 worst days would have raised it to 13.7%.
- Missing the 20 best days would have cut the annualized return to 6.2%, while avoiding the 20 worst days would have raised it to 15.7%.
How much do the market's best and worst days affect your return?
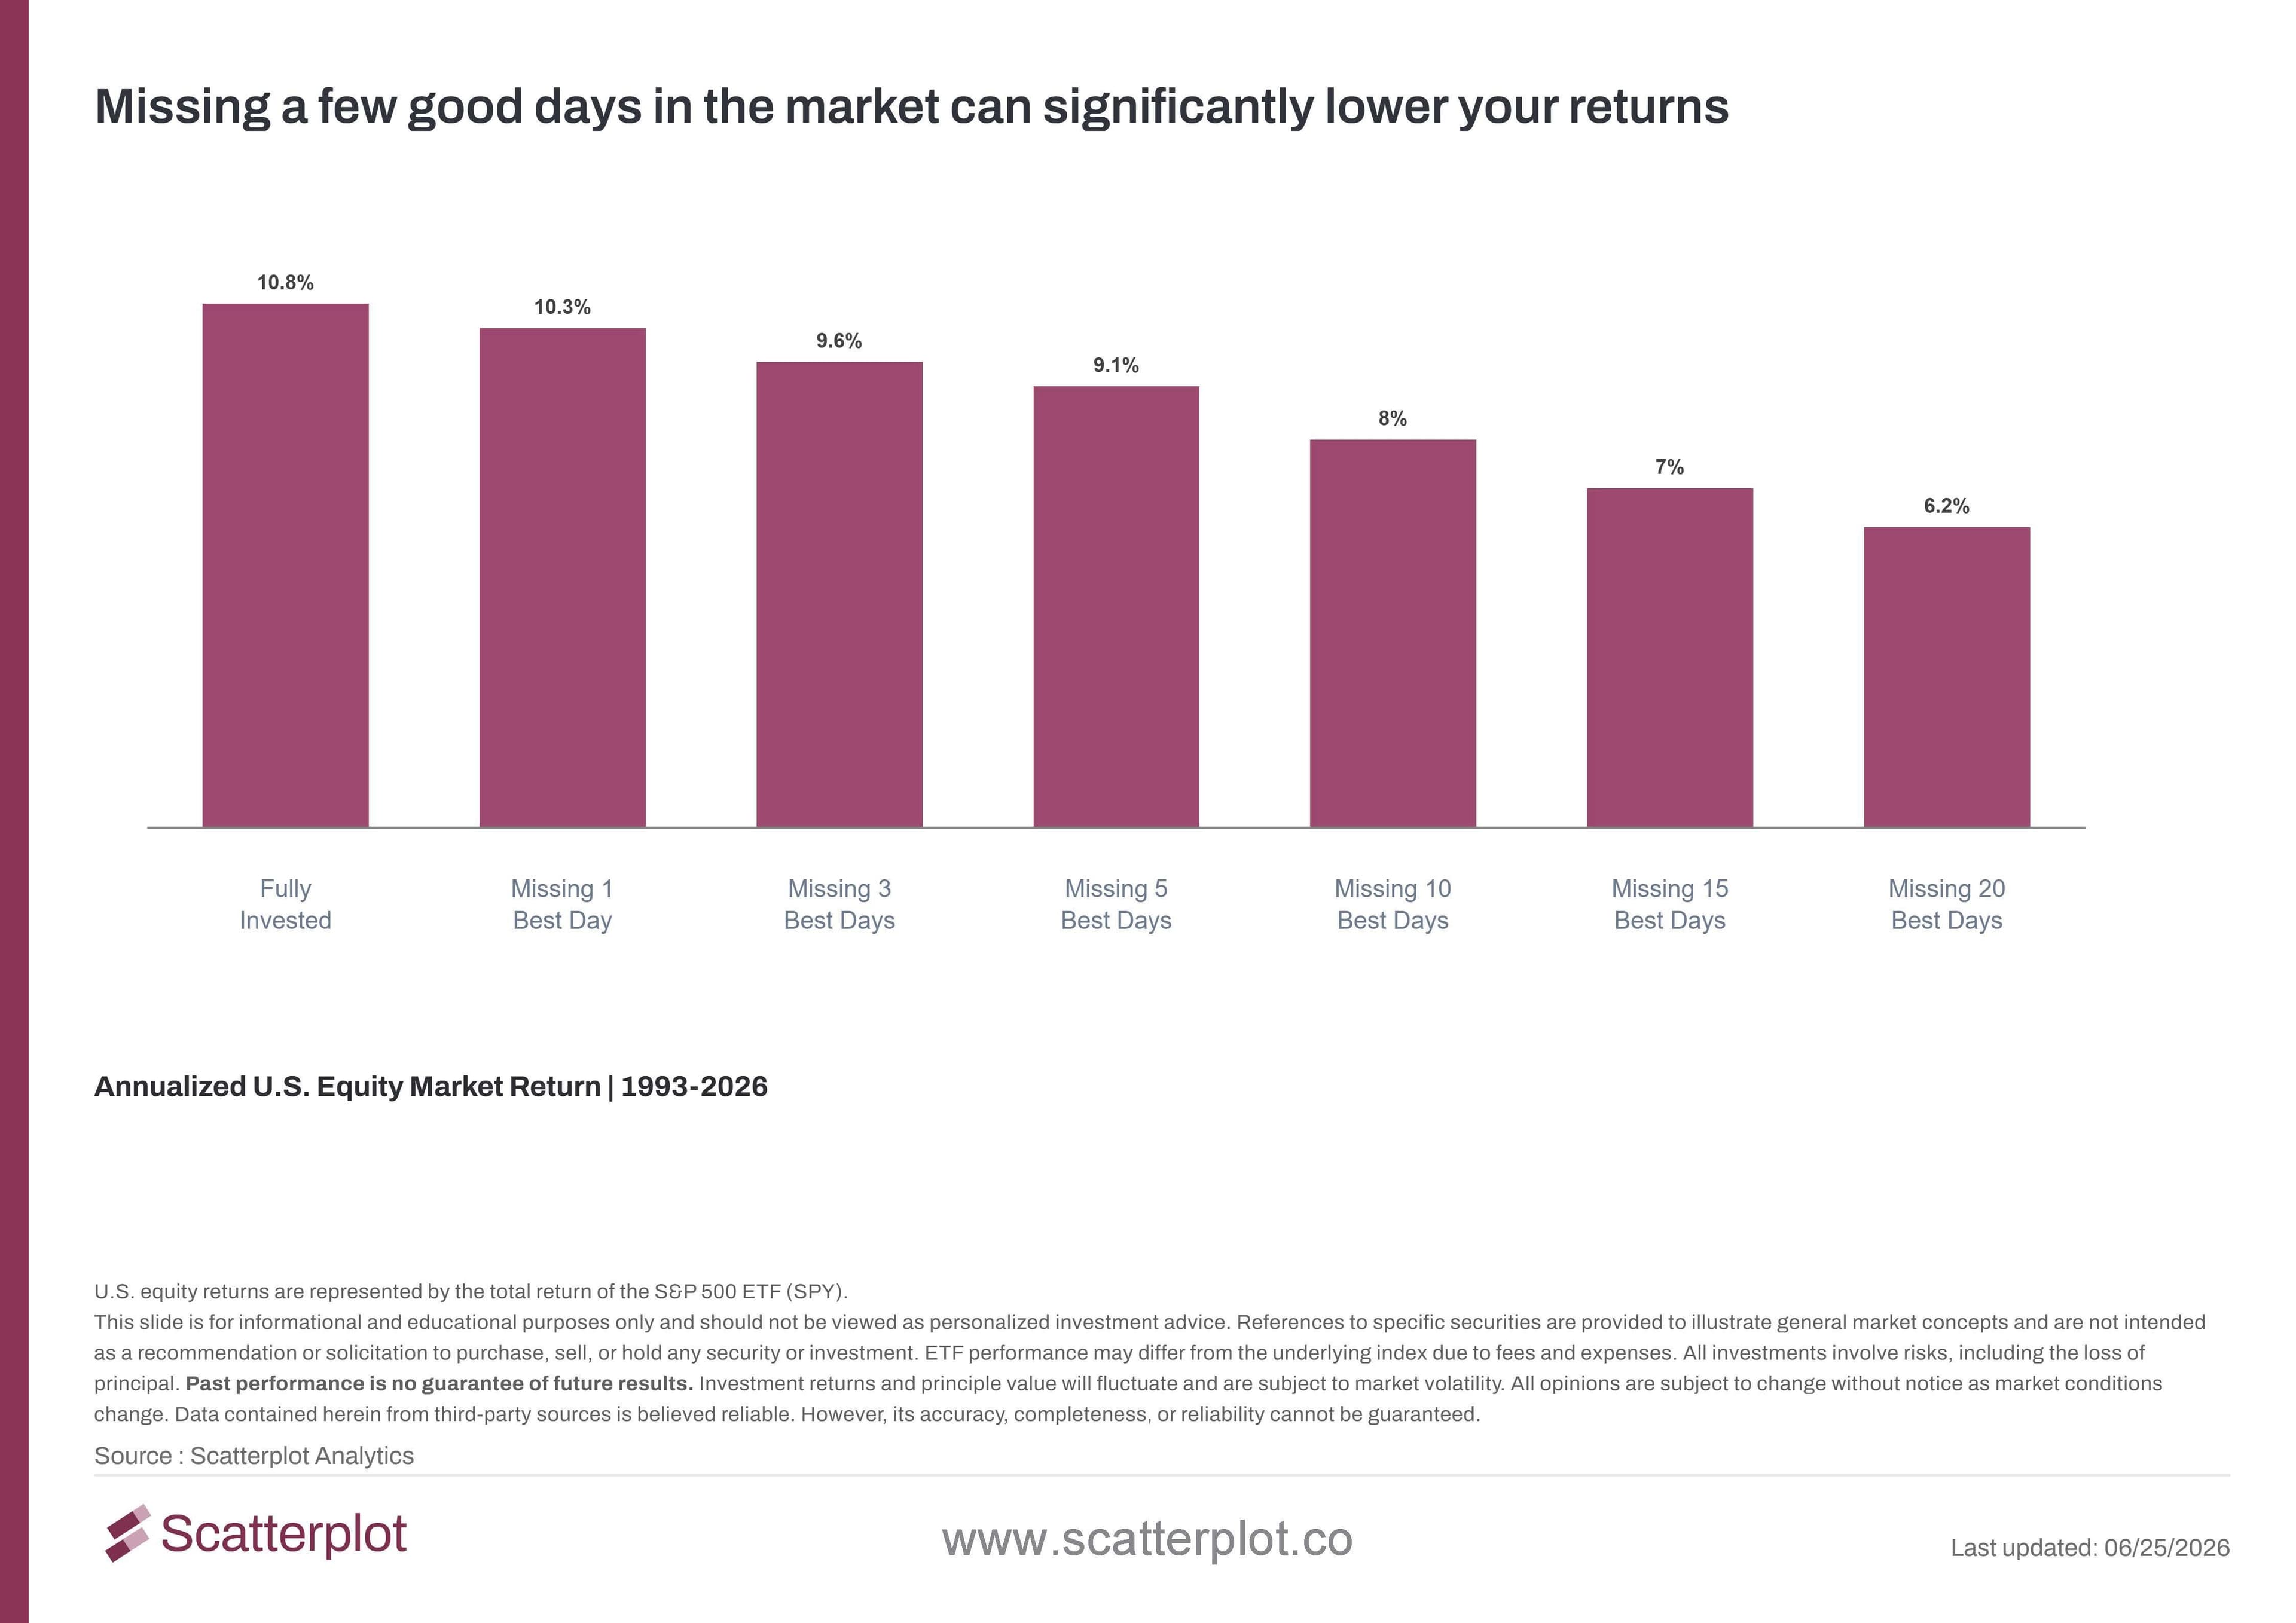
The chart below shows what happens to SPY's annualized return since 1993 as more of the market's best days are missed.
This chart updates daily in the Scatterplot portal.
Fully invested, SPY returned 10.8% annualized since 1993. Missing just the single best day brings that down to 10.3%. By the time 20 best days are missed, the annualized return falls to 6.2%, roughly half of what a fully invested investor would have earned over the same period.
The same calculation works in reverse. Avoiding the 10 worst days since 1993 would have raised SPY's annualized return from 10.8% to 13.7%. Avoiding the 20 worst days would have raised it further, to 15.7%. Avoiding the worst days would have meaningfully increased returns, more than missing the best days would have reduced them. On paper, this makes a case for trying to dodge downturns. The next section shows why that has historically been difficult to do.
Why Capturing the Market's Best Days Likely Means Enduring Its Worst Ones
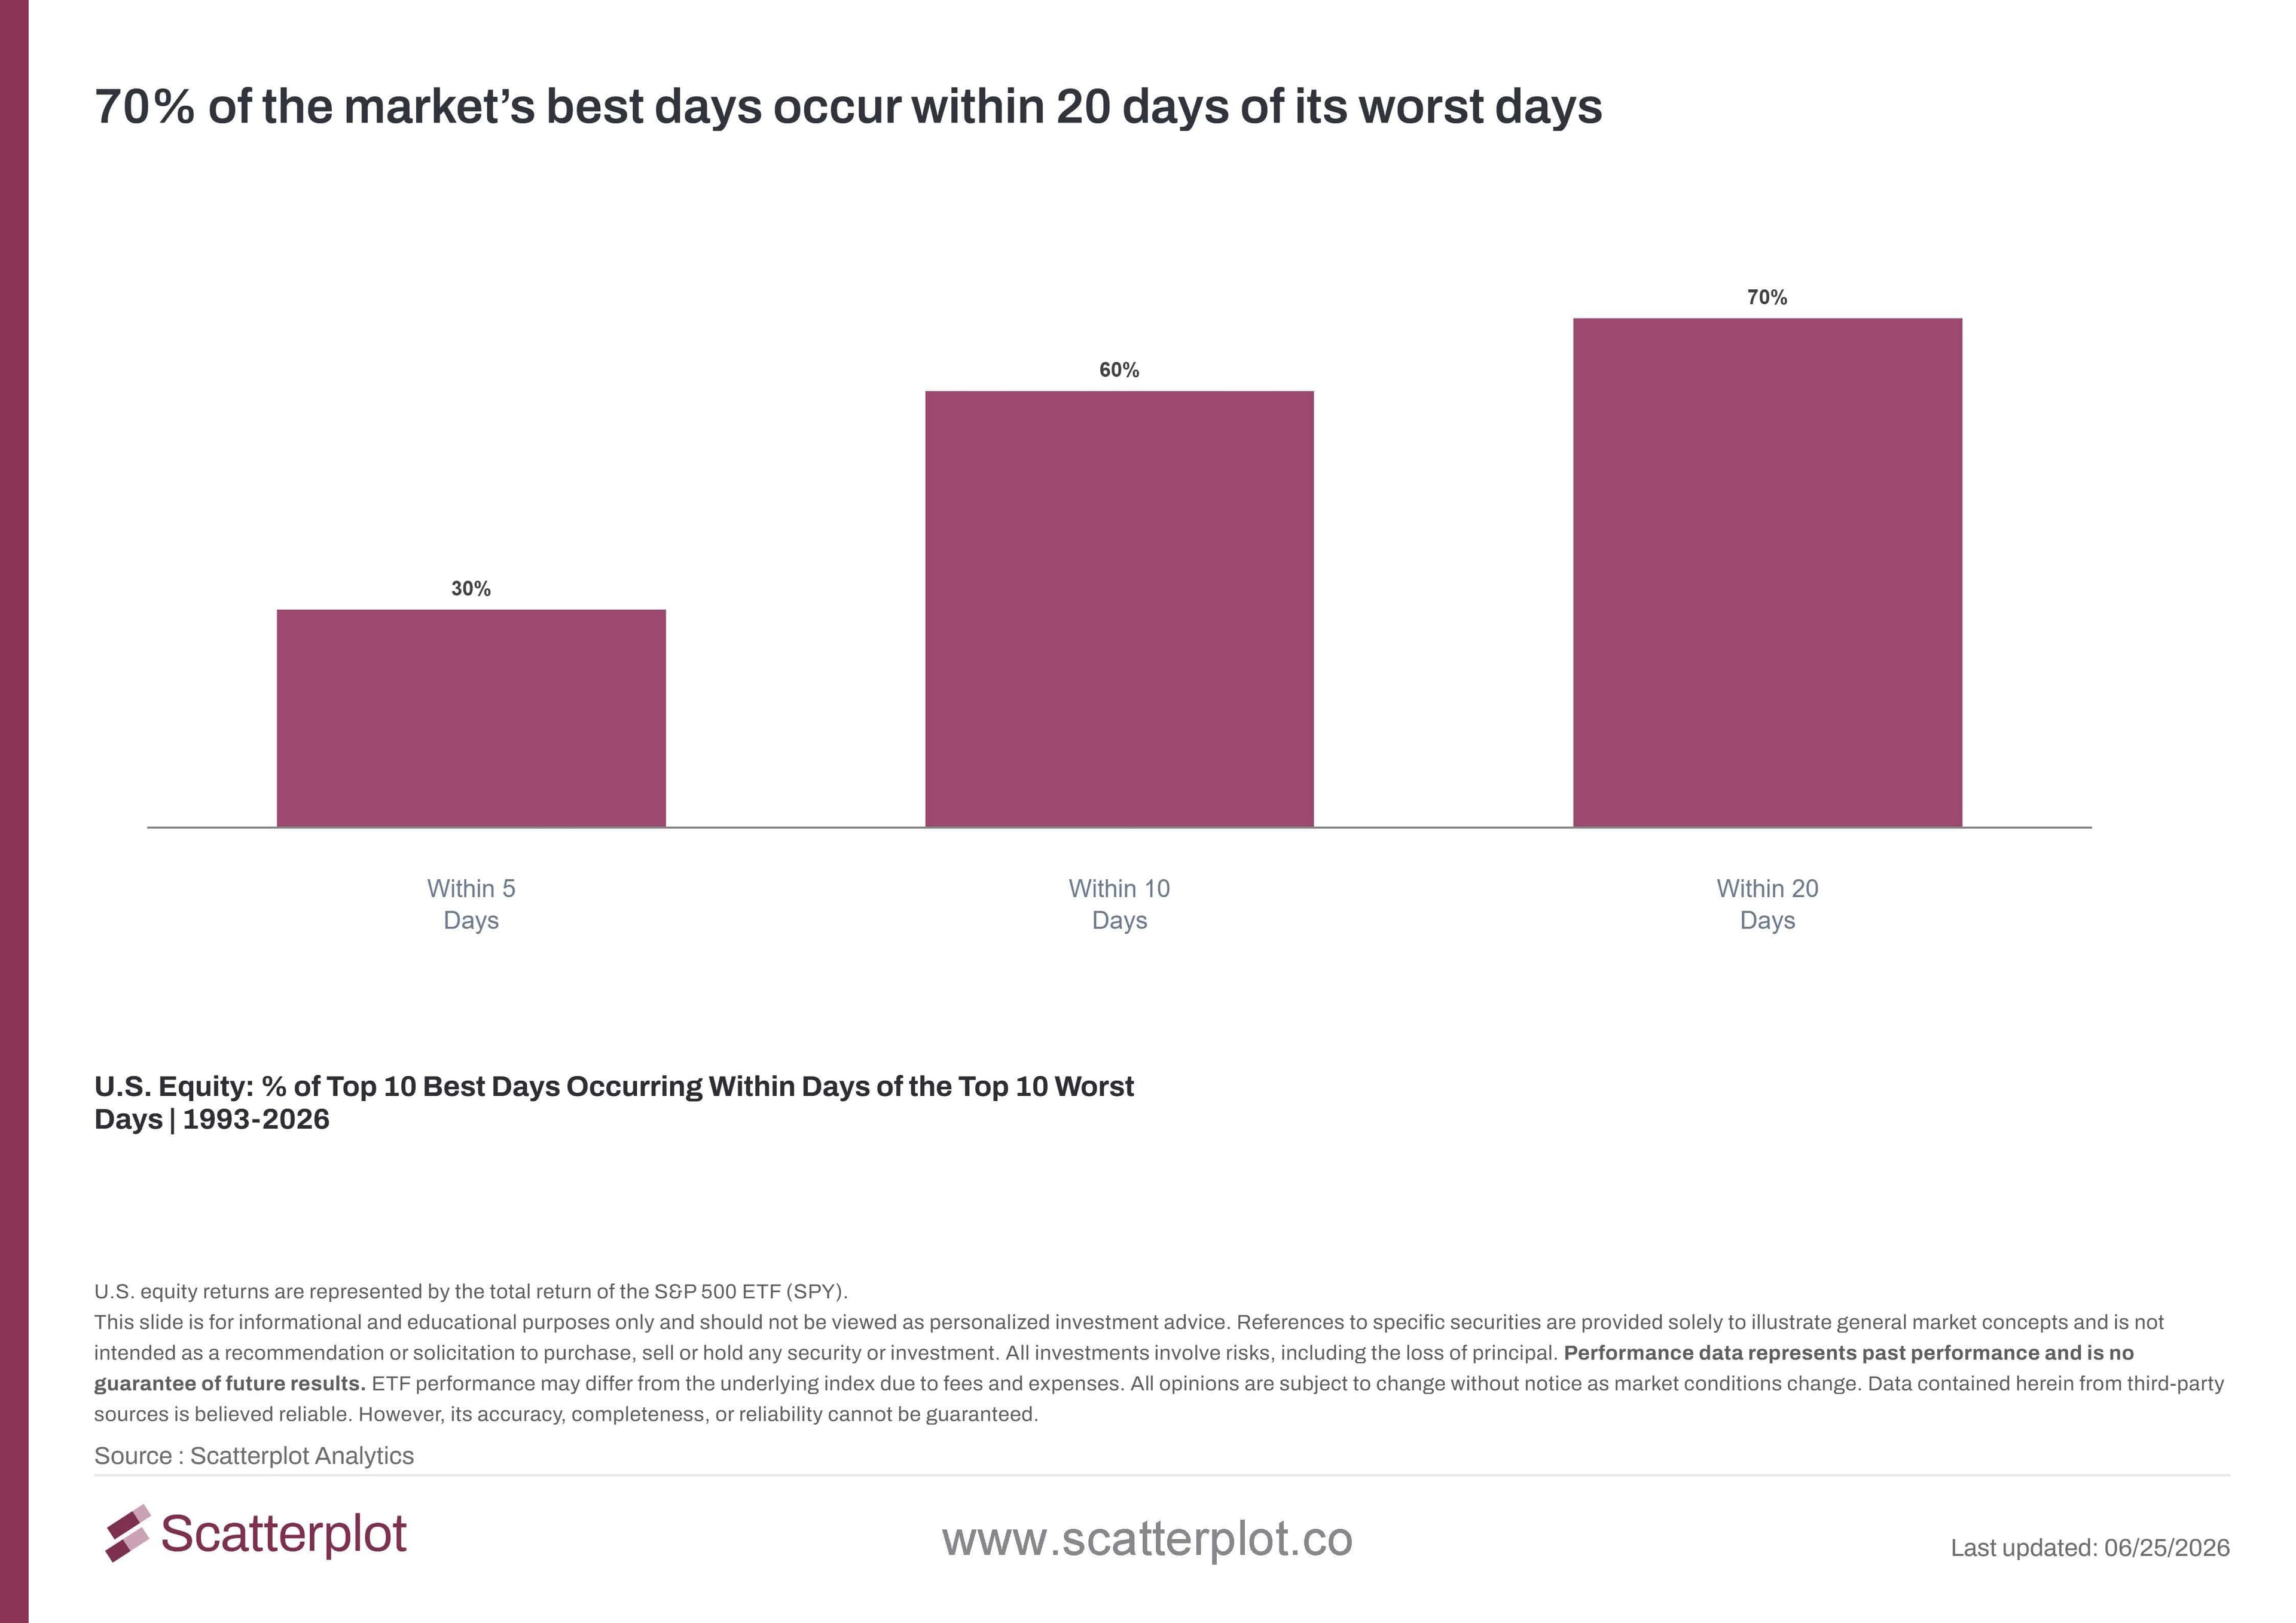
The chart below shows how often the market's best days have occurred close to its worst days since 1993.
This chart updates daily in the Scatterplot portal.
Since 1993, 30% of the ten best days occurred within 5 days of one of the ten worst days, 60% occurred within 10 days, and 70% occurred within 20 days. An investor who stepped out of the market to avoid a downturn would, in most cases, have also been out of the market for one of its strongest days.
What were the market's best and worst trading days since 1993?
The table below lists the ten best and ten worst trading days for SPY since 1993, along with how close each day occurred to a day on the opposite list.
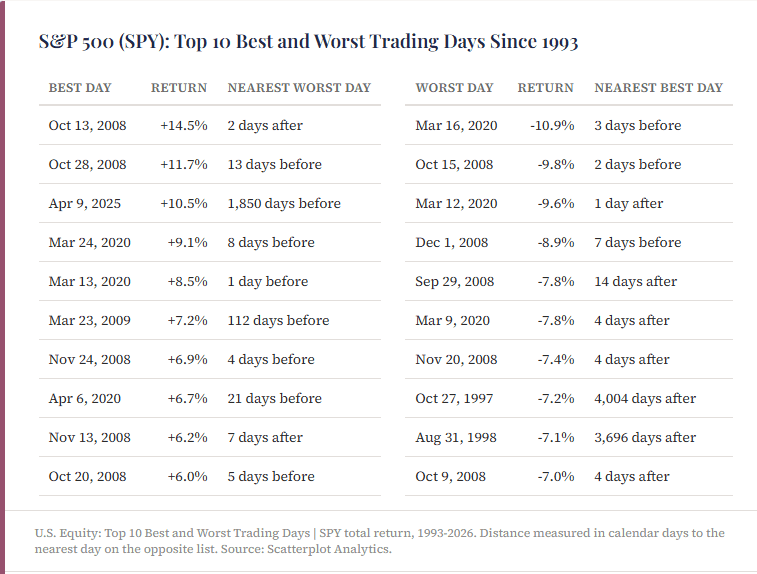
Most of these days cluster tightly. Seven of the ten best days occurred within 20 days of a day on the opposite list, as did eight of the ten worst days. Most of these days fall during periods of high volatility, such as the 2008 financial crisis and the 2020 selloff.
Conclusion
Market timing is hard. Even an investor who managed to avoid one of the market's worst days would, in most cases, have also missed one of its best days during the same stretch.
Frequently Asked Questions
Does missing the stock market's best days really matter?
Yes. Since 1993, missing just the single best trading day for SPY would have reduced the annualized return from 10.8% to 10.3%. Missing the 20 best days would have cut the annualized return to 6.2%.
Why do the market's best and worst trading days happen close together?
The data shows that the best and worst trading days tend to cluster in time. Since 1993, 70% of the ten best trading days for SPY occurred within 20 days of one of the ten worst trading days. Most of these days fall during periods of high volatility, such as the 2008 financial crisis and the 2020 selloff.
Is it possible to successfully time the market?
The data here does not address whether any particular timing strategy works. It shows that, historically, the days with the largest gains and the largest losses have tended to occur close together in time, which has made it difficult to capture one without also being exposed to the other.
Disclosure
This post is for informational and educational purposes only and should not be viewed as personalized investment advice. References to specific securities, including SPY, are provided to illustrate general market concepts and are not a recommendation or solicitation to purchase, sell, or hold any security or investment. All investments involve risk, including the loss of principal. Past performance is no guarantee of future results. Returns shown are based on historical SPY total return data from January 1993 through June 2026 and do not reflect any specific investment strategy, transaction costs, or taxes. Investment returns and principal value will fluctuate and are subject to market volatility. All opinions are subject to change without notice as market conditions change. Data contained herein is from third-party sources believed to be reliable, however its accuracy, completeness, or reliability cannot be guaranteed. Source: Scatterplot Analytics.


Enjoyed this? Get more in your inbox.
Weekly insights for advisors
— charts, research, and practical tools. No fluff.
Investment Foundations
Fed Rate Hikes Since 1994: What Happened in Each Cycle
Inflation, unemployment and equity returns across seven Fed rate-hike episodes since 1994, each with its start, end and accompanying FOMC statement.
Read moreSanjeev Pati, CFA
September 21, 2026 · 10 min read
Market Insights
September 2026 Market Update: Oil Up, Gold and Long-Term Treasuries Down Since the Iran Conflict
September 2026 market update: U.S. stocks sit 2.6% below their August high, and gold and long-term Treasuries are down since the Iran conflict. 10 charts.
Read moreSanjeev Pati, CFA
September 11, 2026 · 10 min read