
Emerging markets are up - is your index ETF keeping up? An IEMG vs VWO comparison.
IEMG (iShares' MSCI EM index ETF) and VWO (Vanguard's EM index ETF), with approximately $155 billion and $159 billion in assets respectively, are the two largest index ETFs representing the broad emerging market asset class. One key difference between the two has been contributing to a return deviation of over 17 percentage points over the past year.


Sanjeev Pati, CFA
Founder, Scatterplot
Key Takeaways
- IEMG (iShares' MSCI EM index ETF) and VWO (Vanguard's EM index ETF), with approximately $155 billion and $159 billion in assets respectively, are the two largest index ETFs representing the broad emerging market asset class in most index portfolios. IEMG is up +43% vs VWO's +26% over the past year.
- The key difference between the two is South Korea. MSCI classifies South Korea as an emerging market - giving it a ~20% weight in IEMG. FTSE classifies it as a developed market - giving it zero weight in VWO.
- South Korea, thanks to Samsung Electronics and SK Hynix and their central role in the AI infrastructure buildout, has been among the strongest performing countries in the emerging market universe. EWY (iShares MSCI South Korea ETF) is up over+200% over the past year.
- Mixing MSCI and FTSE products in the same portfolio - a common outcome of tax loss harvesting in robo-advisor and model portfolio strategies - can create unintended overweights or blind spots, leading to consequences that are difficult to see in a standard portfolio review.
Introduction
Having reviewed a broad range of portfolio constructions over the years, one consistent observation stood out for me: nearly every portfolio - active or passive - contains some combination of index funds. This is particularly true in the international equity sleeve, where individual security strategies such as direct indexing or tax-managed equity are largely US-based. For international exposure, index ETFs tend to be the default implementation.
In this blog we explore two topics:
- The two most popular emerging market index ETFs - IEMG and VWO - and how one key difference in their holdings is driving notable return deviation lately.
- Why mixing index providers in the same portfolio warrants careful consideration, particularly in tax loss harvesting strategies where MSCI and FTSE products can end up combined unintentionally. On the surface, or in broad portfolio reviews, the overall allocation may look similar - but a deeper look can reveal country exposure differences that are easy to overlook.
How have Emerging Market performed over the past year?
A chart widely referenced in discussions of international performance is the 1-year trailing performance of global equity markets:
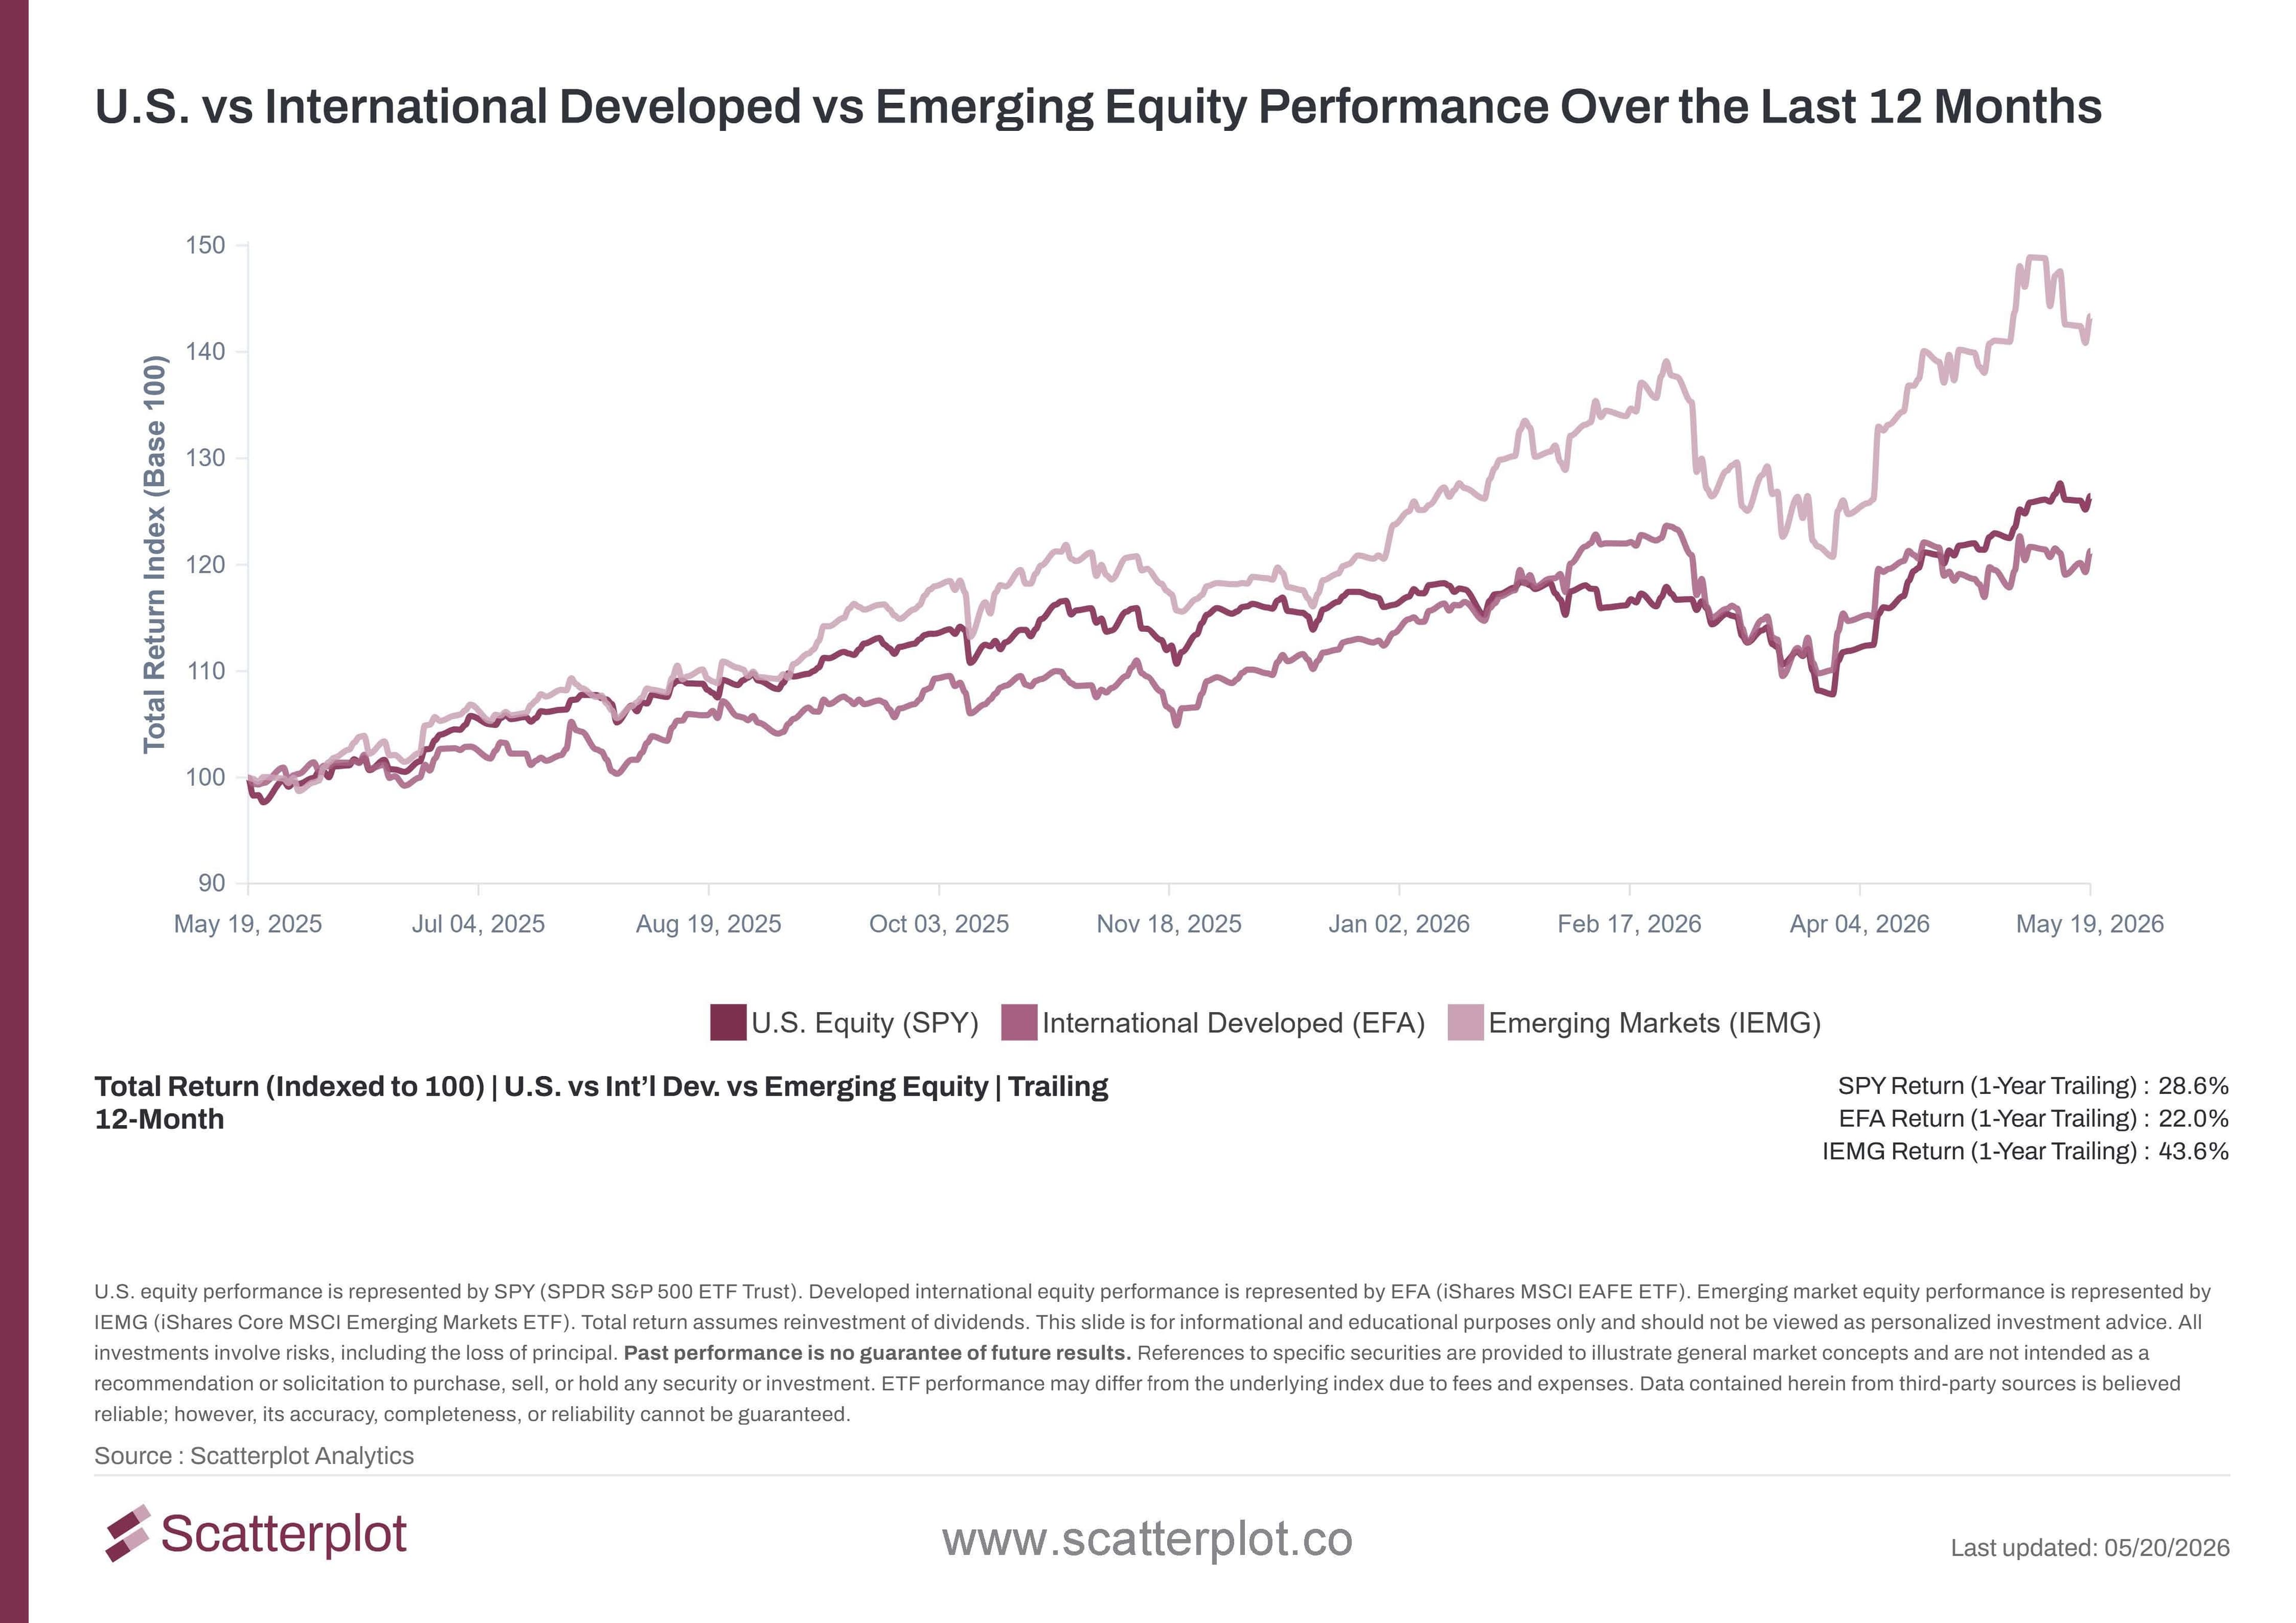
This chart updates daily. Track it live at scatterplot.co
As shown in the chart above, IEMG - which tracks the MSCI Emerging Markets Index - has been the standout performer over the past year, up +43% vs SPY's +28%. But not all emerging market index ETFs track the same index. An equally large segment of index-based portfolios follows the FTSE Emerging Markets Index instead, with VWO being the most widely used implementation. Here are the key differences between the two:

Values as of 05/20/2026
The key classification disagreement between the two index providers is the inclusion of South Korea - resulting in a 20 percentage-point difference in country exposure between the two funds, and has been a material contributor to almost a 9 percentage point return gap year-to-date and a 16 percentage point gap over the past year.
Since VWO and IEMG have similar AUM, it is worth noting that VWO is up +26% over the same period - roughly in line with US Equity and well behind IEMG's +43%.
How has South Korea performed as an Emerging Market?
This chart shows the 1-year trailing total return of the ten largest emerging market countries by weight in IEMG:
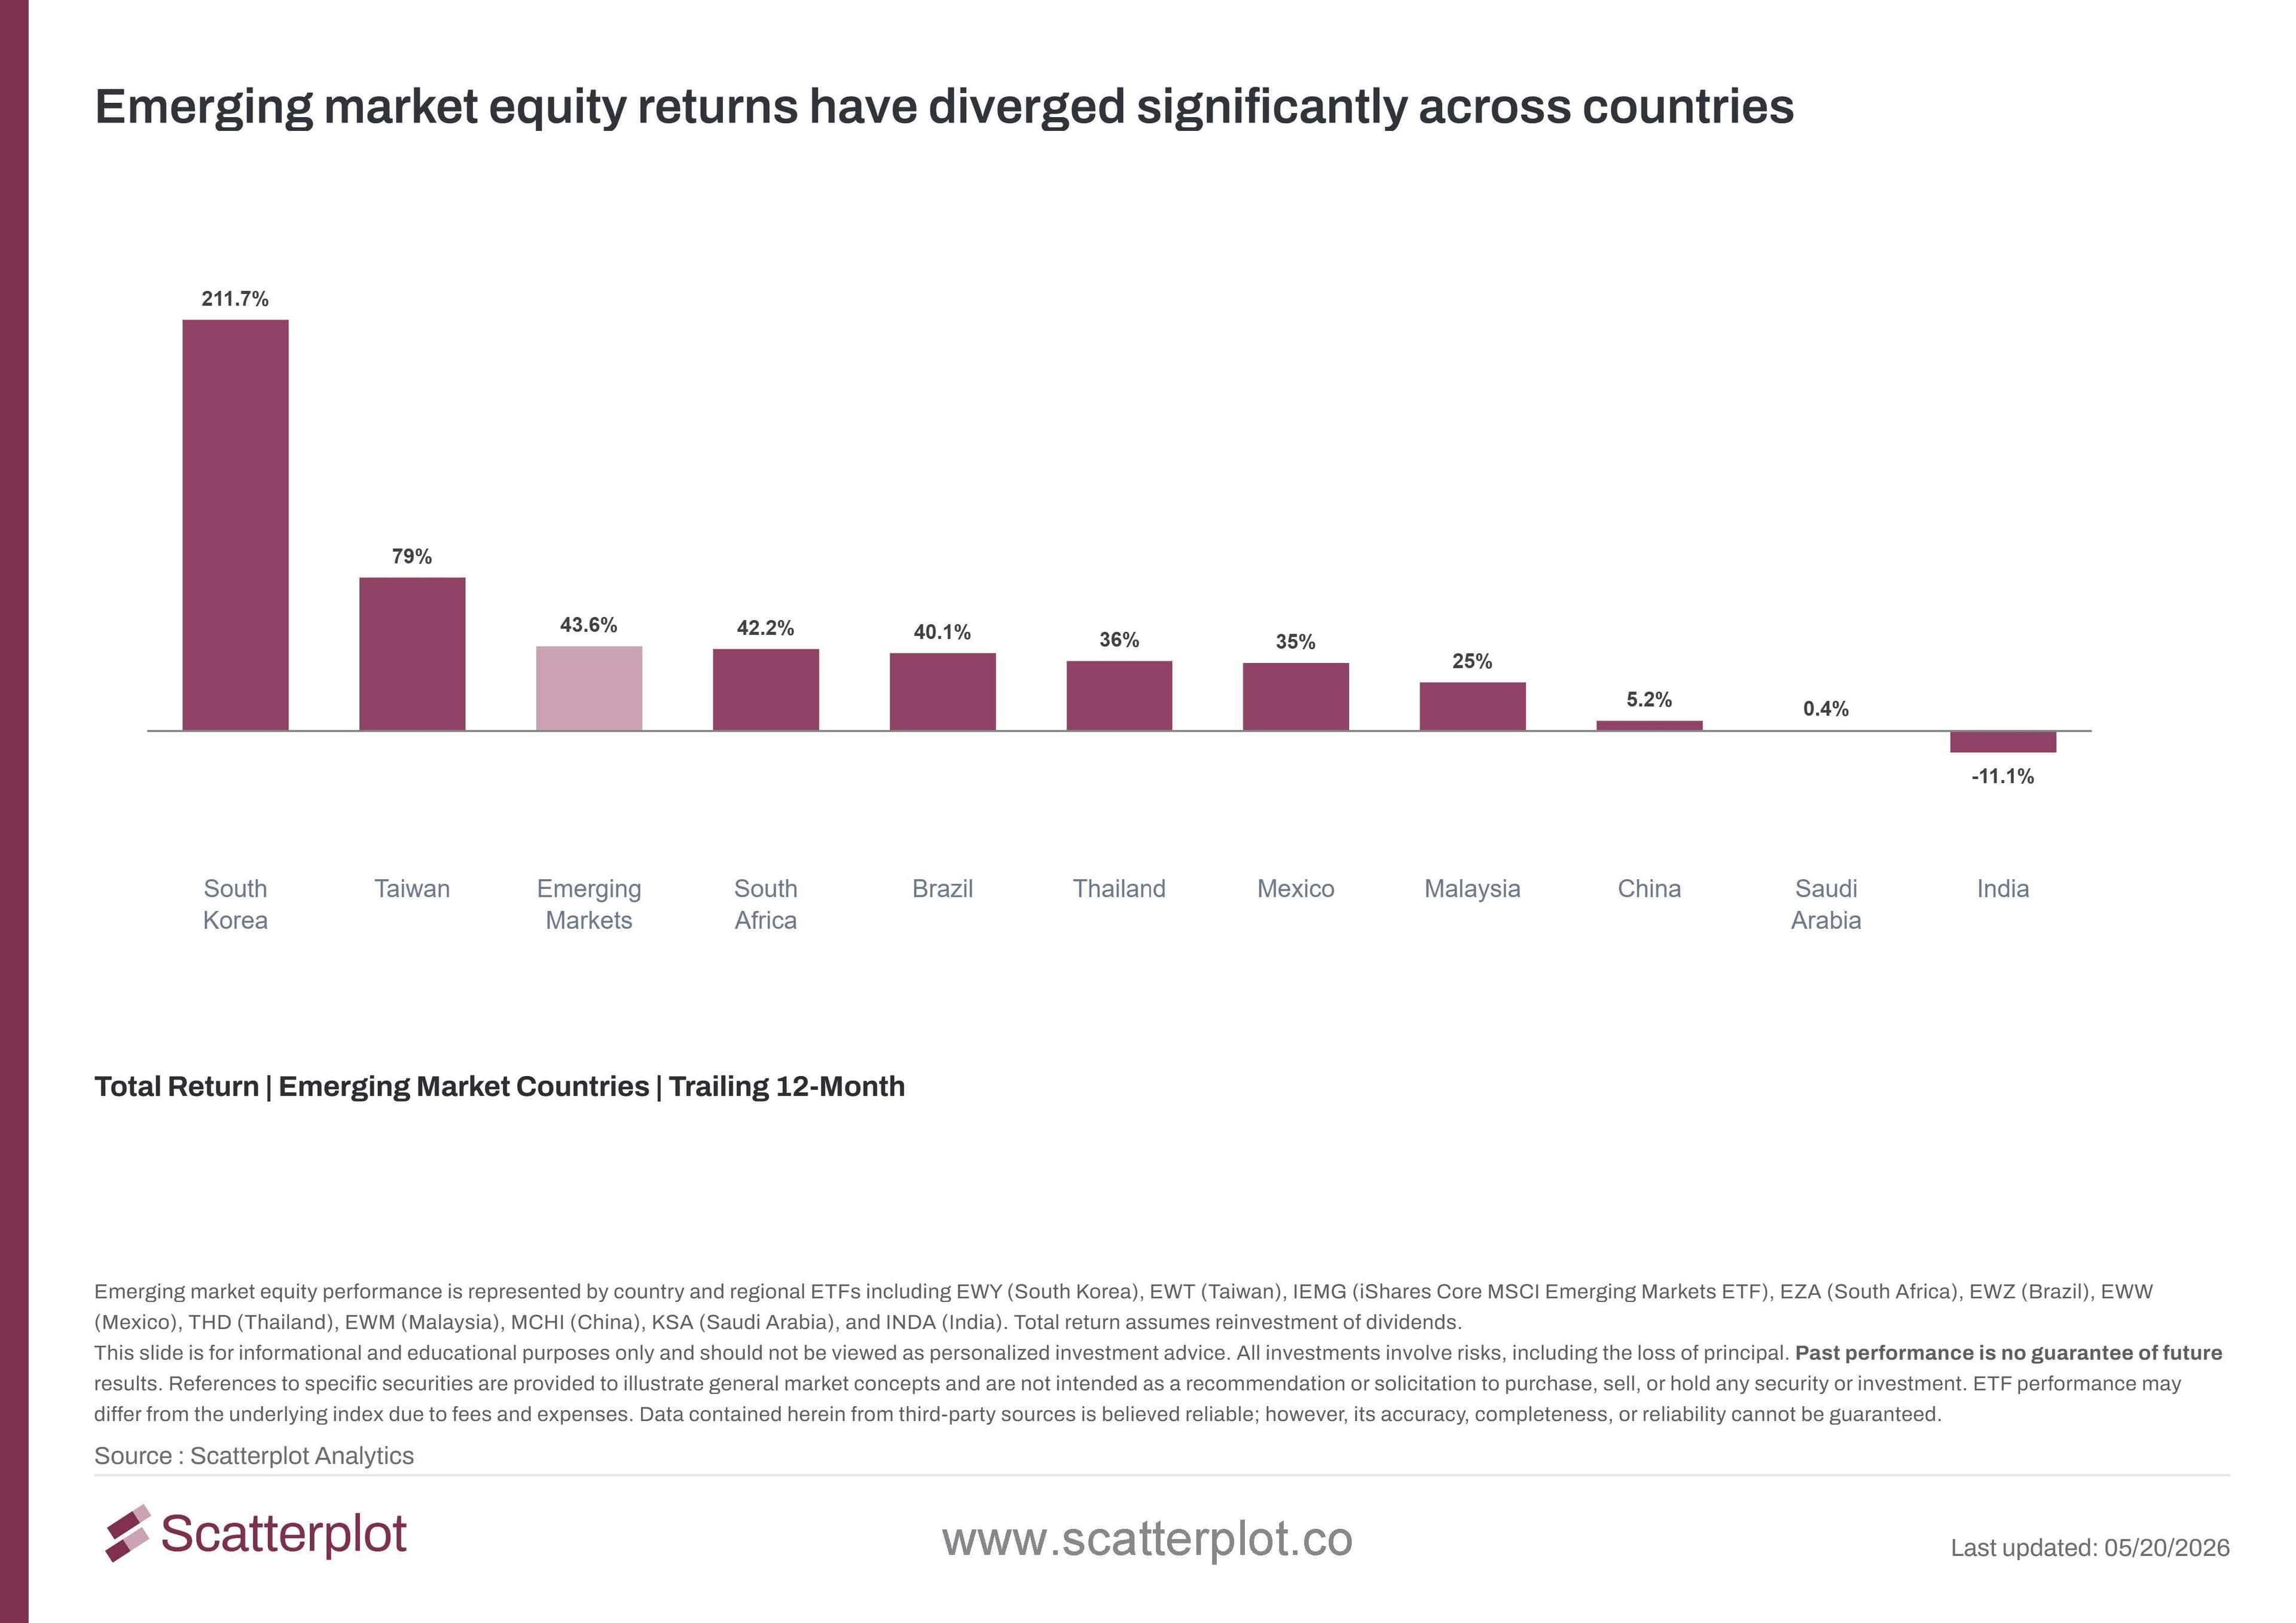
This chart updates daily. Track it live at scatterplot.co
South Korea is up over +200% over the past year in USD terms - the strongest performing major emerging market country by a significant margin. It has two significant names in the AI infrastructure trade:
- SK Hynix - a major manufacturer of High Bandwidth Memory (HBM). Its stock is up over +750% over the past year (local currency).
- Samsung Electronics - a major memory chipmaker. Its stock is up over +350% over the past year (local currency).
Much like a concentrated group of US tech stocks has been a primary driver of US Equity returns in recent years, these two names - together with TSMC (Taiwan Semiconductor, the world's largest contract chipmaker and IEMG's #1 holding) - have been meaningful contributors to EM index performance over the past year. VWO has no exposure to two of the three stocks that have been among the largest contributors to IEMG's return over the past year.
What happens when you mix MSCI and FTSE ETFs in the same portfolio?
Most asset allocation models use a combination of index ETFs to construct the overall equity portfolio - typically a developed markets ETF paired with an emerging markets ETF.
It is worth noting that VWO may not include South Korea in the EM sleeve, but if all ETFs in a portfolio are from the FTSE family, the developed markets ETF (VEA) would include South Korea as a developed market. In that case, Korea exposure is still present - it is simply classified differently. The issue arises when index providers are mixed across the two sleeves.
Mix and match of index ETFs happens frequently, driven by factors such as expense ratio considerations, platform availability, and tax loss harvesting. The hidden danger is that combining MSCI and FTSE products (or any other index providers) in the same portfolio can create unintended country over-weights or blind spots that are easy to miss in a standard portfolio review.
Concretely:
IEMG (MSCI EM) + VEA (FTSE Developed): Korea may appear in both sleeves - resulting in a higher combined weight than intended.
VWO (FTSE EM) + EFA (MSCI Developed): Korea may not appear in either sleeve - resulting in no exposure to the country across the international allocation.
The result of mixing is not neutral, and the numbers below show how meaningful the difference can be.
What the Numbers Show
The blend assumption below is 70% developed markets / 30% emerging markets - a typical advisor allocation. Over the past year, the difference between staying within one index family versus mixing has been meaningful:

Values as of 05/20/2026
A portfolio in the double-Korea mix (VEA + IEMG) returned 35.6% over the past year. A portfolio in the zero-Korea mix (EFA + VWO) returned 23.5%. That is a 12 percentage point gap over 12 months - driven largely by an unintended country bet from mixing index providers.
A general principle worth considering: selecting one index provider and staying consistent across the international portfolio - whether MSCI or FTSE - reduces the likelihood of unintended country exposures being introduced.
Conclusion
On the surface, IEMG and VWO are identical in purpose - both are broadly diversified index ETFs representing the emerging market asset class, and both serve the role they were designed to serve in a portfolio. But there is one key difference between them - South Korea - and that difference has been causing a material performance deviation that is worth understanding before making an allocation decision.
The broader lesson holds beyond Korea: when building an international portfolio from index products, selecting one index family and staying consistent reduces the likelihood of unintended country exposures. Over long periods, the performance differences between the two index families have historically been far smaller than the short-term deviations currently being observed. The unintended country exposures from mixing index providers, however, are worth evaluating carefully.
Frequently Asked Questions: IEMG vs VWO
Why does IEMG own South Korea but VWO doesn't?
MSCI classifies South Korea as an emerging market; FTSE classifies it as developed. Both are index providers - neither classification is objectively right or wrong. But the result is a 20 percentage-point difference in country exposure between two funds representing the same asset class, which has been causing notable performance deviation.
Is IEMG better than VWO right now?
In terms of structure, both ETFs do what they are designed to do - provide broad, diversified emerging market index exposure. The difference in South Korea has led to IEMG outperforming VWO lately. South Korea has been the best performing EM country over the past year, driven by Samsung Electronics and SK Hynix, both of which are central to the AI infrastructure buildout. Whether that continues will depend on how the AI investment cycle evolves and how those companies perform going forward.
What happens if I swap IEMG for VWO for tax loss harvesting?
The swap harvests the loss but also eliminates South Korea exposure and increases weights in China, Taiwan, and India. If EFA is used for developed markets, the result is zero Korea across the entire international allocation. If VEA is later swapped in for EFA, Korea is added back at the developed market level. These are real country allocation changes worth evaluating intentionally rather than as a secondary outcome of a tax loss harvesting decision.
Which EM ETF should a financial advisor recommend?
This blog is intended for educational purposes and does not constitute investment advice. Both IEMG and VWO are broadly used as core EM holdings in index portfolios. The key consideration explored in this blog is index provider consistency across the international allocation - whether MSCI or FTSE - to avoid unintended country exposures. The appropriate choice for any portfolio depends on individual circumstances and investment objectives.
With EM markets this volatile, how do I keep track?
The two charts in this blog are updated daily on our portal. We have many more charts exploring global equity performance available on Scatterplot. This analysis is for informational purposes only and is not investment advice.
Disclosure
This content is provided for informational and educational purposes only and should not be relied upon as investment advice. No representation is made that any investment strategy or market view will be successful. Past performance is not indicative of future results. All investing involves risk, including the loss of principal. Please refer to our Terms and Conditions for more information.


Enjoyed this? Get more in your inbox.
Weekly insights for advisors
— charts, research, and practical tools. No fluff.
Investment Foundations
Understanding Recency Bias: What U.S. Equity Returns Reveal About Investor Expectations
Exploring Recency Bias in Investors Using Recent and Long-Term U.S. Equity Data.
Read moreSanjeev Pati, CFA
July 6, 2026 · 4 min read
Investment Foundations
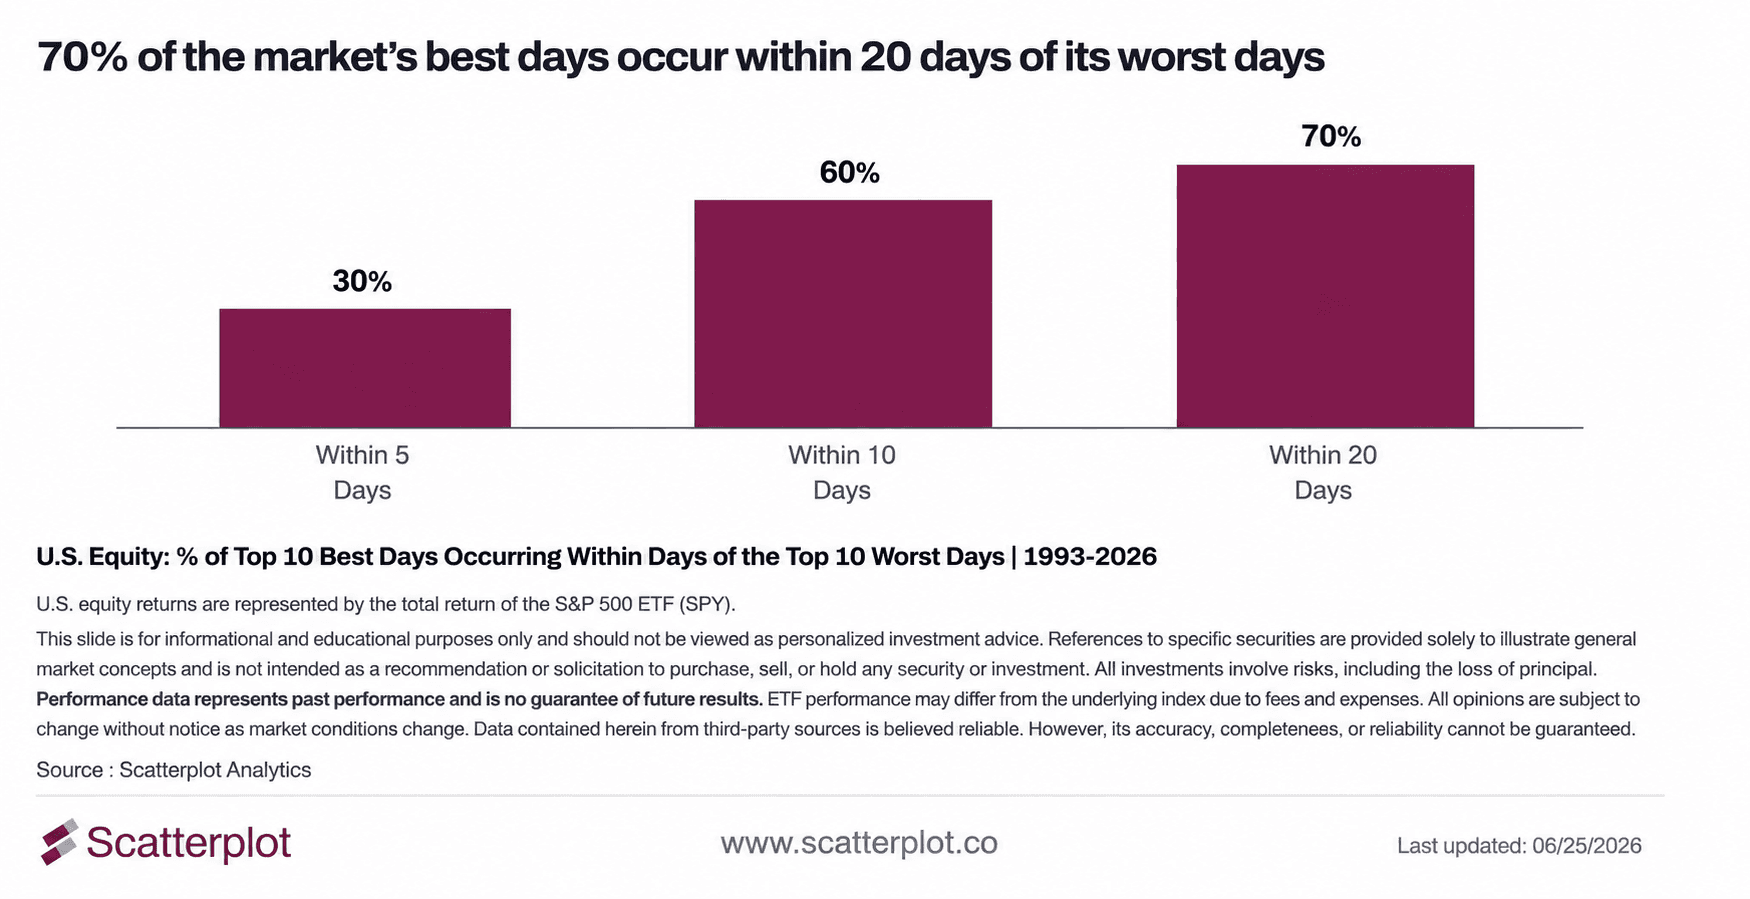
Why Market Timing Is So Hard: 70% of the best days in the market land near the worst ones
Market timing is hard. Since 1993, 70% of the S&P 500's ten best trading days occurred within 20 days of one of its ten worst trading days, making it difficult to capture one without being exposed to the other.
Read moreSanjeev Pati, CFA
June 26, 2026 · 5 min read