

Fed Rate Hikes Since 1994: What Happened in Each Cycle
Inflation, unemployment and equity returns across seven Fed rate-hike episodes since 1994, each with its start, end and accompanying FOMC statement.

Sanjeev Pati, CFA
Founder, Scatterplot
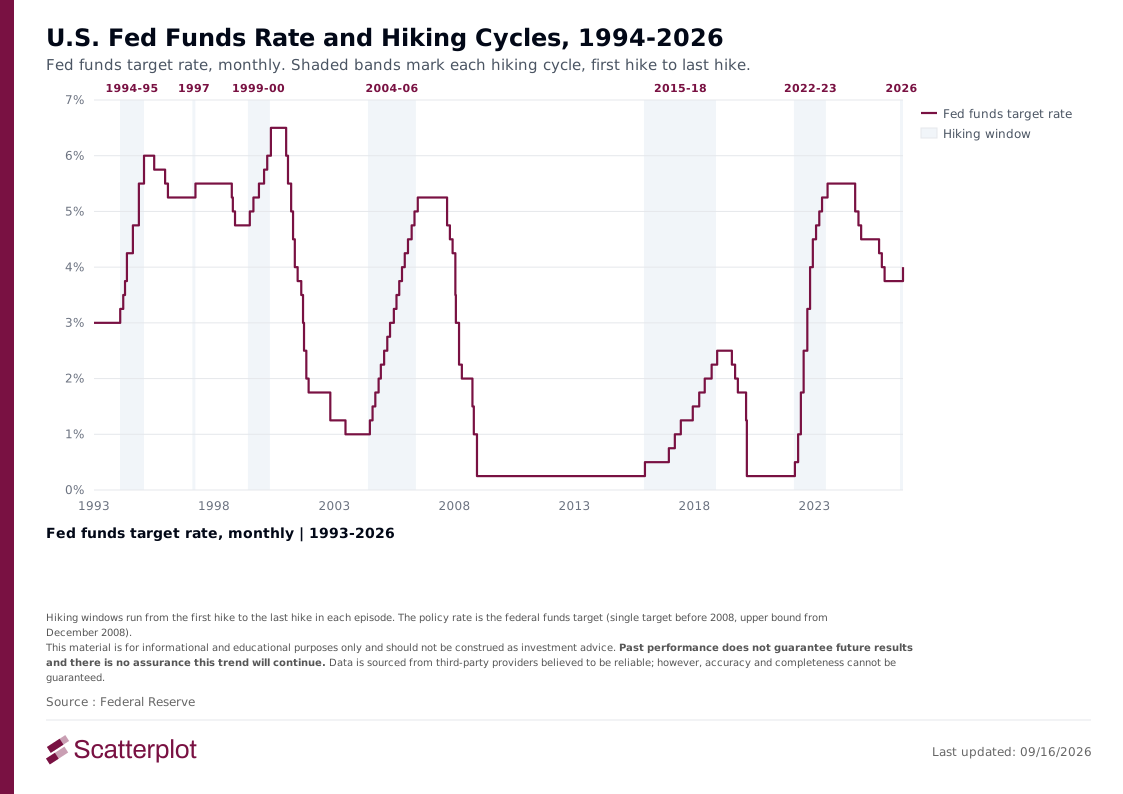
On September 16, 2026, the Federal Reserve raised its target rate for the first time since 2023. This post looks at the rate increases that came before it.
The Fed has raised its policy rate 52 times between February 4, 1994 and September 16, 2026. Those hikes fall into seven episodes, five of which involved more than a single move. This post looks at what inflation, unemployment and U.S. equities did during and after each of those five cycles.
Key findings
- Starting conditions varied widely. Inflation at the first hike ranged from 0.7% to 8.5%; unemployment from 3.7% to 6.6%.
- The statements accompanying the first hike differed substantially. The 2022 statement explicitly described inflation as elevated, while the other four emphasized different economic conditions and policy considerations.
- Headline CPI reached its highest reading within the first-to-last-hike window before the final hike in all five cycles, by between two and thirteen months.
- Unemployment was lower at the last hike than at the first in all five cycles. Its lowest reading came anywhere from three months before the last hike to eighteen months after it.
Each of these is set out with its underlying figures below, and the sources are listed at the end.
How the figures are constructed
Hike count. One hike per FOMC decision that raised the target, across 52 decision dates. Before December 2008 the target was a single rate; from December 2008 it is a range, counted when both bounds moved up. The series begins in February 1994, when the FOMC began announcing target changes.
Inflation. Headline Consumer Price Index, year over year. The Federal Reserve's 2% objective is defined on Personal Consumption Expenditures, not CPI; where the FOMC statements quoted below refer to that objective, they refer to PCE.
Unemployment. The U-3 rate.
Highs and lows. The highest CPI reading is the maximum monthly observation within the first-to-last-hike window, inclusive. The lowest unemployment reading is the minimum monthly observation from the first hike through twenty-four months after the last. Where a value recurs, the first occurrence is reported: CPI 2.9% in June and July 2018; unemployment 4.4% in October 2006, December 2006, March 2007 and May 2007, and 3.5% in September 2019 and February 2020.
Equity returns. SPY total return, dividends reinvested, from the close on the first-hike date to the close on the last-hike date.
The seven episodes
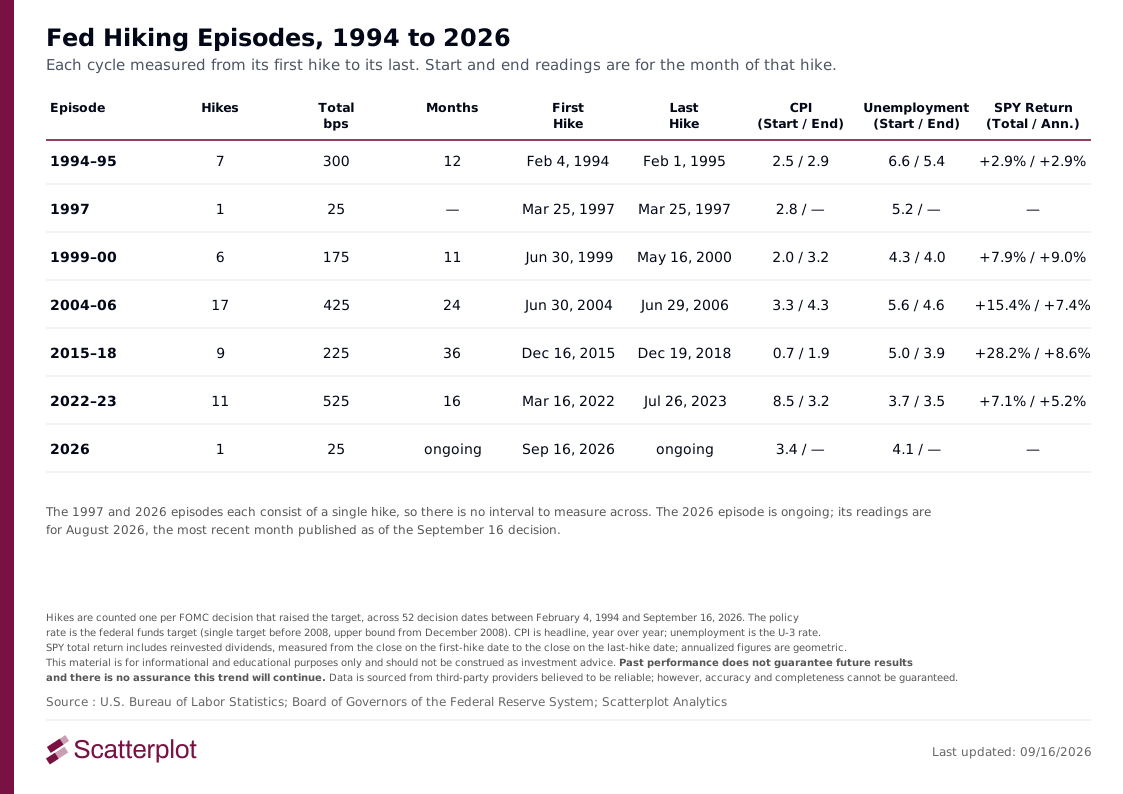
Each episode is measured from its first hike to its last. The CPI and unemployment columns each carry two readings:
- Start — the reading for the month of the episode's first hike.
- End — the reading for the month of the episode's last hike.
Length is given in months because the multi-hike cycles differ widely in duration, from 11 months to 36. SPY total return is shown both in full and annualized, since the two rank them differently.
The 1997 and 2026 episodes each consist of a single hike, so there is no interval to measure across and neither has a section of its own below. The 2026 episode is ongoing; its readings are for August 2026, the most recent month published as of the September 16 decision. The five multi-hike cycles are described individually in the sections that follow.
On transmission lags
Policy is understood to affect output, inflation and employment with a delay, and unemployment is formally classified as a lagging indicator. How long that delay runs is not settled:
- Output — 3 to 18 months. Romer and Romer find output starts falling about three months after a policy shock and troughs at eighteen.[1]
- Disaggregated prices — 29 to 43 months. Work on disaggregated price indices finds an average lag of twenty-nine months, with headline PCE turning significantly negative only after forty-three.[2]
- Core inflation — shorter since 2009. The Kansas City Fed finds the peak response of core PCE inflation came after more than twelve quarters pre-2009 and roughly four quarters after. For unemployment, the confidence intervals overlap: no significant evidence the timing changed.[3]
- Faster in principle. Governor Waller has argued that forward guidance and immediate market repricing compress transmission relative to older estimates.[4]
These studies measure different outcomes using different methods, so their estimates are not directly comparable to one another. What they share is substantial uncertainty: effects have been found emerging anywhere from a few months to several years after a policy change, depending on which outcome is measured and how. The sections below report what inflation and unemployment did in each cycle, relative to that cycle's last hike, without asserting what caused those movements.
1994–95: seven hikes, 300 basis points
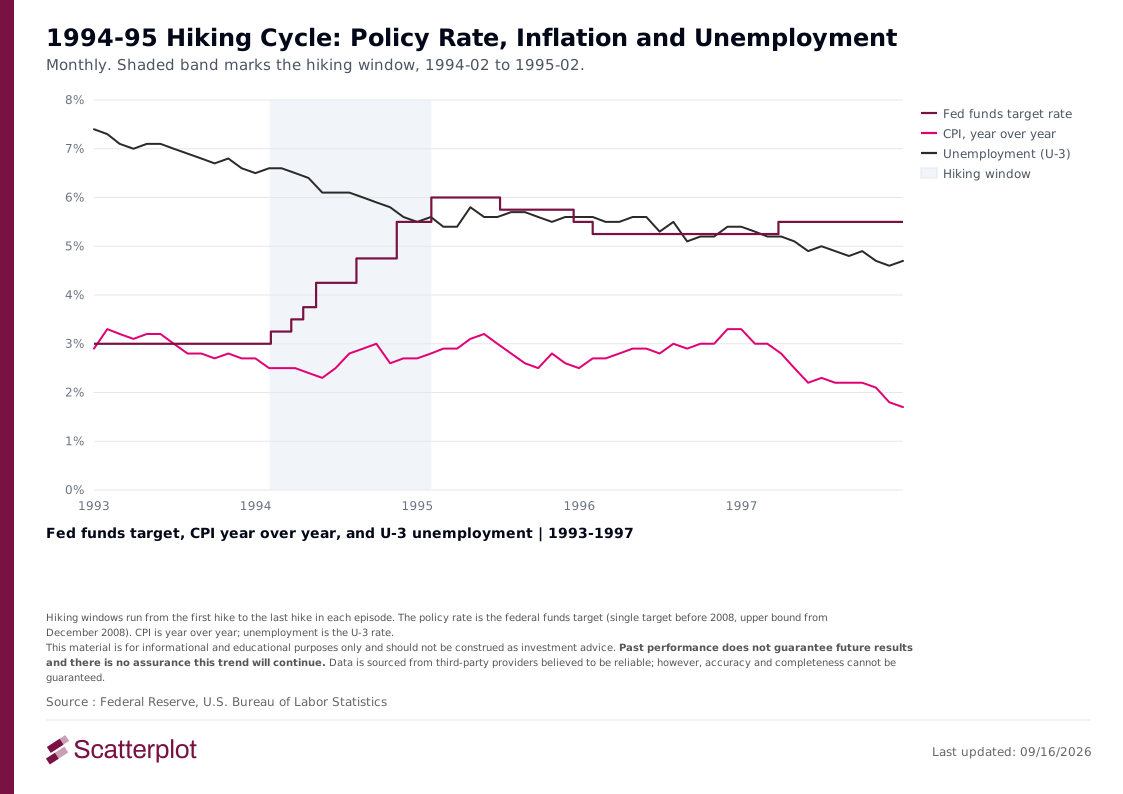
The FOMC's February 4, 1994 announcement was the first time the Committee publicly announced a target change. The announcement itself made no mention of inflation, though that does not establish what role inflation played in the Committee's deliberations.
Why the hike. The Committee stated that "the decision was taken to move toward a less accommodative stance in monetary policy in order to sustain and enhance the economic expansion."[5]
What happened next.
- CPI — the highest reading within the hiking window was 3.0% in September 1994, five months before the last hike. CPI continued rising after the cycle ended, reaching 3.3% in November 1996, twenty-one months after the last hike.
- Unemployment — continued falling after the cycle ended, reaching 5.1% in August 1996, eighteen months after the last hike.
- Within 24 months of the last hike, unemployment did not return to its February 1994 level of 6.6%.
1999–2000: six hikes, 175 basis points
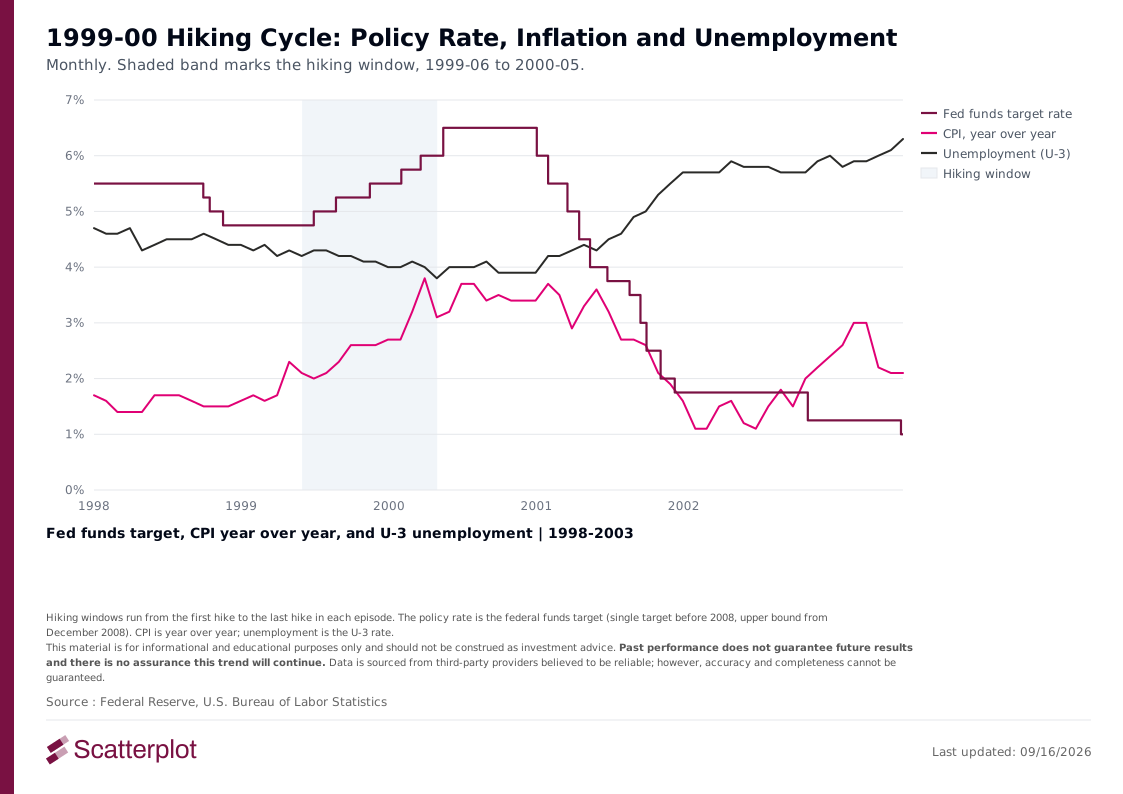
The Committee described this cycle as the withdrawal of accommodation extended during the 1998 financial market disruption.
Why the hike. The June 30, 1999 statement noted that "last fall the Committee reduced interest rates to counter a significant seizing-up of financial markets in the United States," that "much of the financial strain has eased," and that "the full degree of adjustment is judged no longer necessary." On inflation, it said that "labor markets have continued to tighten over recent quarters, but strengthening productivity growth has contained inflationary pressures."[6]
What happened next.
- CPI — reached 3.8% in March 2000, two months before the last hike.
- Unemployment — reached 3.8% in April 2000, one month before the last hike, then rose to 5.9% in April 2002, twenty-three months after the last hike.
2004–06: seventeen hikes, 425 basis points
The longest sequence of consecutive moves in the period: seventeen quarter-point hikes across two years.
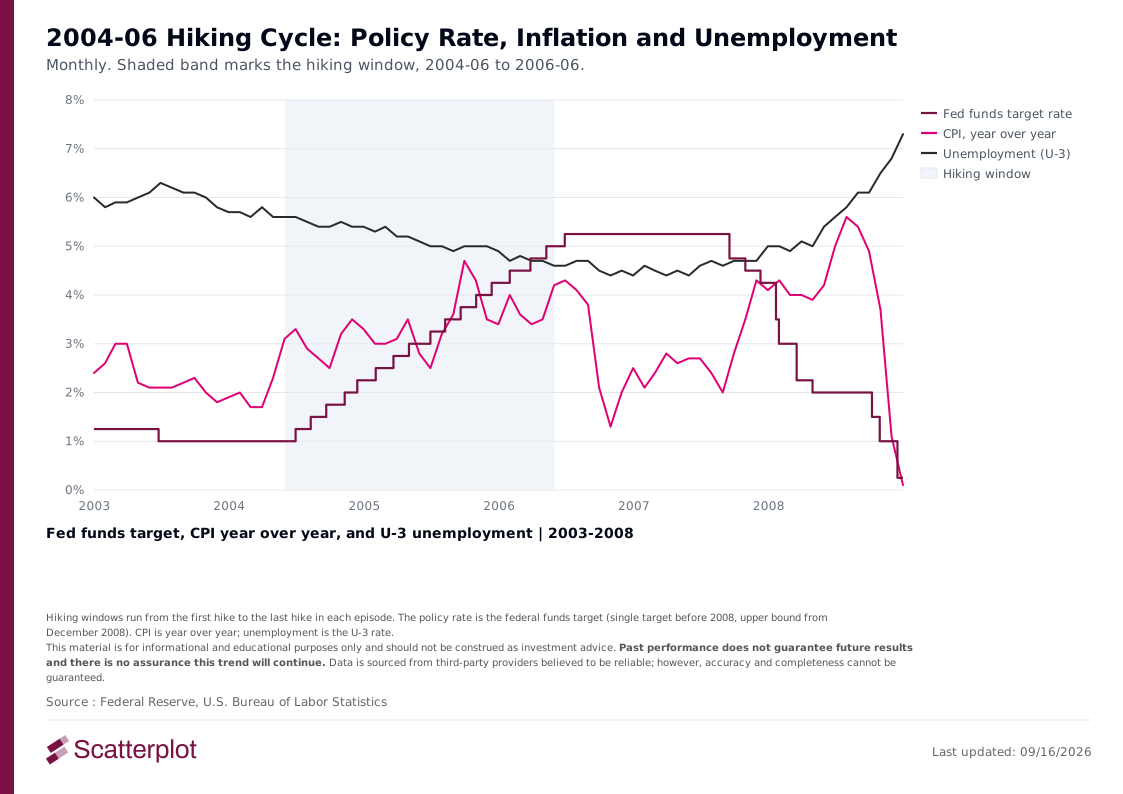
Why the hike. The June 30, 2004 statement said "output is continuing to expand at a solid pace" and "labor market conditions have improved." On inflation it said that "incoming inflation data are somewhat elevated, a portion of the increase in recent months appears to have been due to transitory factors," and that "policy accommodation can be removed at a pace that is likely to be measured."[7]
What happened next.
- CPI — the highest reading within the hiking window was 4.7% in September 2005, nine months before the last hike. CPI was 2.7% in June 2007 and 5.0% in June 2008, twenty-four months after the last hike.
- Unemployment — reached 4.4% in October 2006, four months after the last hike.
- Within 24 months of the last hike, unemployment did not exceed its June 2004 level of 5.6%.
2015–18: nine hikes, 225 basis points
This cycle began with inflation at 0.7%, the lowest starting reading of the five.
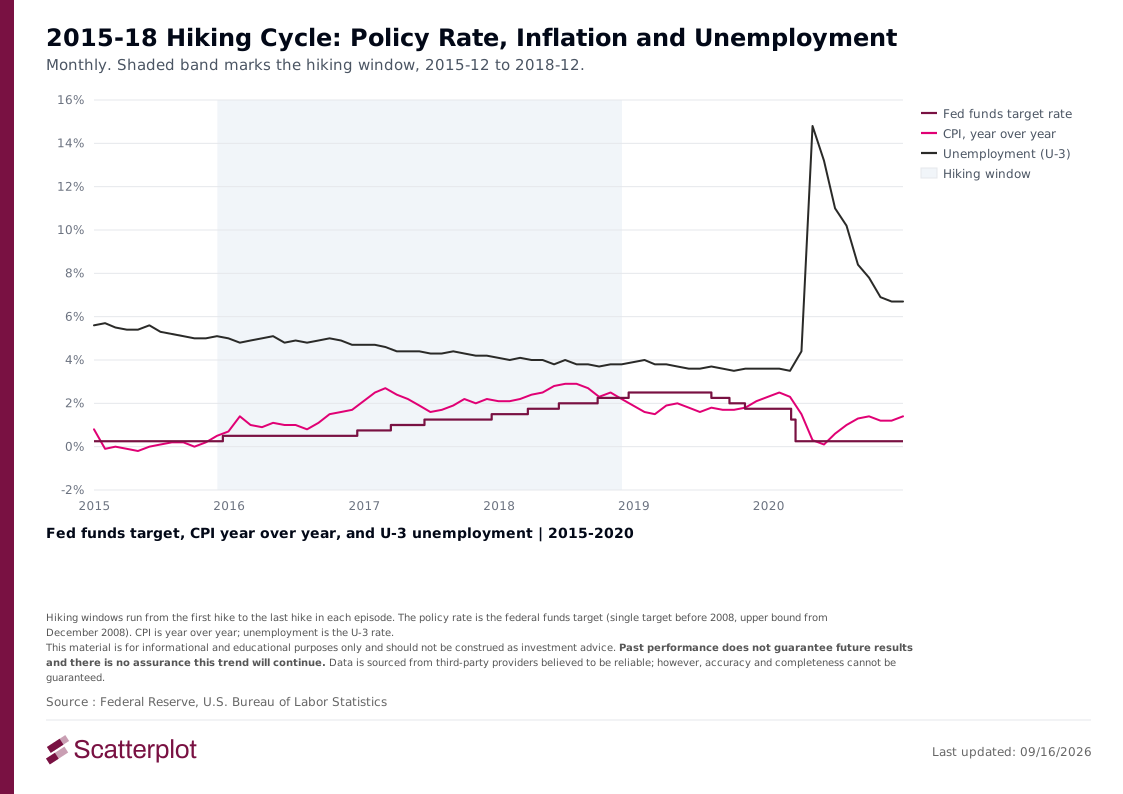
Why the hike. The December 16, 2015 statement said the Committee "judges that there has been considerable improvement in labor market conditions this year" and that "it is reasonably confident that inflation will rise, over the medium term, to its 2 percent objective." It added that "recognizing the time it takes for policy actions to affect future economic outcomes, the Committee decided to raise the target range."[8]
What happened next.
- CPI — reached 2.9% in June 2018, six months before the last hike.
- Unemployment — continued falling after the cycle ended, reaching 3.5% in September 2019, nine months after the last hike.
2022–23: eleven hikes, 525 basis points
The largest cumulative increase of the five cycles, and the only one that began with inflation above 4%.
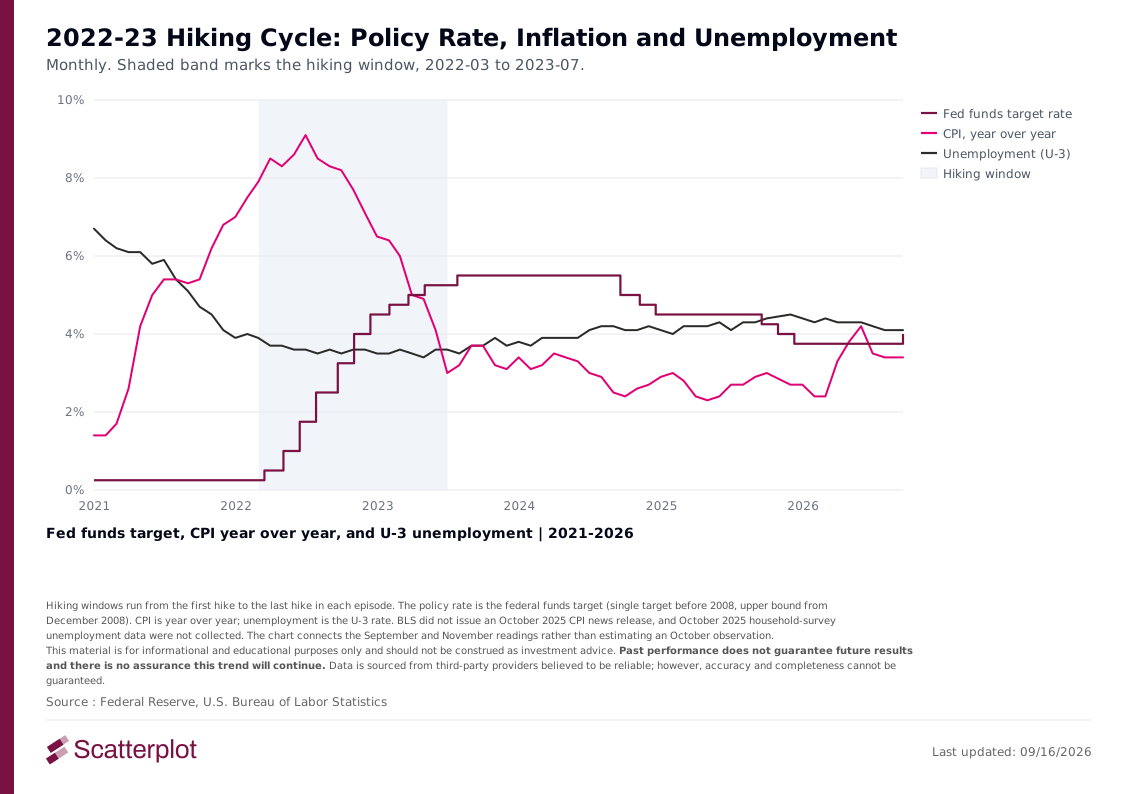
Why the hike. The March 16, 2022 statement said "inflation remains elevated, reflecting supply and demand imbalances related to the pandemic, higher energy prices, and broader price pressures," and that "job gains have been strong in recent months, and the unemployment rate has declined substantially."[9]
What happened next.
- CPI peak — 9.1% in June 2022, three months after the first hike and thirteen months before the last hike. The upper bound of the target range was 1.75% at that reading.
- CPI after the peak — 3.0% in June 2023, 3.7% in August 2023, 3.7% in September 2023, and 2.9% in December 2024.
- Unemployment — reached 3.4% in April 2023, three months before the last hike, and was 4.3% in May 2025, twenty-two months after the last hike.
Conclusion
Across these five cycles the data does not describe a single repeated sequence. Starting conditions ranged from 0.7% to 8.5% inflation and 3.7% to 6.6% unemployment, and the accompanying FOMC statements differed in every case.
Two of the five post-cycle windows overlap major economic shocks — the COVID-19 pandemic and the global financial crisis — which further complicates comparison across cycles.
This analysis is descriptive: it records when these series moved relative to the hiking cycles, not why. Readers looking for a consistent pattern in inflation or unemployment around the end of a hiking cycle will not find one in this data.
References
[1] Romer, C. D. and Romer, D. H. (2004), "A New Measure of Monetary Shocks: Derivation and Implications," American Economic Review 94(4). https://www.aeaweb.org/articles?id=10.1257/0002828042002651
[2] "The Long and Variable Lags of Monetary Policy: Evidence from Disaggregated Price Indices," NBER Working Paper 32623. https://www.nber.org/system/files/working_papers/w32623/w32623.pdf
[3] "Have Lags in Monetary Policy Transmission Shortened?" Federal Reserve Bank of Kansas City, Economic Bulletin. https://www.kansascityfed.org/research/economic-bulletin/have-lags-in-monetary-policy-transmission-shortened/
[4] Waller, C. J. (2023), "Why Policy Lags May Be Shorter Than You Think," Board of Governors of the Federal Reserve System. https://www.federalreserve.gov/newsevents/speech/files/waller20230713a.pdf
[5] FOMC announcement, February 4, 1994. https://www.federalreserve.gov/fomc/19940204default.htm
[6] FOMC press release, June 30, 1999. https://www.federalreserve.gov/boarddocs/press/general/1999/19990630/
[7] FOMC press release, June 30, 2004. https://www.federalreserve.gov/boarddocs/press/monetary/2004/20040630/
[8] FOMC press release, December 16, 2015. https://www.federalreserve.gov/newsevents/pressreleases/monetary20151216a.htm
[9] FOMC press release, March 16, 2022. https://www.federalreserve.gov/newsevents/pressreleases/monetary20220316a.htm
[10] "2025 Federal Government Shutdown Impact on Consumer Expenditure Surveys (CE) and Consumer Price Index (CPI)," U.S. Bureau of Labor Statistics. https://www.bls.gov/cpi/additional-resources/2025-federal-government-shutdown-impact-cpi.htm
Disclosures
This material is for informational purposes only and is not investment advice, a recommendation, or an offer to buy or sell any security. Specific securities and indices are referenced for illustration only and should not be considered recommendations.
Past performance is not a guarantee of future results. SPY returns shown are historical returns of the ETF and do not represent the performance of any client account or investment strategy offered by Scatterplot. SPY total return figures include reinvested dividends and are gross of any advisory fees, which would reduce returns; ETFs bear their own internal expenses.
Inflation is headline Consumer Price Index, year over year. Unemployment is the U-3 rate. Macroeconomic figures are stated for the month of the FOMC meeting referenced and were not published as of the meeting date; economic data is subject to revision. Asset classes and economic series shown are not directly comparable.
Data sources. The Consumer Price Index and the U-3 unemployment rate are published by the U.S. Bureau of Labor Statistics. The federal funds target rate is set by the Federal Open Market Committee and published by the Board of Governors of the Federal Reserve System. Equity figures are calculated from SPY daily closing prices adjusted for reinvested dividends.
October 2025. October 2025 data were disrupted by the federal government shutdown. The Bureau of Labor Statistics did not issue an October 2025 Consumer Price Index news release, and October household-survey unemployment data were not collected. The charts therefore do not estimate an October observation and connect the available September and November readings.[10]
Statements attributed to the Federal Open Market Committee are quoted from the Committee's published statements on the dates given.


Enjoyed this? Get more in your inbox.
Weekly insights for advisors
— charts, research, and practical tools. No fluff.
Market Insights
September 2026 Market Update: Oil Up, Gold and Long-Term Treasuries Down Since the Iran Conflict
September 2026 market update: U.S. stocks sit 2.6% below their August high, and gold and long-term Treasuries are down since the Iran conflict. 10 charts.
Read moreSanjeev Pati, CFA
September 11, 2026 · 10 min read
Market Insights
US Housing Market: Resale Is Frozen, New Construction Is Not
Where every US housing indicator stands : September 2026
Read moreSanjeev Pati, CFA
September 4, 2026 · 10 min read