

September 2026 Market Update: Oil Up, Gold and Long-Term Treasuries Down Since the Iran Conflict
September 2026 market update: U.S. stocks sit 2.6% below their August high, and gold and long-term Treasuries are down since the Iran conflict. 10 charts.

Sanjeev Pati, CFA
Founder, Scatterplot
In this September 2026 market update, U.S. stocks are 2.58% below their last all-time high, set on 13 August 2026, and up 11.7% for the year through 10 September.
Since the Iran conflict began on 28 February, oil is up 43%, while gold and long-term Treasuries have fallen. Value stocks have outperformed growth stocks at every company size. Software stocks and private credit stocks both fell sharply early in the year. Software has since recovered most of that decline, while private credit has not.
Key takeaways
Global markets
- −2.58%: U.S. equities below their 13 August 2026 all-time high
- +11.7%: U.S. equities year to date, behind world ex-U.S. (+15.4%) and emerging markets (+22.3%)
- +43% / −17.6% / −8.7%: Oil, gold and long-term Treasuries since 28 February 2026
- 4.9% vs 4.3%: The 10-year Treasury yield today and three years ago
U.S. stocks
- +47.2% / +29.0%: Energy and technology, the two best-performing sectors year to date
- 2 of 7: Magnificent Seven stocks ahead of the U.S. equity market year to date
- 21.3% vs 2.7%: Large-cap value versus large-cap growth year to date
Software and private credit
- −4.2%: Software stocks year to date, after a 31.6% rise from their 23 February low
- −11.9%: An index of publicly traded private credit firms, year to date
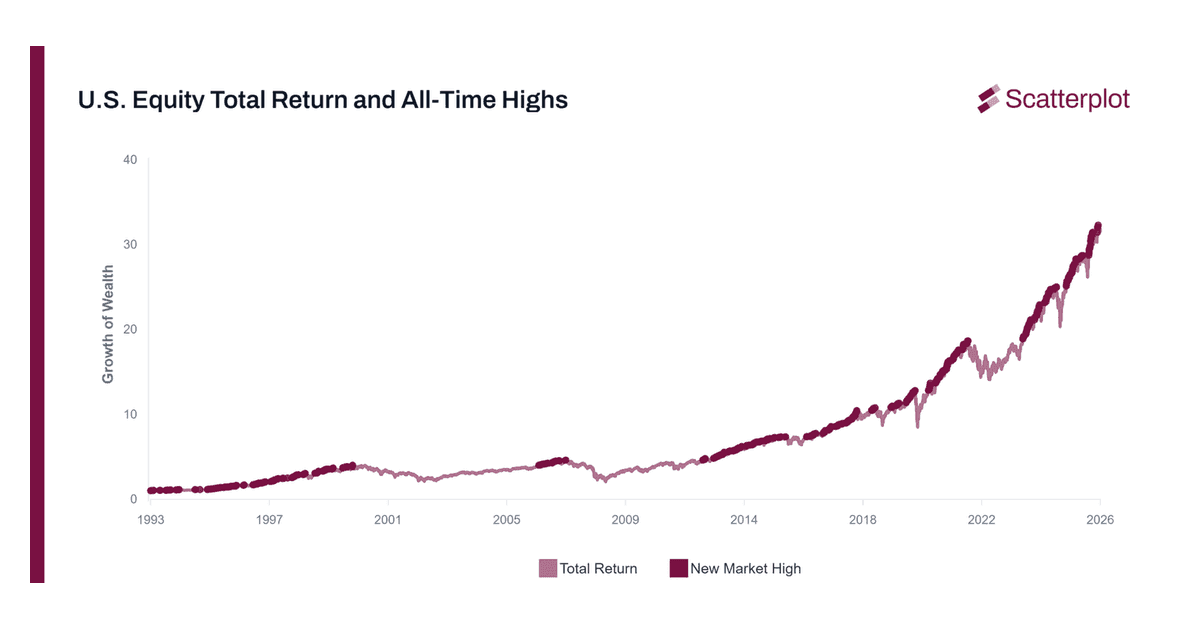
U.S. stocks are 2.58% below their August all-time high
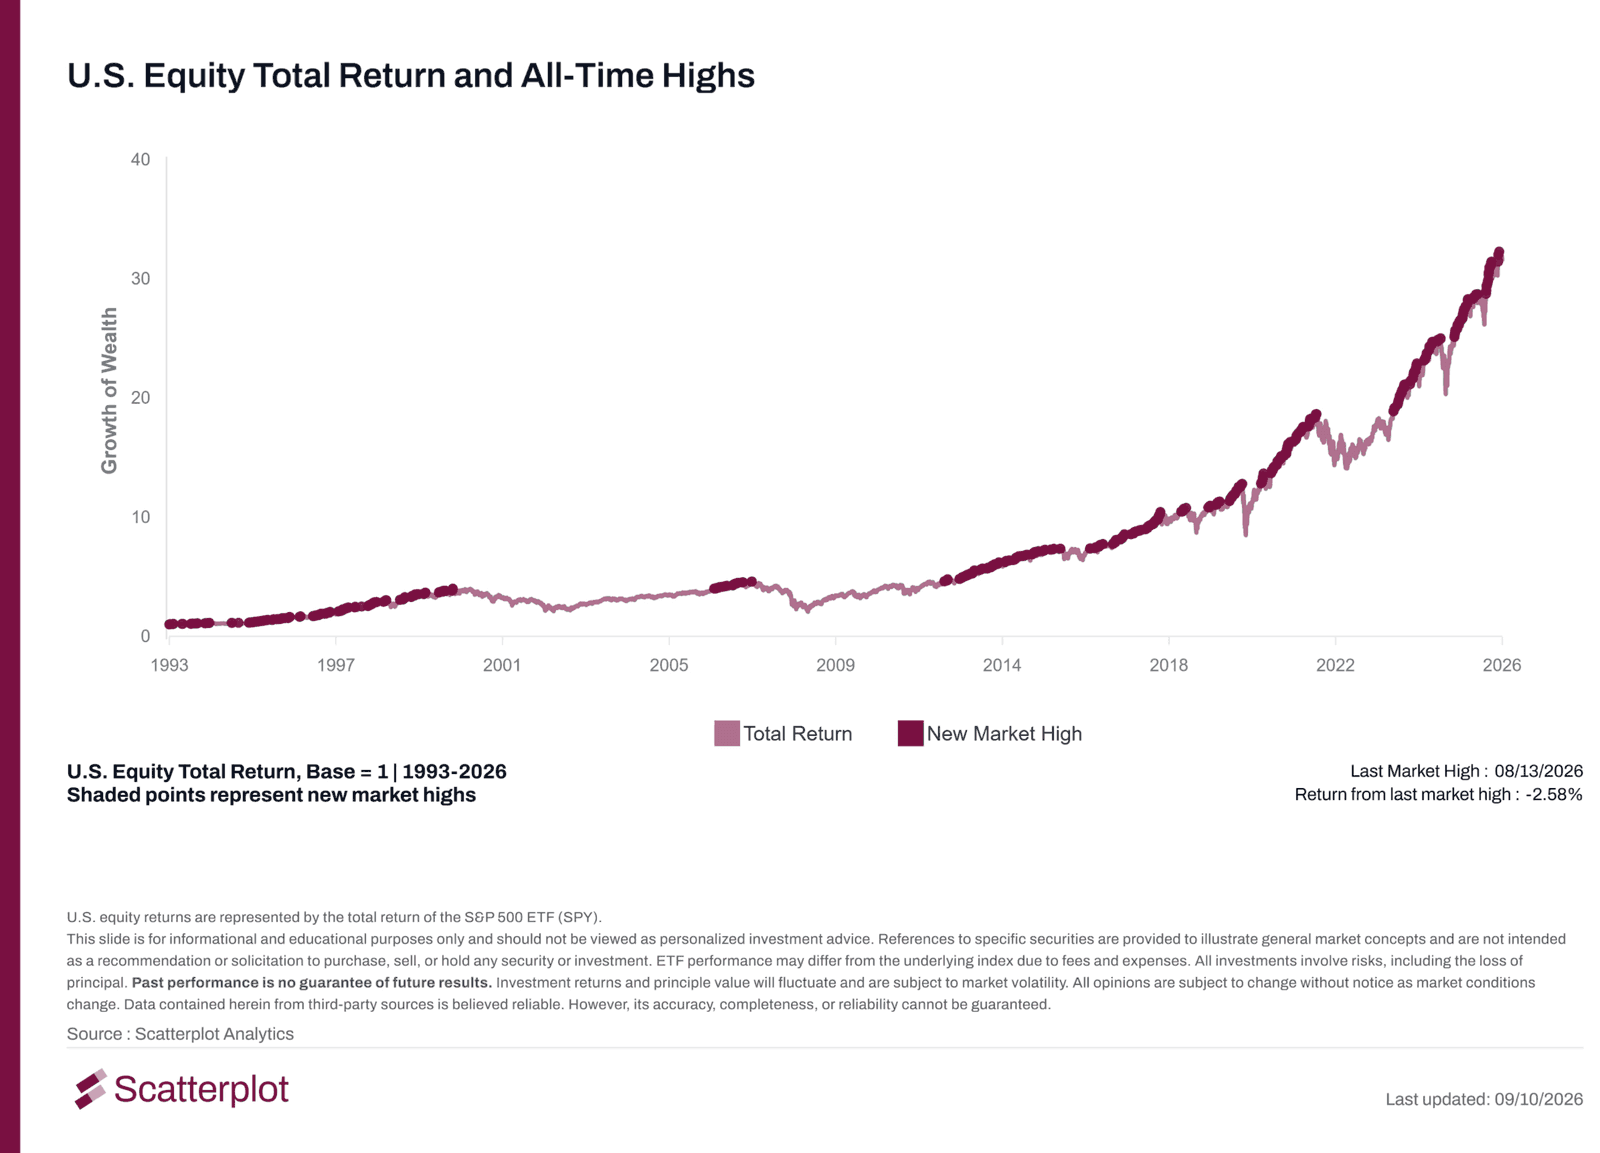
U.S. equities last closed at an all-time high on 13 August 2026. As of 10 September they were 2.58% below that level, on a total return basis.
This chart updates daily. Track it live at scatterplot.co.
The chart tracks U.S. equity total return since 1993, and the darker points mark each new all-time high. New highs have often come in clusters. There have also been long stretches without any, including the years after 2000 and after 2007.
How global stock markets have performed in 2026
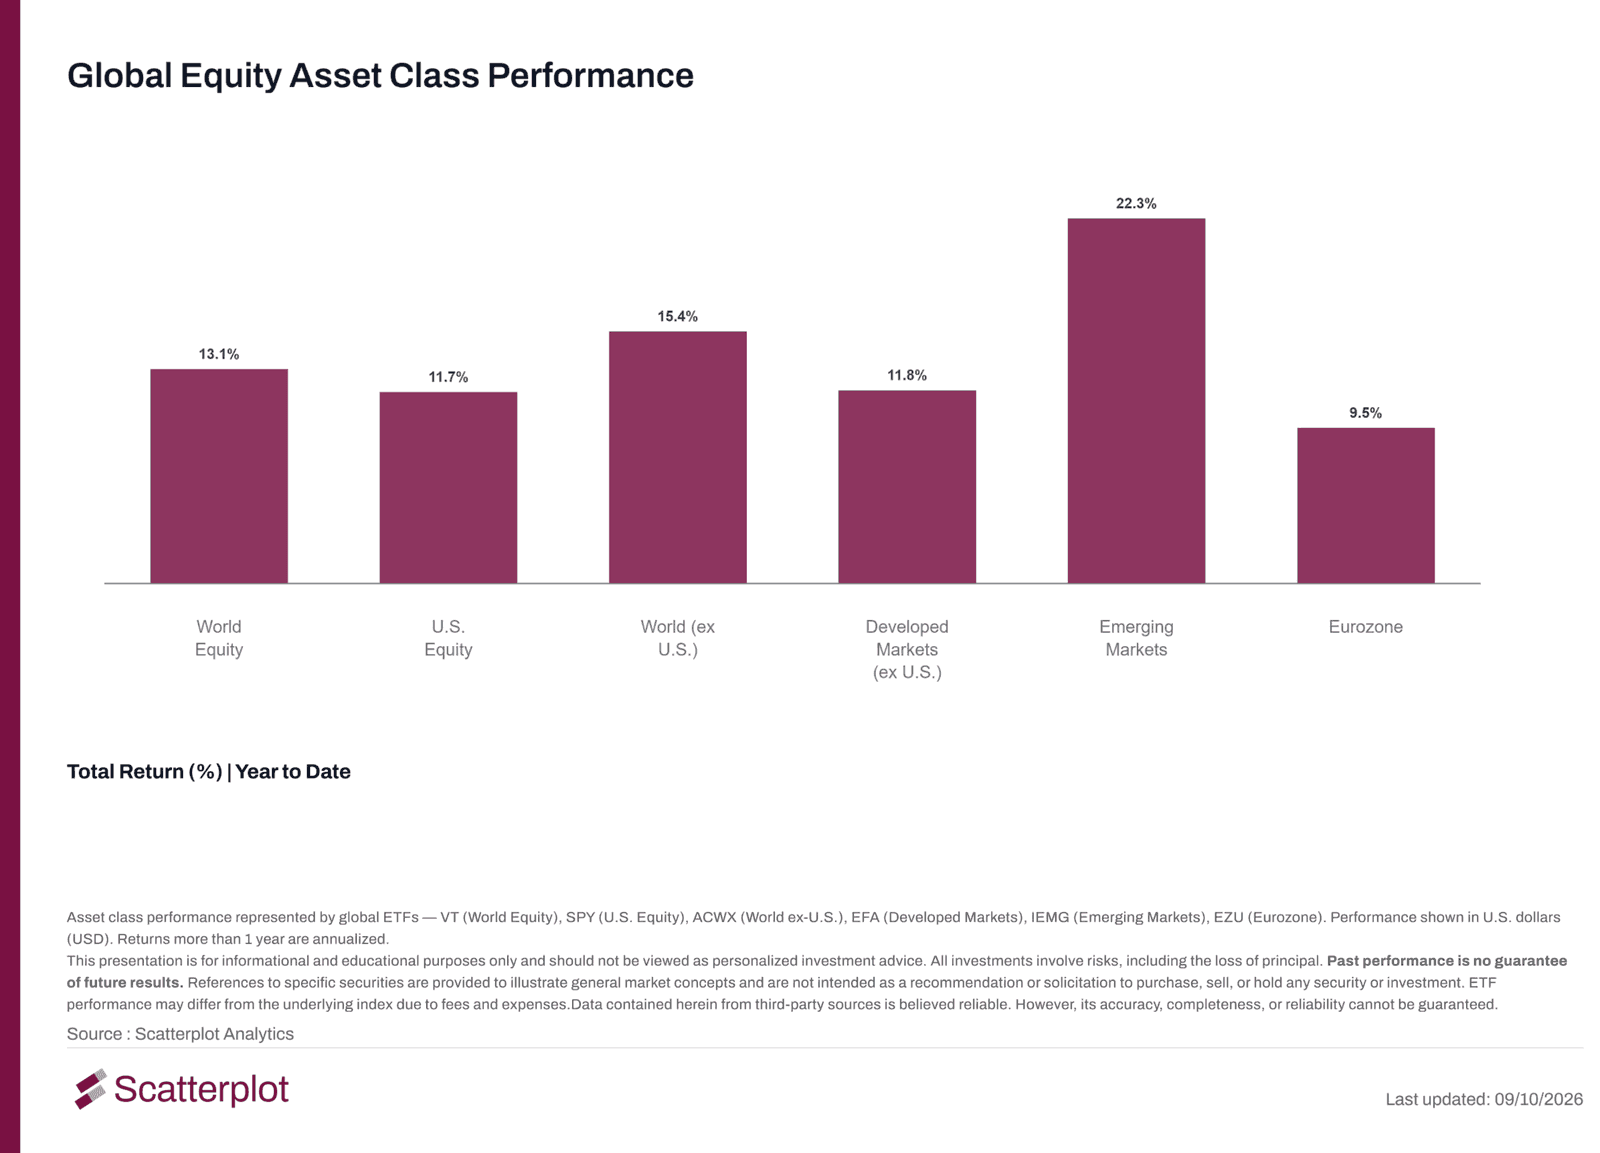
U.S. equities have returned 11.7% year to date. Of the six regions shown, only the Eurozone has returned less. Emerging markets lead at 22.3%, followed by world equities excluding the U.S. at 15.4%, world equities at 13.1% and developed markets excluding the U.S. at 11.8%. The Eurozone has returned 9.5%.
This chart updates daily. Track it live at scatterplot.co.
Since the Iran conflict began, oil has risen while gold and long-term Treasuries have fallen
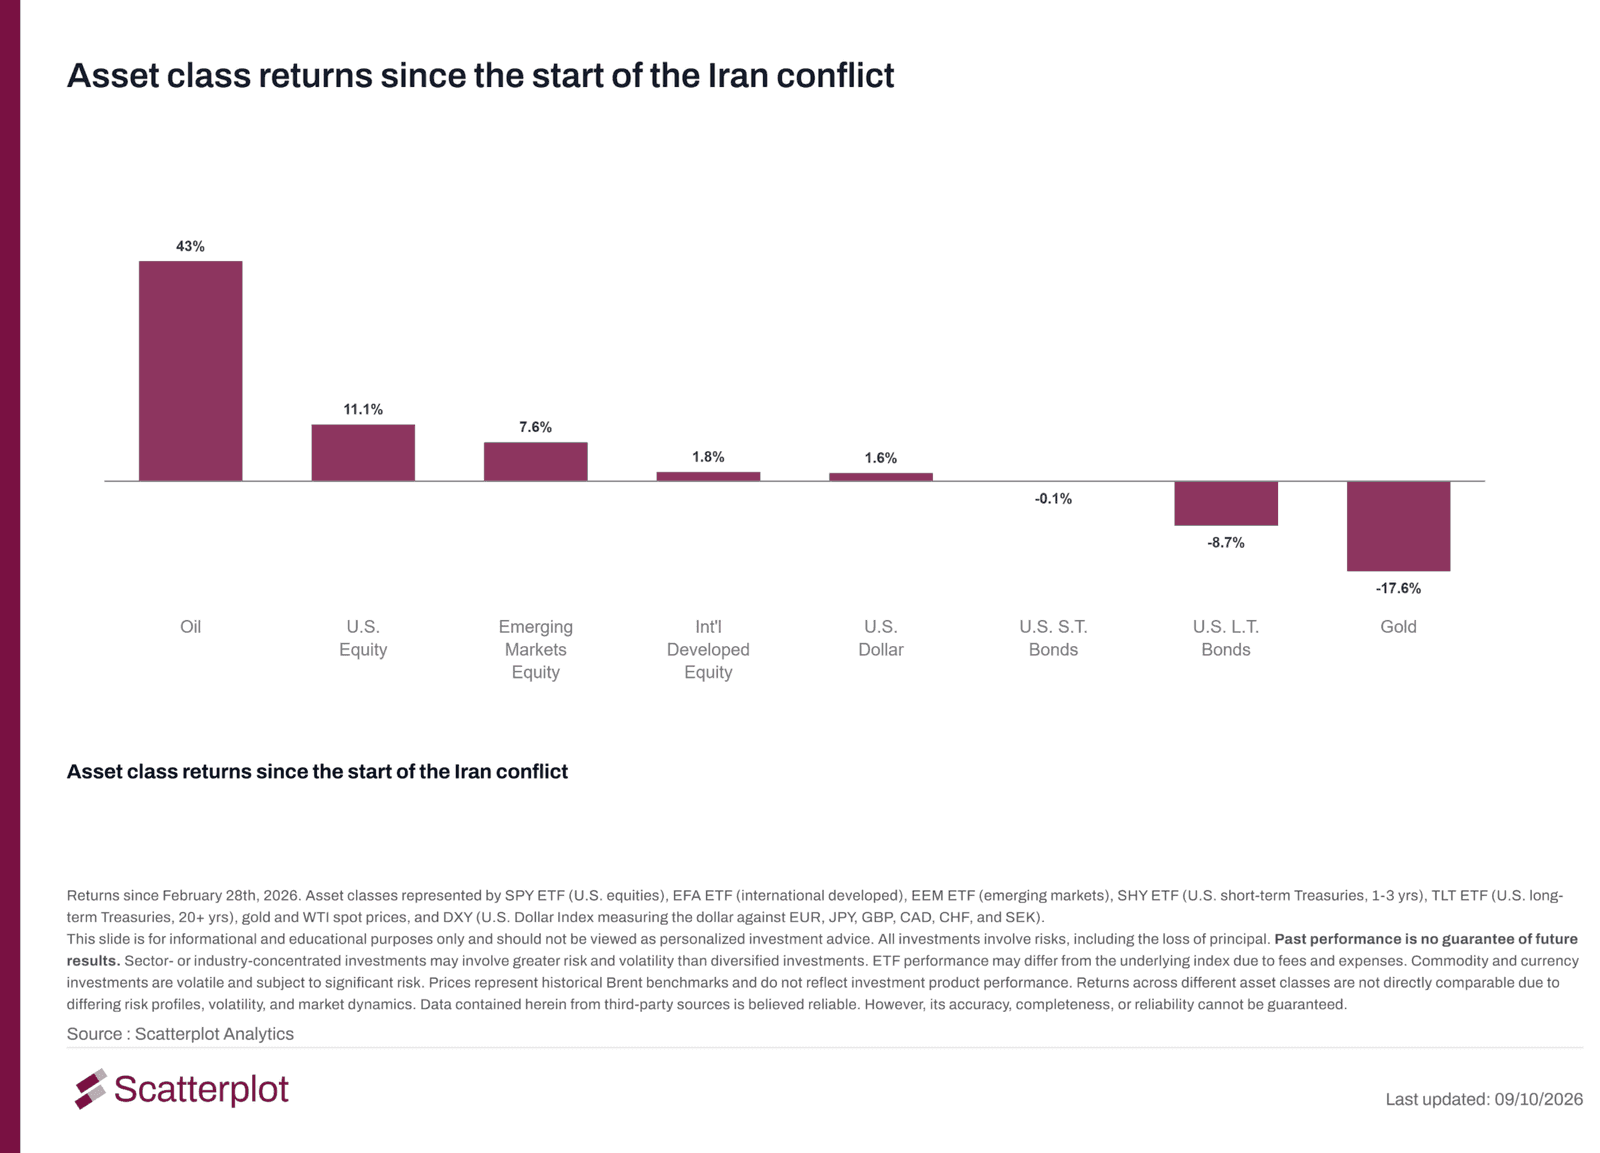
Since 28 February 2026, oil is up 43% and U.S. equities 11.1%. Emerging markets equities are up 7.6%, international developed equities 1.8% and the U.S. dollar 1.6%. Short-term Treasuries are down 0.1%, long-term Treasuries are down 8.7%, and gold is down 17.6%.
This chart updates daily. Track it live at scatterplot.co.
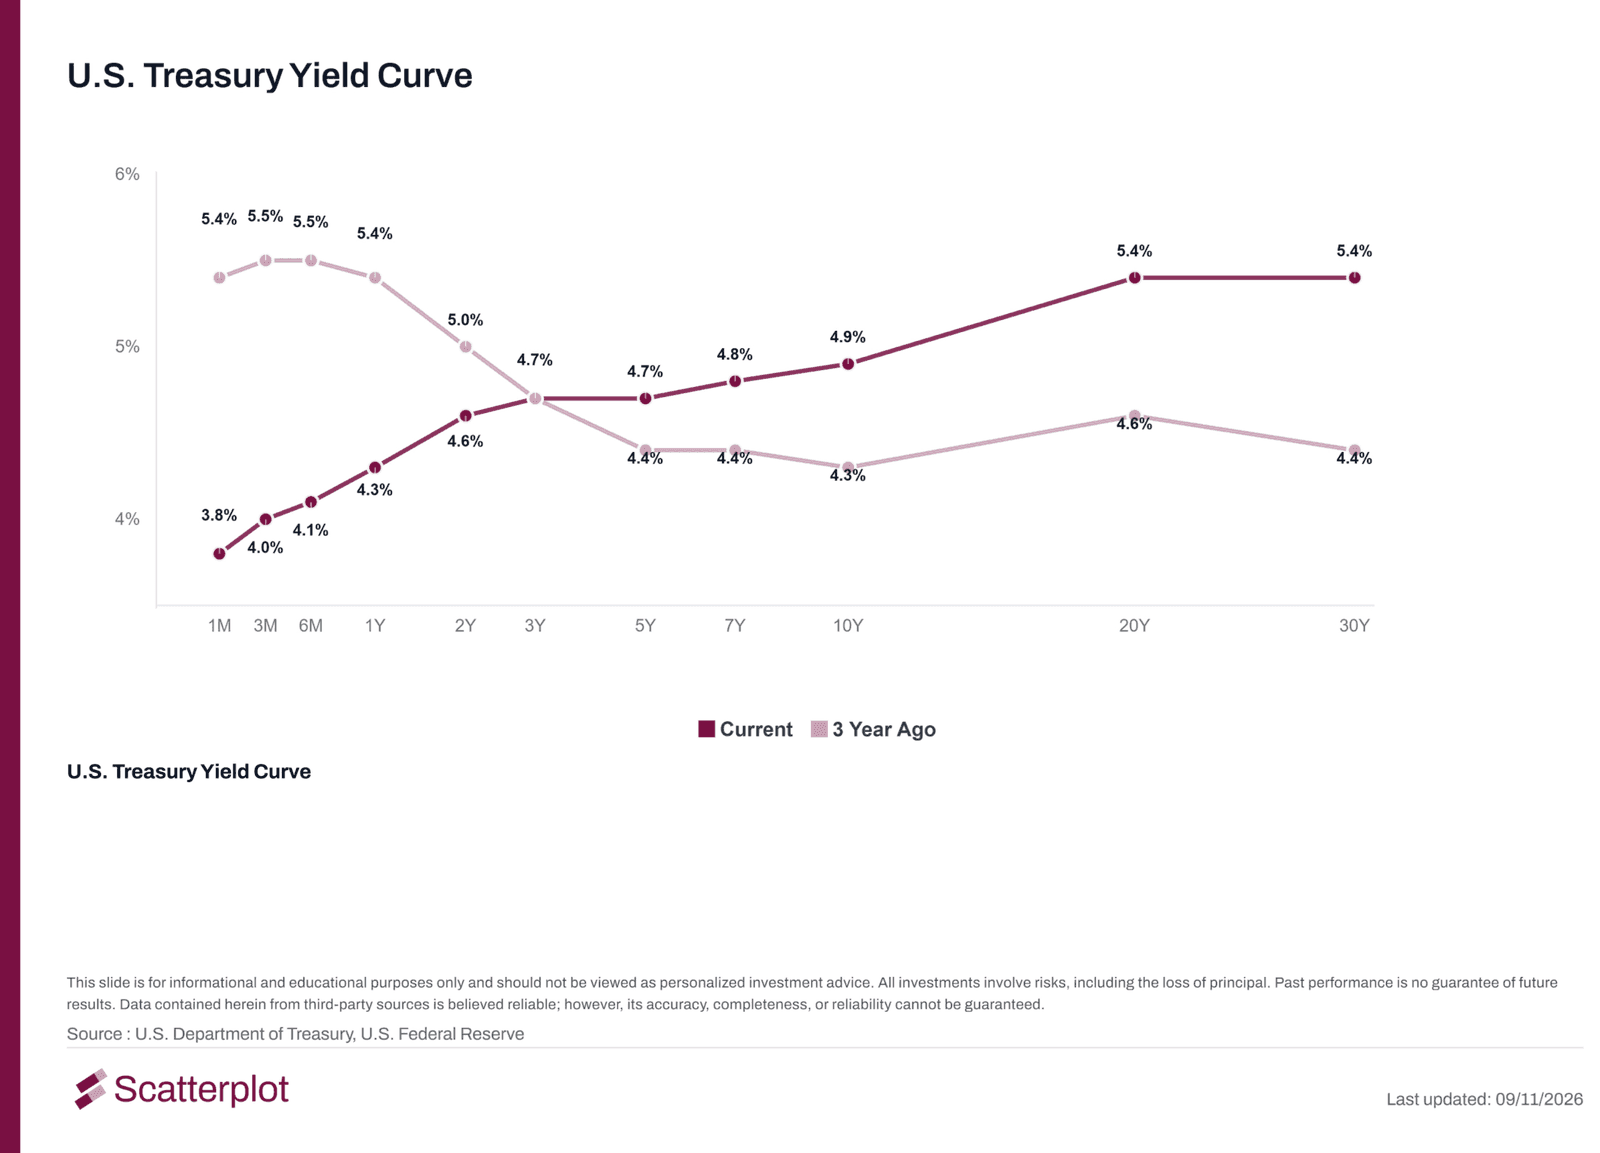
The U.S. Treasury yield curve has shifted from inverted to upward-sloping
A yield curve shows Treasury yields from the shortest maturities to the longest. Three years ago the U.S. curve was inverted. Today it slopes upward.
This chart updates daily. Track it live at scatterplot.co.
Short-term yields have fallen and long-term yields have risen. The 3-month yield has fallen from 5.5% to 4.0% and the 2-year from 5.0% to 4.6%, while the 10-year has risen from 4.3% to 4.9% and the 30-year from 4.4% to 5.4%. (For more on Treasury yields, see our fixed income piece.)
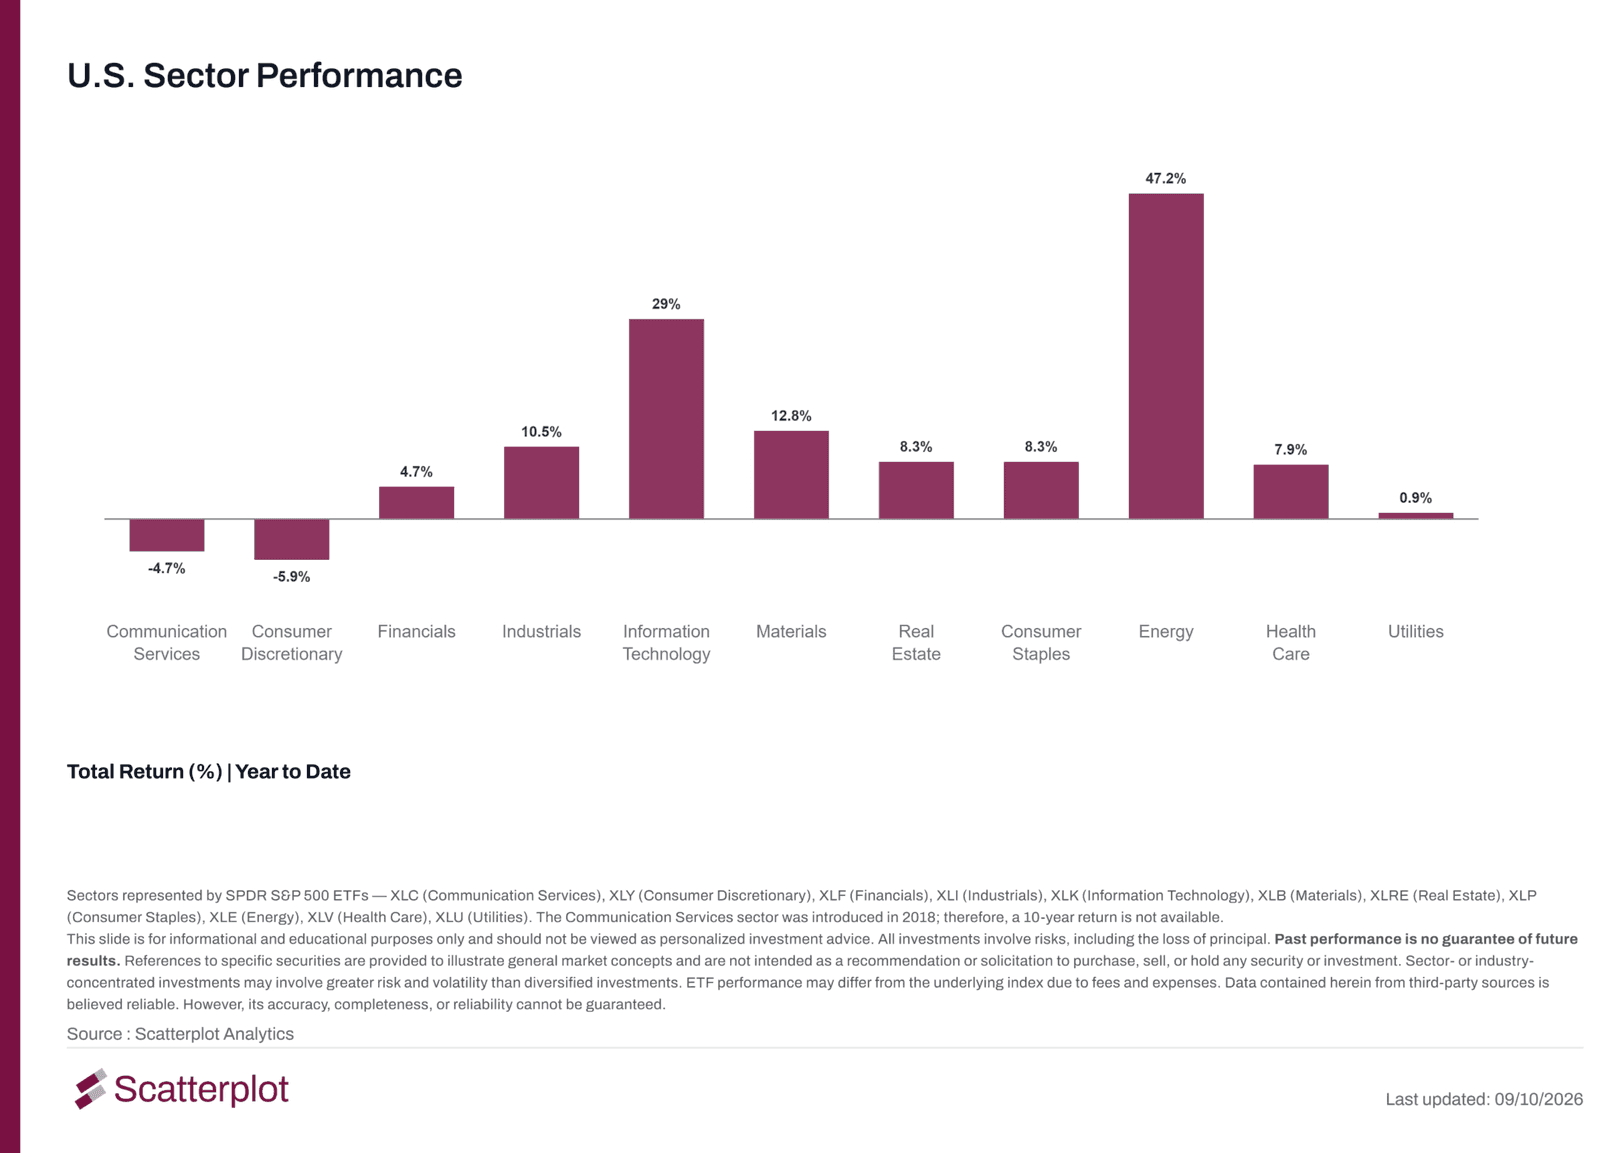
U.S. sector performance in 2026: energy and technology lead
Nine of the 11 sectors are positive year to date. Energy leads at 47.2%, followed by information technology at 29.0%, materials at 12.8% and industrials at 10.5%. Communication services is down 4.7% and consumer discretionary is down 5.9%, the only two sectors with losses.
This chart updates daily. Track it live at scatterplot.co.
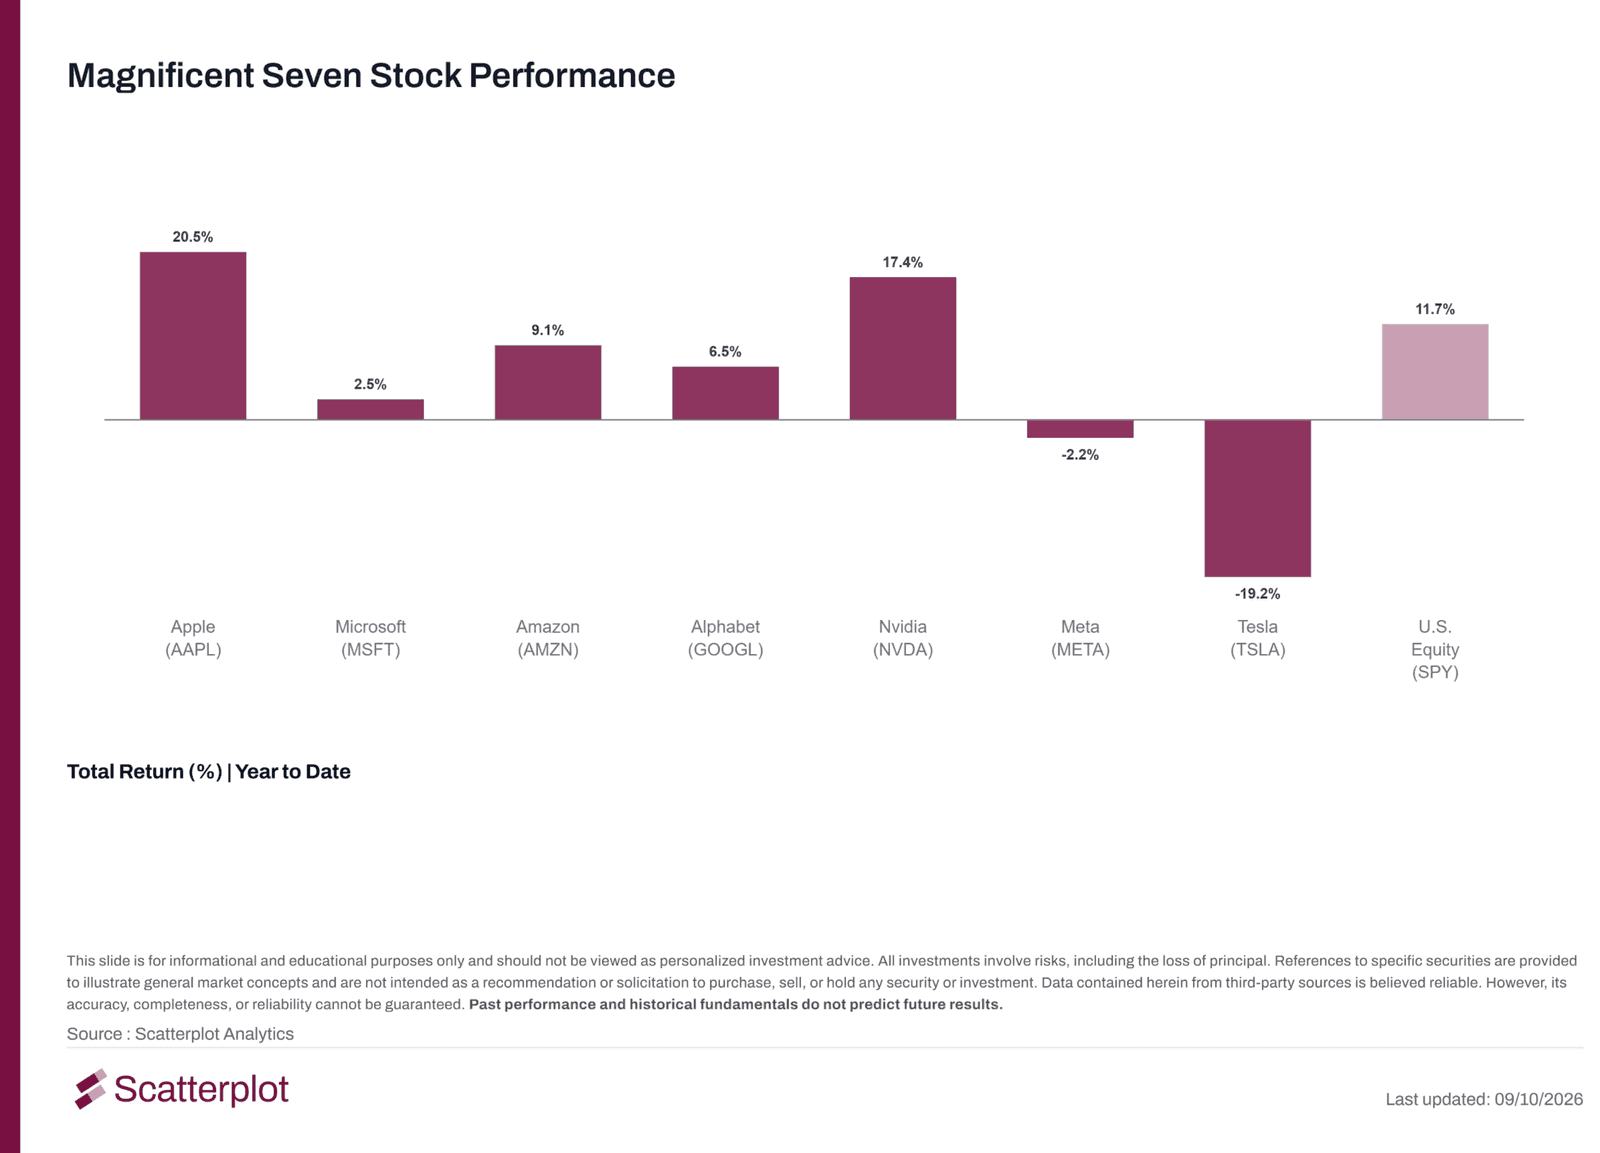
Two of the Magnificent Seven have outperformed the U.S. market in 2026
Apple (20.5%) and Nvidia (17.4%) are ahead of U.S. equities' 11.7% year-to-date return. The other five trail: Amazon (9.1%), Alphabet (6.5%) and Microsoft (2.5%) are up, while Meta is down 2.2% and Tesla is down 19.2%.
This chart updates daily. Track it live at scatterplot.co.
Four of the seven belong to the two sectors that are down this year. Alphabet and Meta are in communication services, and Amazon and Tesla are in consumer discretionary.
Technology's 29.0% gain is higher than the return of Apple, Nvidia or Microsoft.
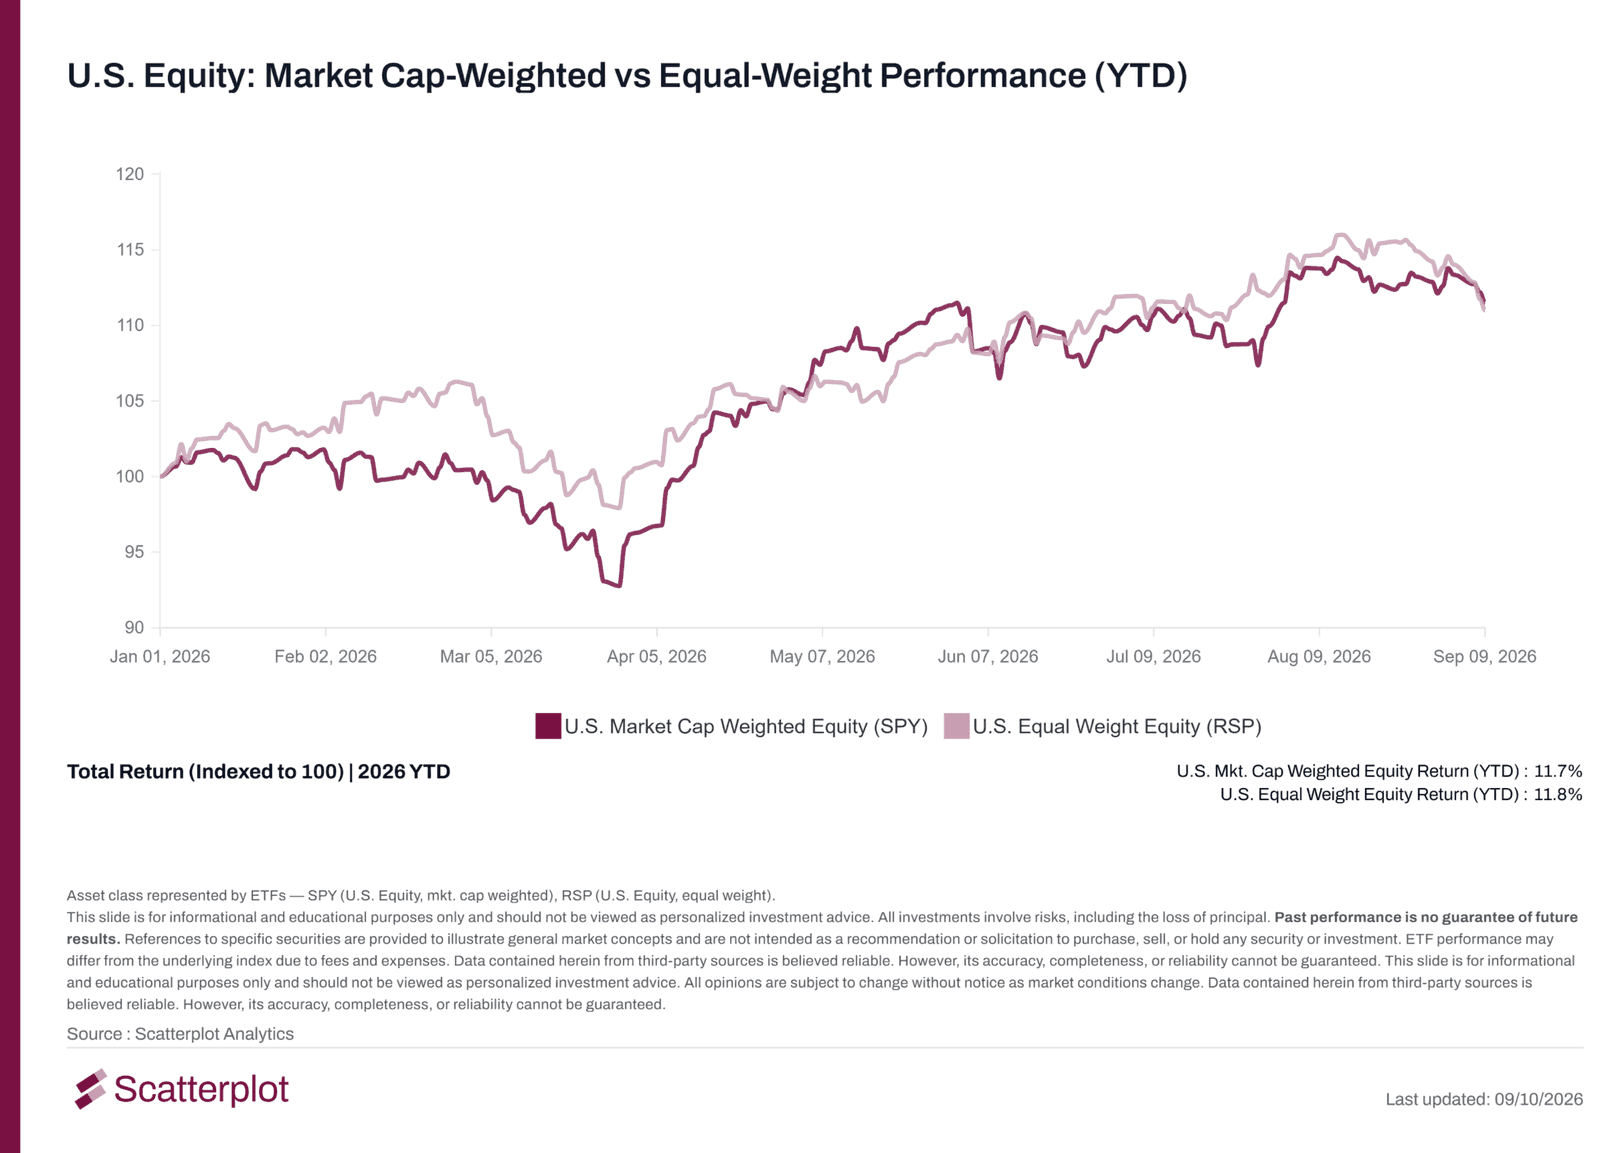
The equal-weighted and cap-weighted S&P 500 have returned about the same in 2026
A cap-weighted index weights companies by market value, so the largest companies have the most influence. An equal-weighted index gives every company the same weight. Year to date, the cap-weighted S&P 500 has returned 11.7% and the equal-weighted S&P 500 11.8%.
This chart updates daily. Track it live at scatterplot.co.
The equal-weighted S&P 500 led through the first quarter and fell less into the spring low. The cap-weighted S&P 500 caught up in May and June, and the two have tracked closely since. Year to date, the equal-weighted and cap-weighted S&P 500 have performed almost identically.
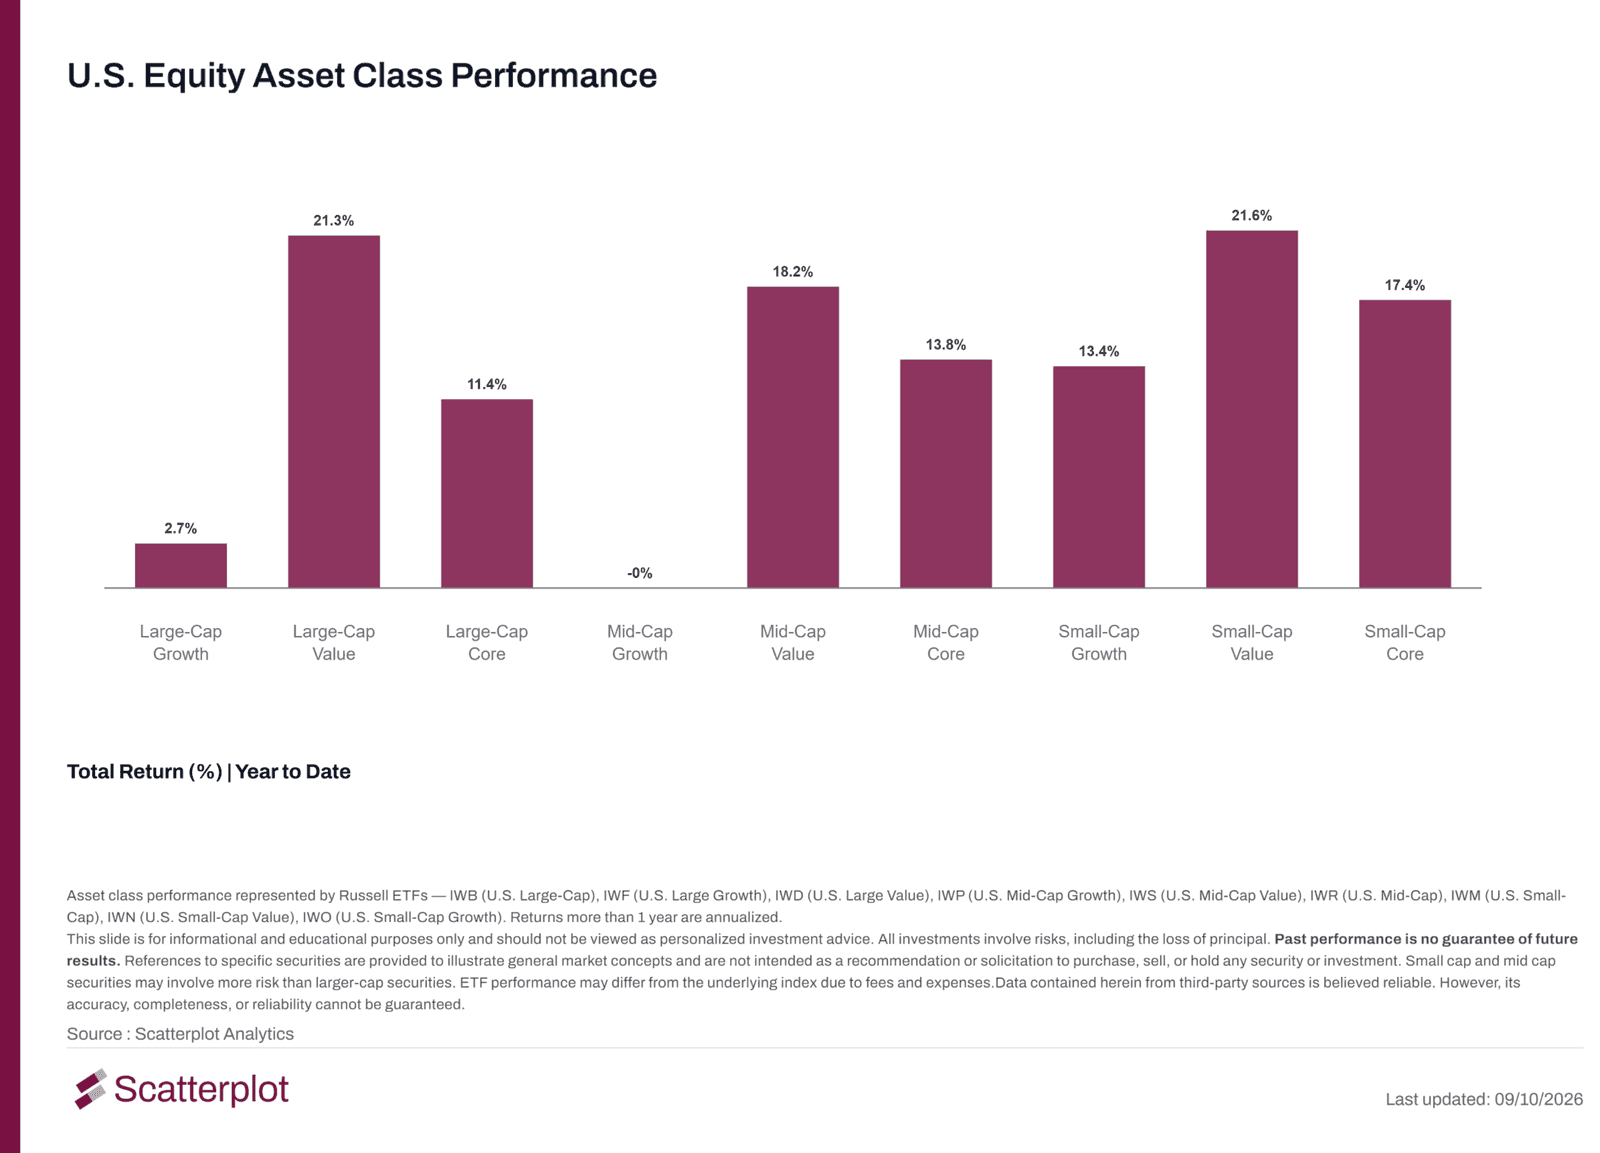
Value stocks have outperformed growth stocks at every company size in 2026
Value stocks trade at lower prices relative to measures such as earnings or book value. Growth stocks are companies with above-average earnings growth.
This chart updates daily. Track it live at scatterplot.co.
Large-cap value has returned 21.3% against 2.7% for large-cap growth. Mid-cap value has returned 18.2% against about 0% for mid-cap growth, and small-cap value 21.6% against 13.4% for small-cap growth. Small caps (17.4%) have also outperformed mid caps (13.8%) and large caps (11.4%).
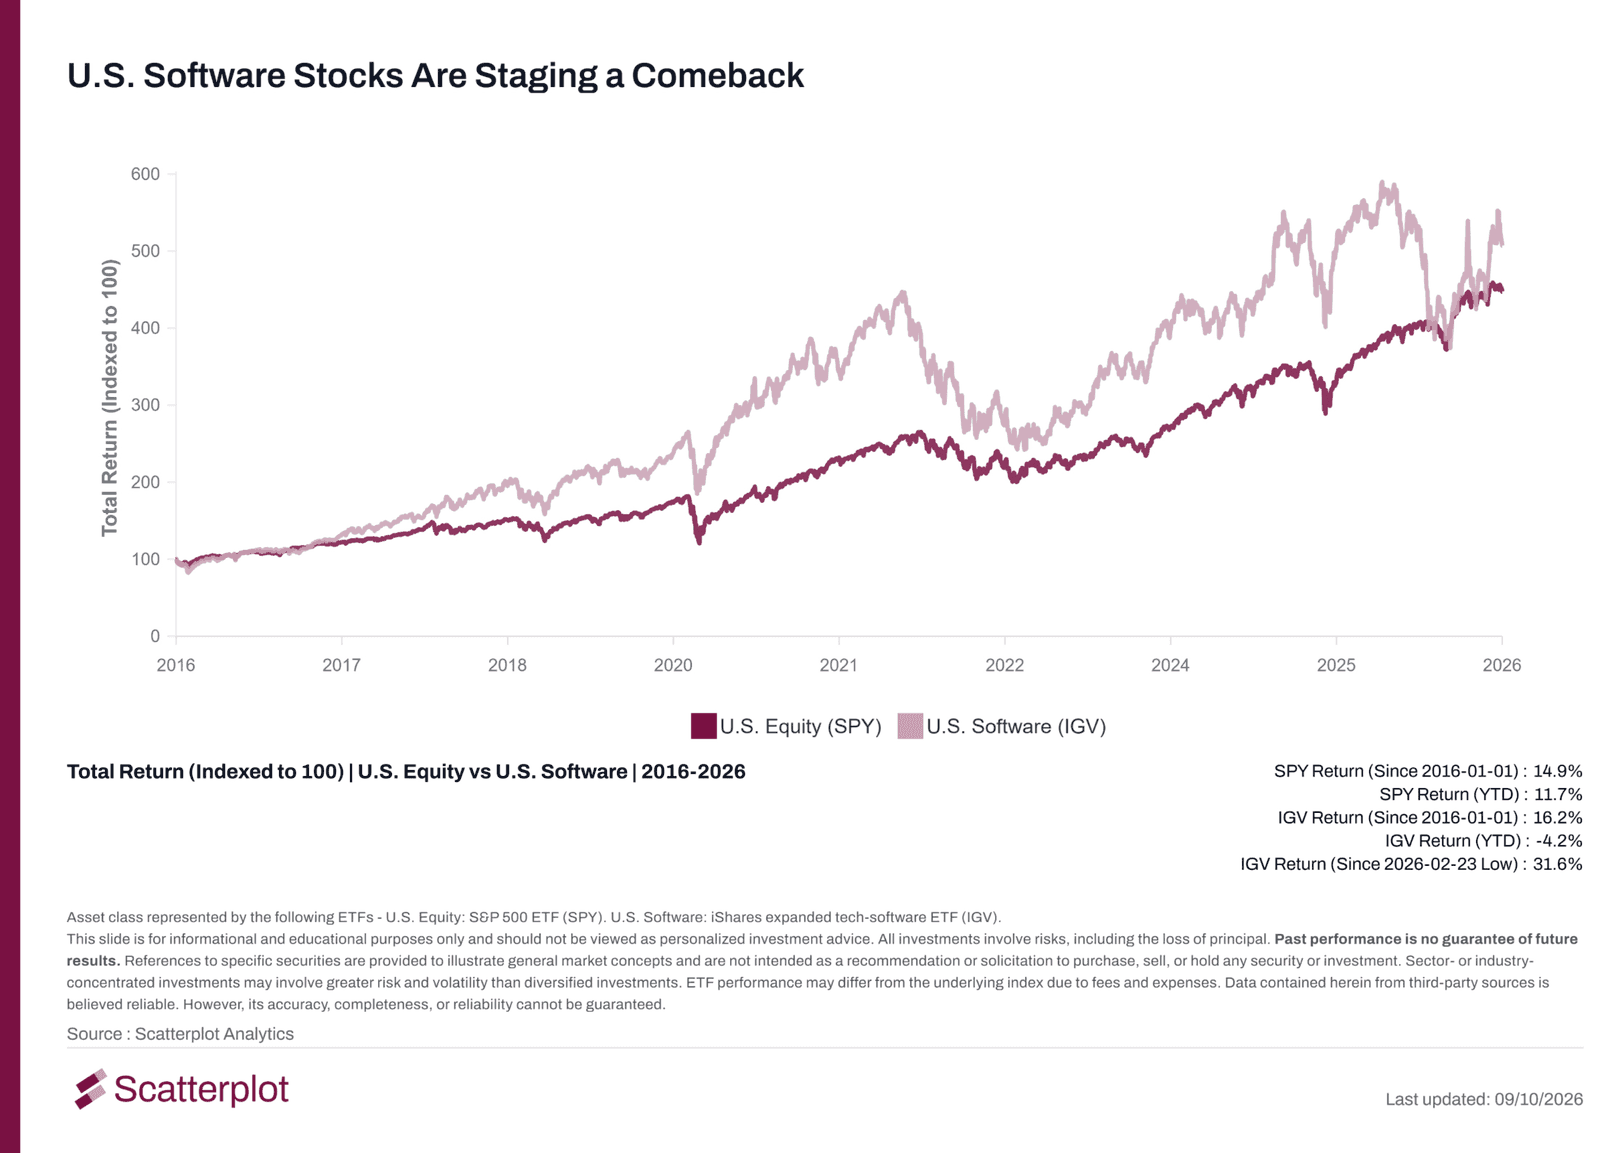
Software stocks are down 4.2% in 2026 after rising 31.6% from their February low
The software ETF (IGV) fell sharply early in 2026. At its 23 February low it was down about 27% year to date. It has gained 31.6% since that low. It is now down 4.2% year to date, against an 11.7% gain for U.S. equities.
This chart updates daily. Track it live at scatterplot.co.
Since 2016, software has returned an annualized 16.2%, against 14.9% for U.S. equities.
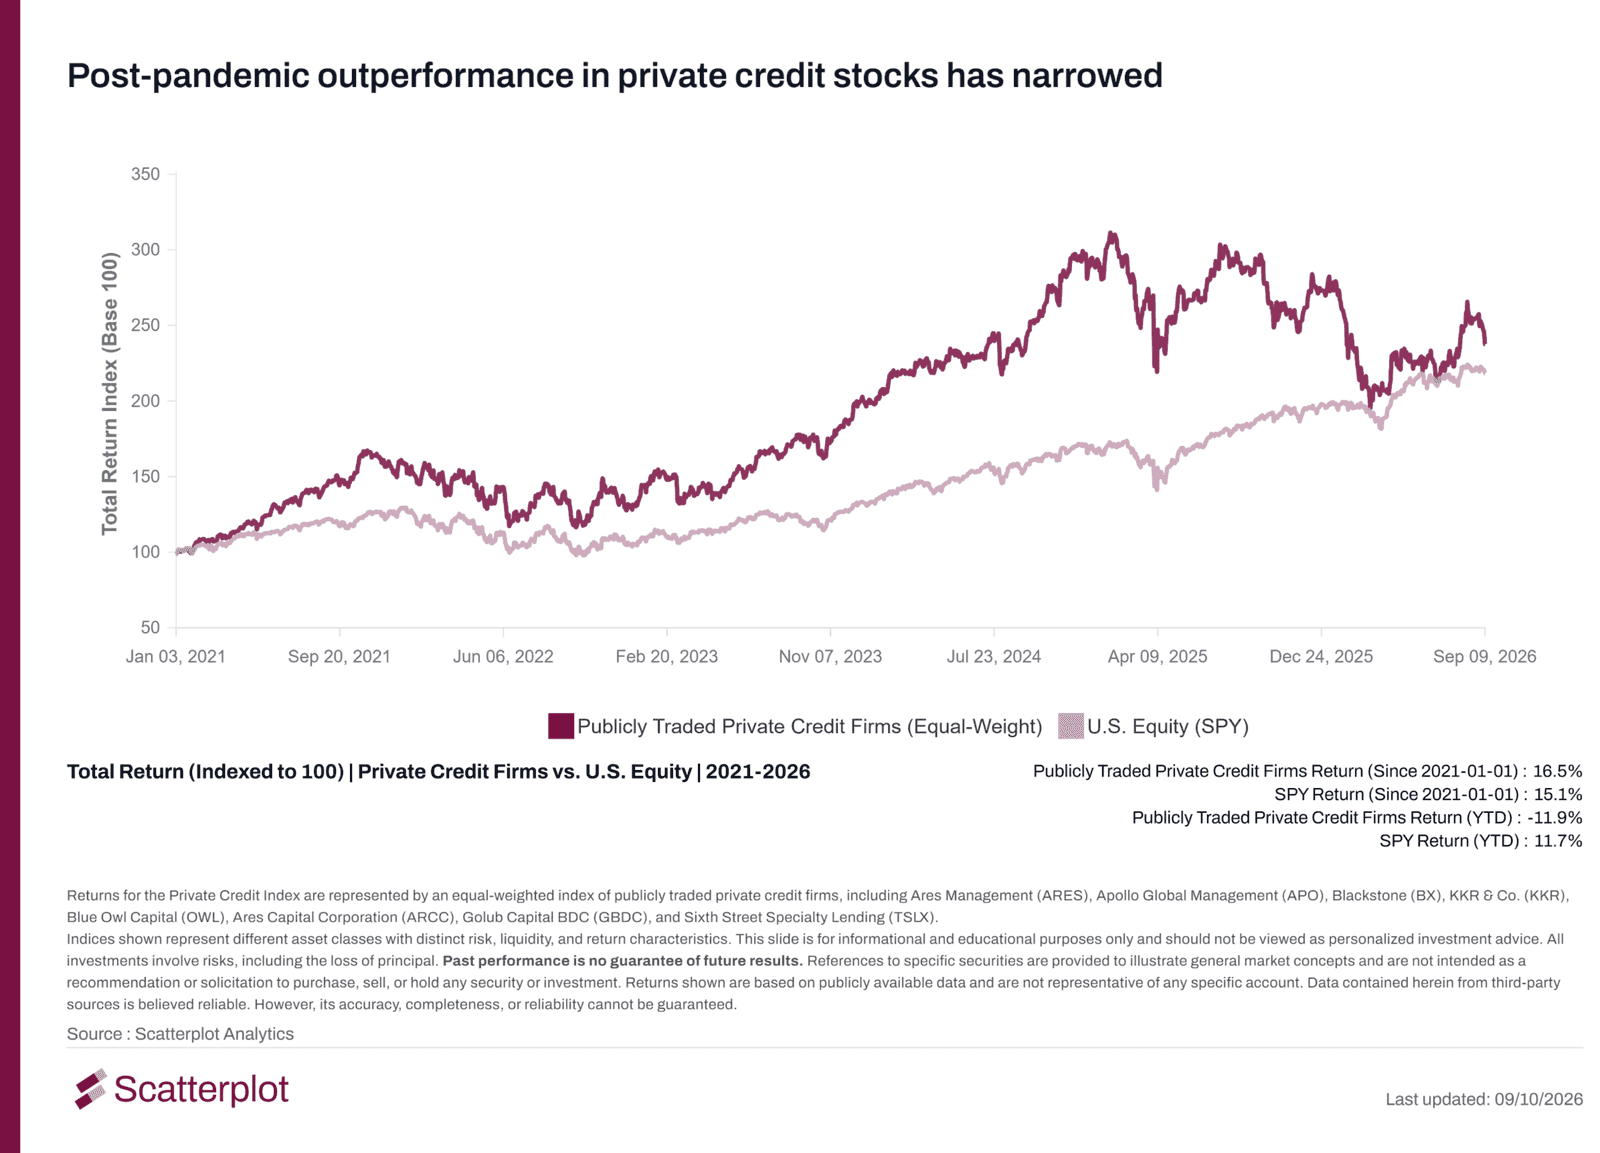
Unlike software stocks, private credit stocks are still down 11.9% in 2026
Private credit refers to loans that non-bank lenders make directly to companies, outside the public bond markets. An equal-weighted index of eight publicly traded private credit firms is down 11.9% year to date, against an 11.7% gain for U.S. equities.
This chart updates daily. Track it live at scatterplot.co.
Since 2021 the index has returned an annualized 16.5%, against 15.1% for U.S. equities. That gap was wider at the index's early-2025 peak.
Like software stocks, the private credit index fell sharply early in 2026. It rebounded from its spring low but has declined since August. Year to date, software stocks are down 4.2% and private credit stocks are down 11.9%. These figures are total returns on the firms' shares, including dividends. They are not the returns of private credit funds or loans.
FAQ
How far is the U.S. stock market from its all-time high?
As of 10 September 2026, U.S. equities were 2.58% below their last all-time high, set on 13 August 2026, on a total return basis.
How have U.S. stocks performed in 2026?
U.S. equities have returned 11.7% year to date through 10 September 2026. That trails world equities excluding the U.S. (15.4%) and emerging markets (22.3%).
How have gold and long-term Treasuries performed since the Iran conflict began?
From 28 February 2026, gold has returned −17.6% and long-term Treasuries −8.7%. Over the same period, oil has returned 43% and U.S. equities 11.1%.
What is an inverted yield curve, and is the U.S. yield curve inverted now?
A yield curve is inverted when short-term Treasury yields are higher than long-term yields. As of 11 September 2026 the U.S. curve is not inverted: the 3-month yield is 4.0% and the 10-year is 4.9%. Three years ago it was inverted, with the 3-month at 5.5% and the 10-year at 4.3%.
Have value stocks outperformed growth stocks in 2026?
Yes, at every company size. Year to date, large-cap value has returned 21.3% against 2.7% for large-cap growth. Mid-cap value has returned 18.2% against about 0% for mid-cap growth, and small-cap value 21.6% against 13.4%.
How has the equal-weighted S&P 500 performed compared with the cap-weighted S&P 500 in 2026?
Year to date, the equal-weighted S&P 500 has returned 11.8% and the cap-weighted S&P 500 11.7%.
How have software stocks performed in 2026?
The software ETF (IGV) is down 4.2% year to date. It was down about 27% at its 23 February low and has gained 31.6% since.
How have private credit stocks performed in 2026?
An equal-weighted index of eight publicly traded private credit firms has returned −11.9% year to date, against 11.7% for U.S. equities. Since 2021 the index has returned an annualized 16.5%, against 15.1% for U.S. equities.
Notes and methodology
All charts come from Scatterplot Analytics. The Treasury yield curve was updated 11 September 2026 and the other charts 10 September 2026. "Year to date" means from 1 January 2026 to each chart's update date. Returns are total returns in U.S. dollars, and returns over more than one year are annualized. The ETFs and prices behind each chart are named on the chart. U.S. equity all-time highs are based on the total return of the S&P 500 ETF (SPY). The Iran-conflict chart measures returns from 28 February 2026.
The private credit index is an equal-weighted index of Ares Management, Apollo Global Management, Blackstone, KKR, Blue Owl Capital, Ares Capital Corporation, Golub Capital BDC and Sixth Street Specialty Lending.
The software ETF's year-to-date loss at its 23 February low (about 27%) is not shown on the chart. It is calculated from the chart's year-to-date return and its return since the low.
Important disclosures
This article is for informational and educational purposes only. It is not personalized investment advice or a recommendation to buy, sell or hold any security. References to specific securities, sectors and funds are provided to illustrate general market concepts. All investments involve risk, including the loss of principal. Past performance is no guarantee of future results.
Returns shown are based on ETFs, stocks and spot prices and do not represent any specific account. Total returns assume dividends are reinvested and do not reflect taxes or transaction costs. The all-time highs chart shows growth of wealth from a starting value of 1; it is a hypothetical illustration, not the result of an actual account. ETF performance may differ from the underlying index because of fees and expenses. The private credit index is an equal-weighted group of publicly traded companies that Scatterplot constructed for illustration. It is not an investable product, and its returns do not reflect fees, expenses or trading costs.
Returns across different asset classes are not directly comparable, because they differ in risk, volatility and market dynamics. Commodity and currency investments are volatile and subject to significant risk. Sector-concentrated investments may involve greater risk than diversified investments, and small- and mid-cap securities may involve more risk than larger-cap securities.
Data from third-party sources is believed to be reliable, but its accuracy, completeness and reliability cannot be guaranteed. Figures in this article are as of the dates shown. The live charts on scatterplot.co update daily and may show different figures.
All ten charts are part of Scatterplot's market dashboard for financial advisors, available branded for your firm and updated daily.


Enjoyed this? Get more in your inbox.
Weekly insights for advisors
— charts, research, and practical tools. No fluff.
Investment Foundations
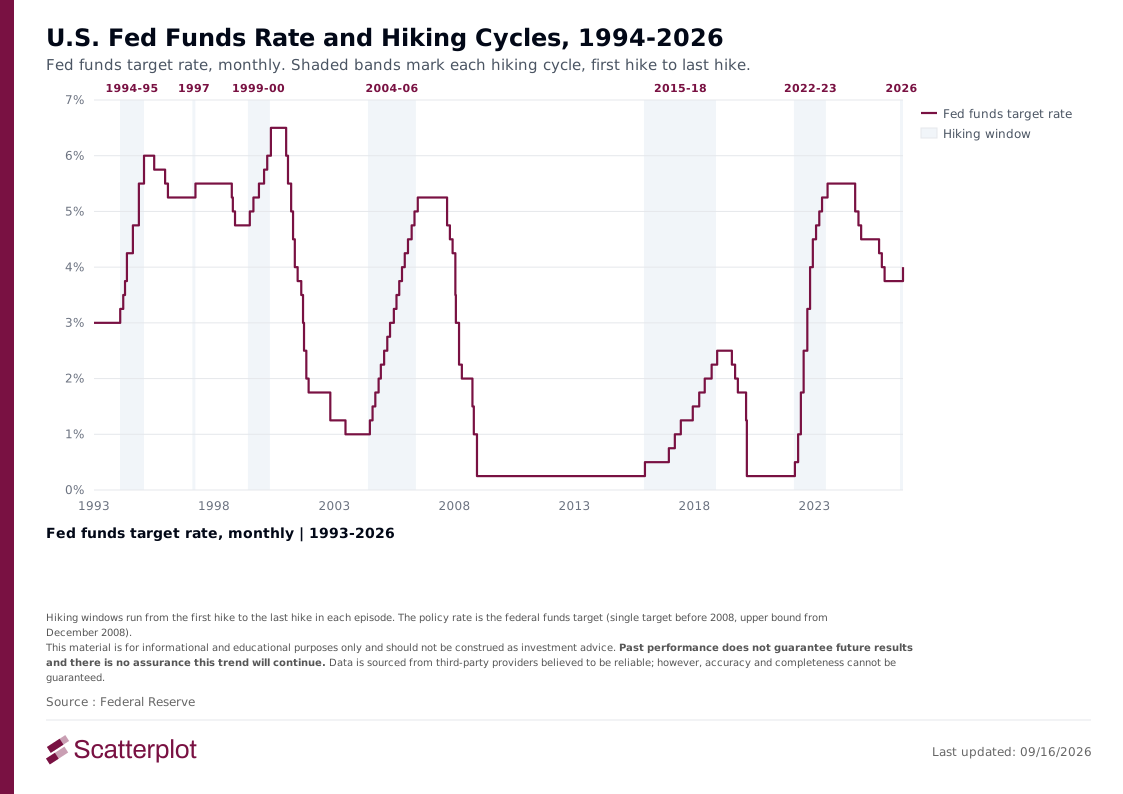
Fed Rate Hikes Since 1994: What Happened in Each Cycle
Inflation, unemployment and equity returns across seven Fed rate-hike episodes since 1994, each with its start, end and accompanying FOMC statement.
Read moreSanjeev Pati, CFA
September 21, 2026 · 10 min read
Market Insights
US Housing Market: Resale Is Frozen, New Construction Is Not
Where every US housing indicator stands : September 2026
Read moreSanjeev Pati, CFA
September 4, 2026 · 10 min read