

US Housing Market: Resale Is Frozen, New Construction Is Not
Where every US housing indicator stands : September 2026

Sanjeev Pati, CFA
Founder, Scatterplot
Introduction
Throughout this piece we use 2015–2019 as the pre-pandemic benchmark wherever it gives a useful comparison: the five years before COVID, and the last stretch when mortgage rates, sales volumes and inventory were all running at something like normal levels. Where a year-over-year change tells the story better, we say so.
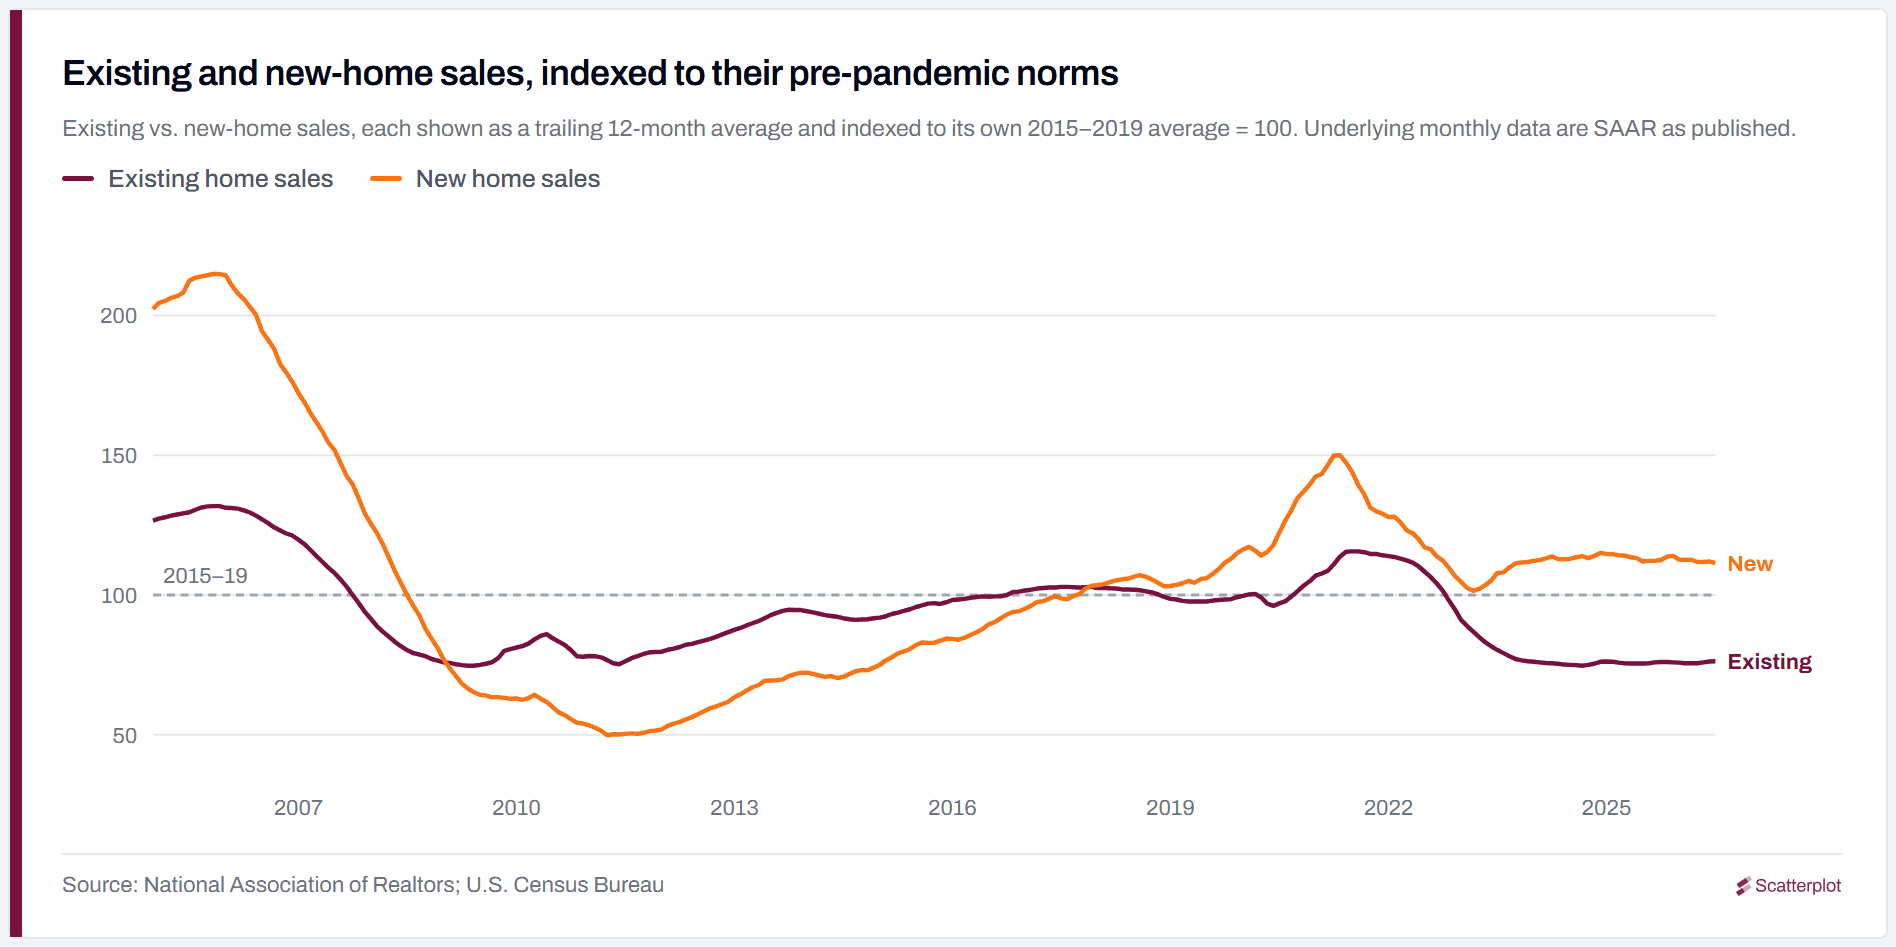
Measured against that baseline, US housing splits in two. Existing-home sales are running 24% below it and have been roughly flat since mid-2023. New-home sales are running 11% above it. The resale market is frozen; new construction is not.
One caveat that matters throughout: 2015–19 was itself a weak stretch for homebuilding. Against the stronger construction years of 1990–2007, permits sit about 7% below and new-home sales about 21% below. New construction has held up relative to resale; it has not returned to historic strength.
That split is well established at this point. What follows is where each indicator actually stands.
Key takeaways
The resale market
- −24%: Existing home sales versus their 2015–19 average, and roughly flat since mid-2023
- −30%: Purchase mortgage applications versus their 2015–19 average
- −50%: Refinance applications versus their 2015–19 average
New construction
- +11%: New home sales versus their 2015–19 average (but about 21% below the 1990–2007 average)
- −9.1% / +14.3%: Single-family versus multi-family housing starts, year over year: builders are shifting what they build
- 35: NAHB builder sentiment, where 50 is neutral and the 2015–19 average was 64
Rates and prices
- 6.71%: The 30-year mortgage rate, against a 2015–19 average of 4.0%
- +2.1%: S&P CoreLogic Case-Shiller US National Home Price Index, year over year
New-home sales have recovered; existing-home sales have not
Both fell sharply in 2022. On a 12-month average, new-home sales have since returned to 111 on an index where 100 is their own 2015–19 norm. Existing-home sales sit at 76.
The 30-year mortgage rate has climbed about 70bp since March
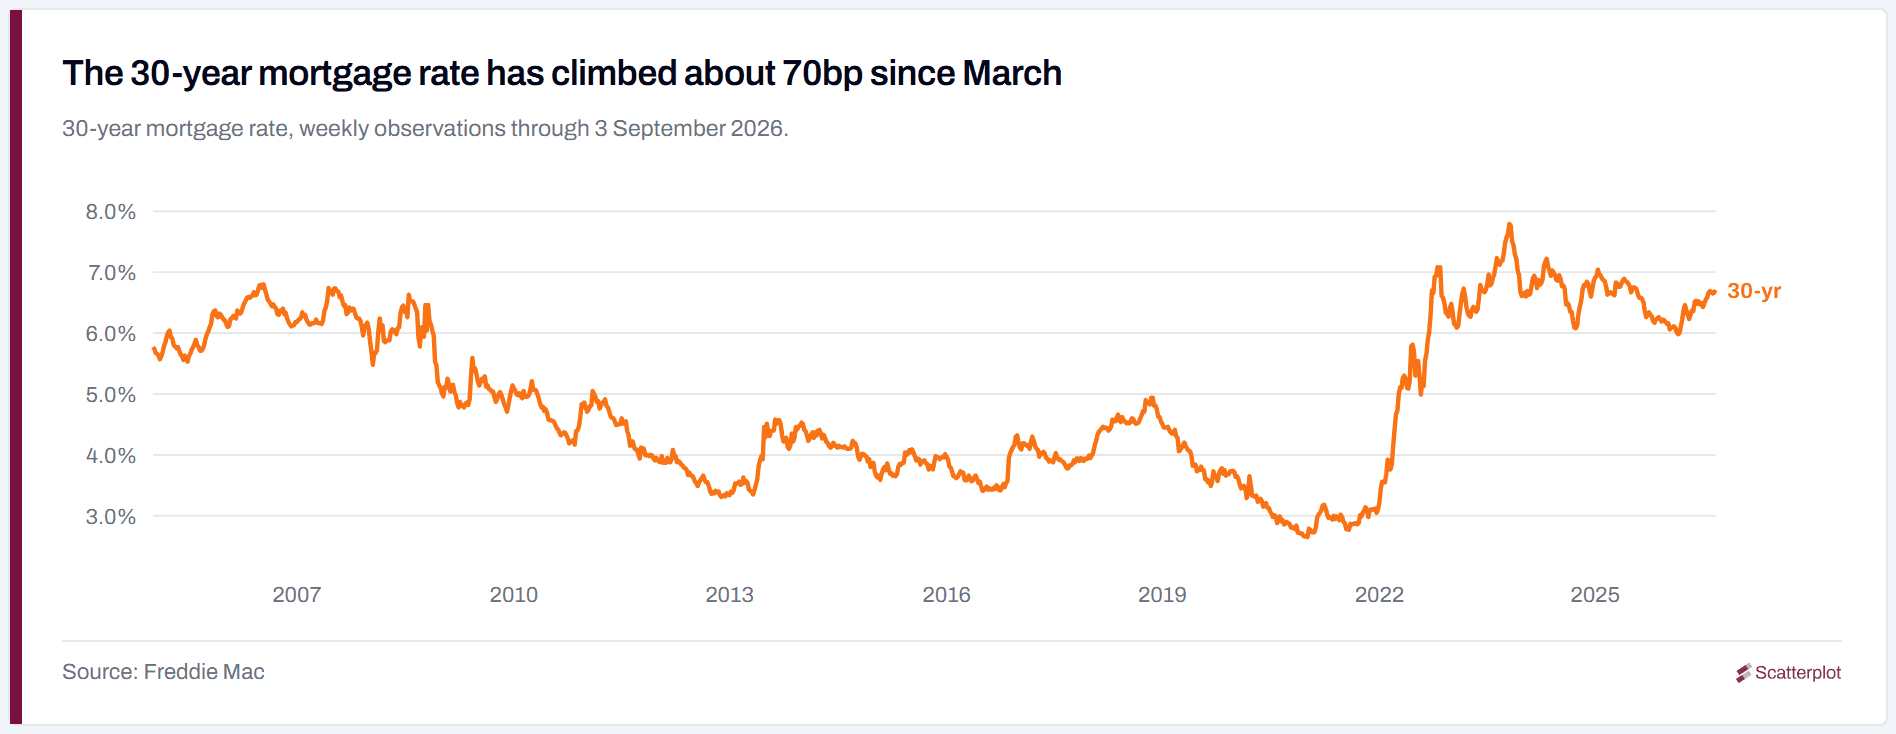
The 30-year sits at 6.71% and the 15-year at 6.04%. The 30-year bottomed near 6.00% in March and has risen since, alongside higher long-term Treasury yields, the opposite of the easing many expected this year.
Existing-home sales have held near 4.1 million since mid-2023
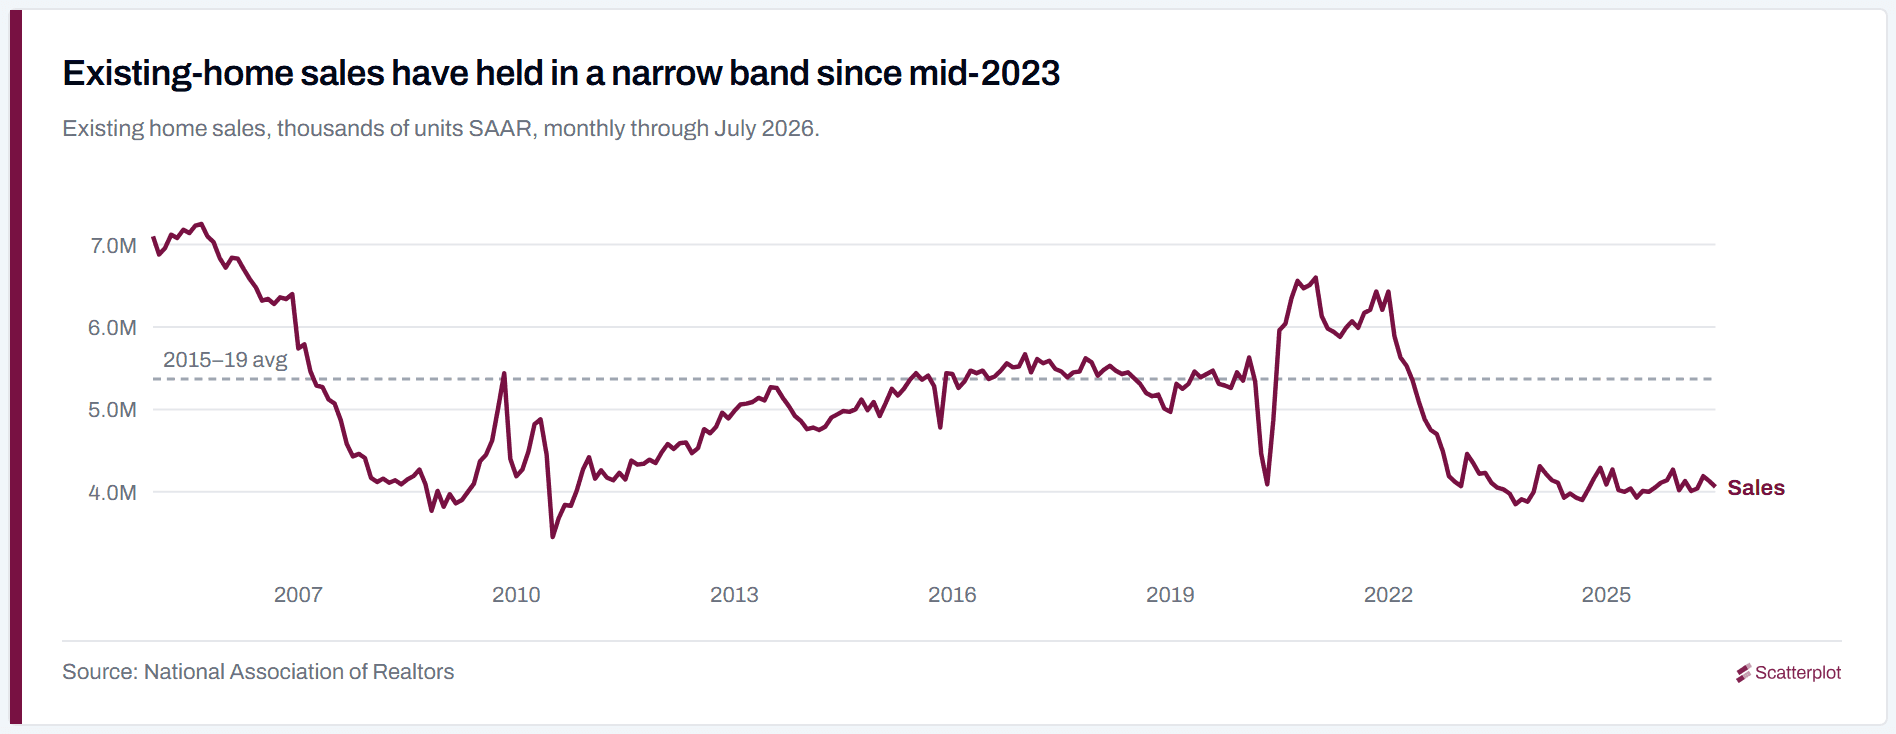
4.06M in July 2026, against a 2015–19 average of 5.37M. Sales fell through 2022 and into 2023, then stopped falling: the 12-month average has stayed between 4.0M and 4.4M since mid-2023, and sits at 4.10M today against 4.08M at the end of 2024.
Purchase applications are 30% below normal, refinancing 50%
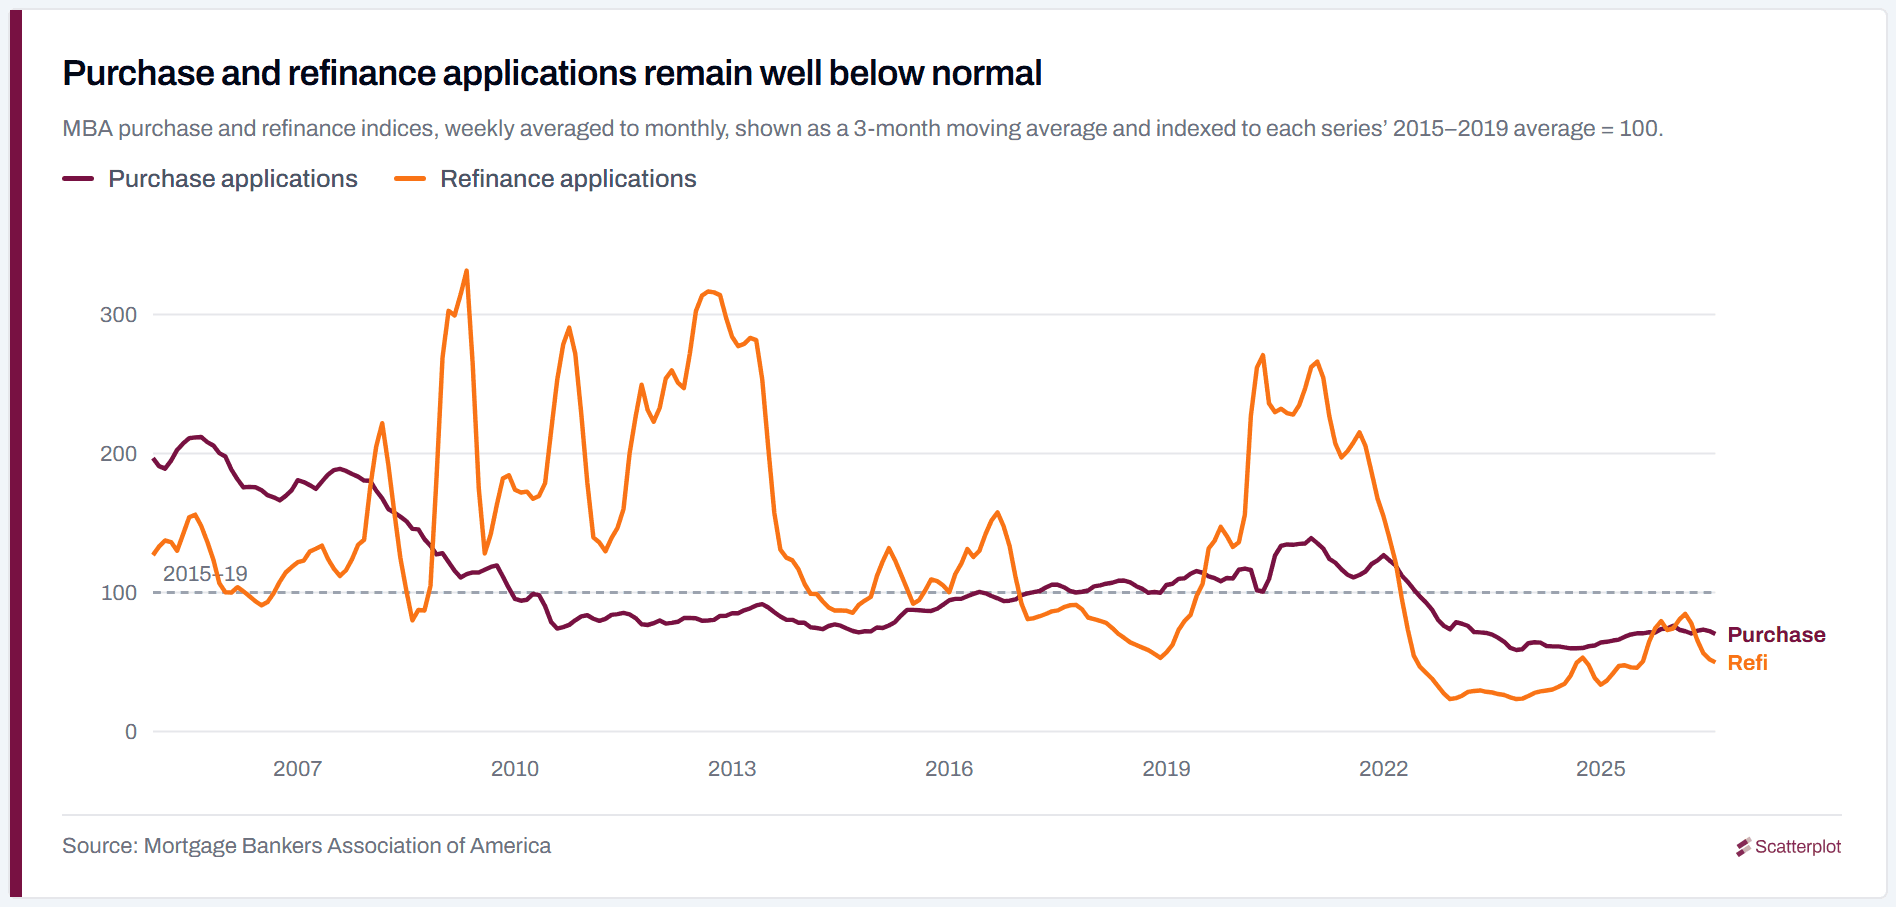
Mortgage applications remain depressed relative to the pre-pandemic period. On a three-month average through August, purchase applications run about 30% below their 2015–19 average and refinance applications about 50% below.
Purchase activity has changed little over the past year, reflecting the continued weakness in home turnover. Refinancing briefly picked up in early 2026, when the 30-year dipped to 6.00%, then fell back as rates rose again; it stays subdued because current rates remain well above the rates most existing borrowers already hold.
An FHFA working paper estimates that mortgage-rate lock-in prevented 1.72 million home sales between Q2 2022 and Q2 2024 [1].
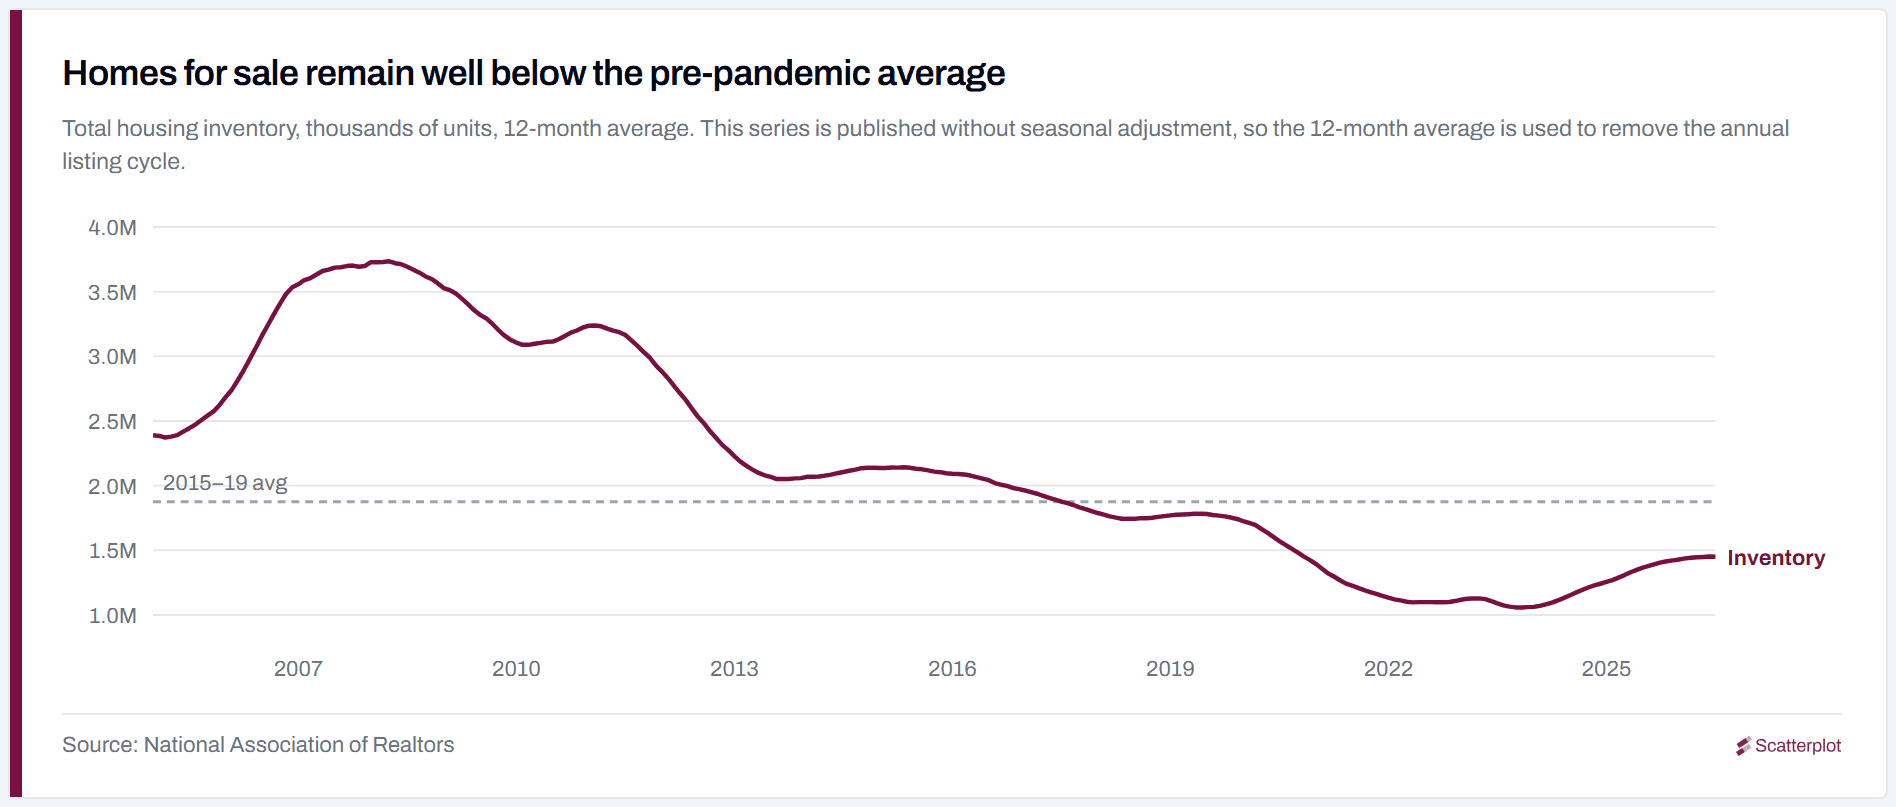
Homes for sale remain 23% below the pre-pandemic average
1.45M homes for sale on a 12-month average. Inventory has been recovering from its late-2023 low (up about 37% from that trough) but remains 23% below the 2015–19 average.
The qualifier that matters: sales fell about as much. At the current sales pace there are roughly 4.3 months of supply, against 4.2 months in 2015–19. Supply and demand contracted together, which is why a 24% fall in sales has not pushed prices down.
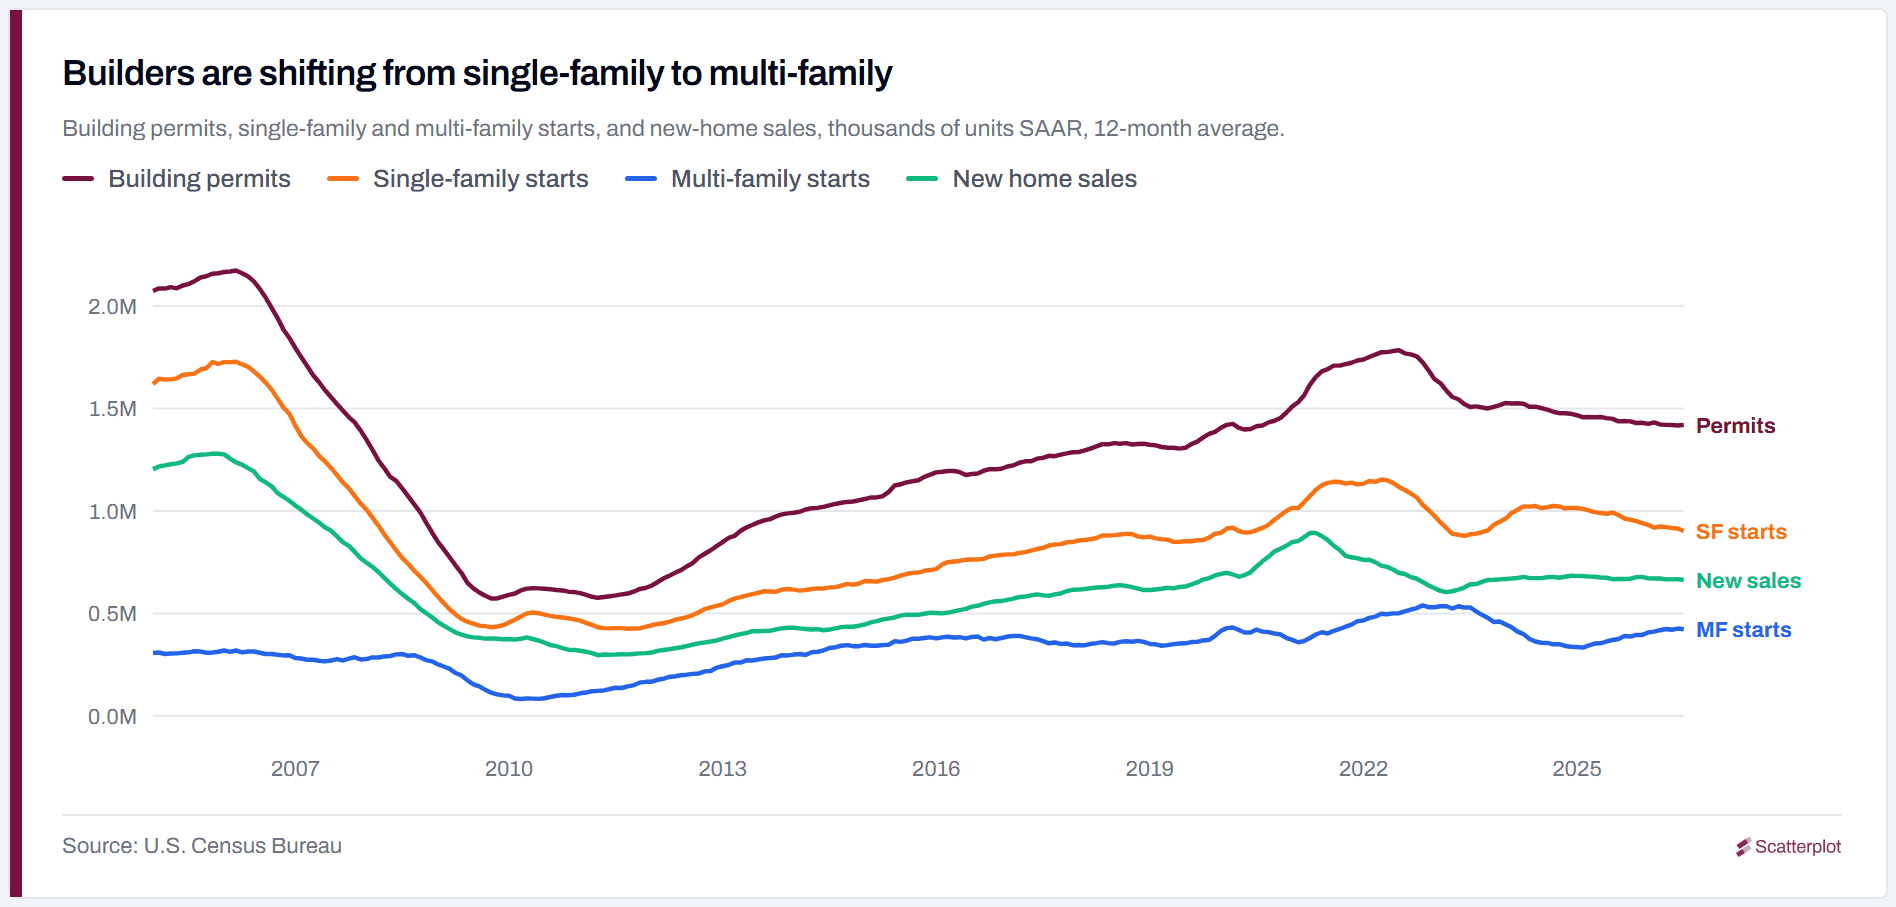
Builders are shifting from single-family to multi-family
Permits (1.42M) and new-home sales (663k) both run about 11% above their 2015–19 averages, though against the stronger construction era of 1990–2007 permits sit 7% below and new-home sales 21% below. Read this as construction holding up relative to resale, not as a building boom.
Total activity is broadly steady: permits are down 2.0% year over year and total starts down 3.0%. The mix has moved more than the level: single-family starts are down 9.1% while multi-family starts are up 14.3%.
These are largely different markets rather than the same builders switching product: multi-family responds to rental demand, is financed differently, and is about two and a half times as volatile as single-family, so a 12-month average is the shortest window worth reading it over.
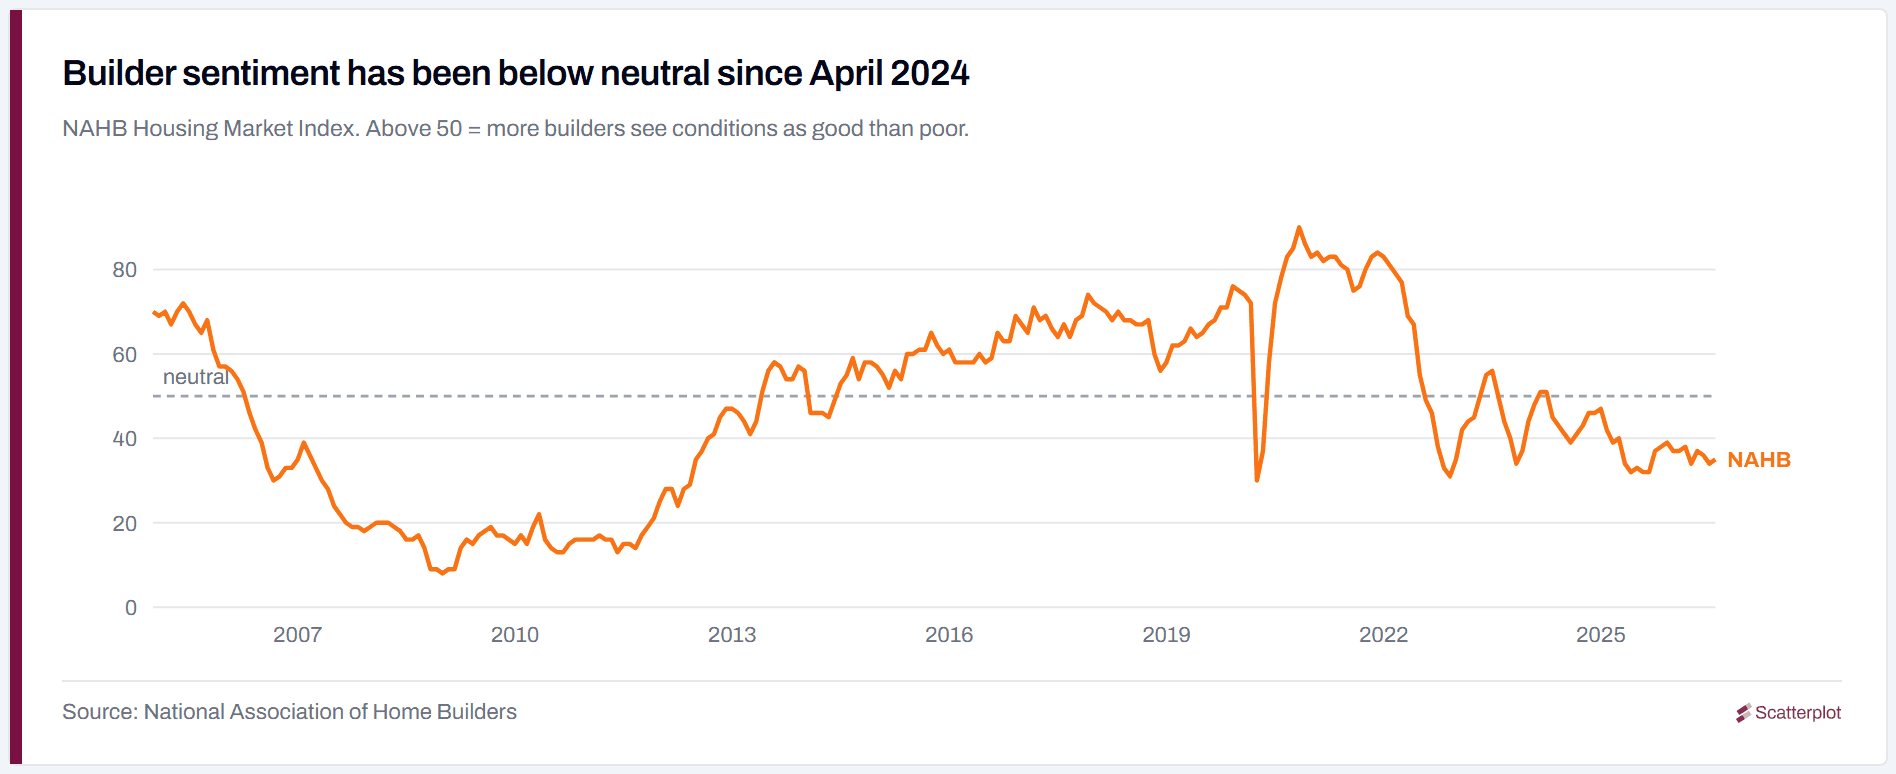
Builder sentiment has been below neutral since April 2024
The NAHB index reads 35, where 50 is neutral and the 2015–19 average was 64. It has not been at or above neutral since April 2024, and has spent 77% of the months since January 2022 below it, despite new-home sales running above their pre-pandemic norm over the same period.
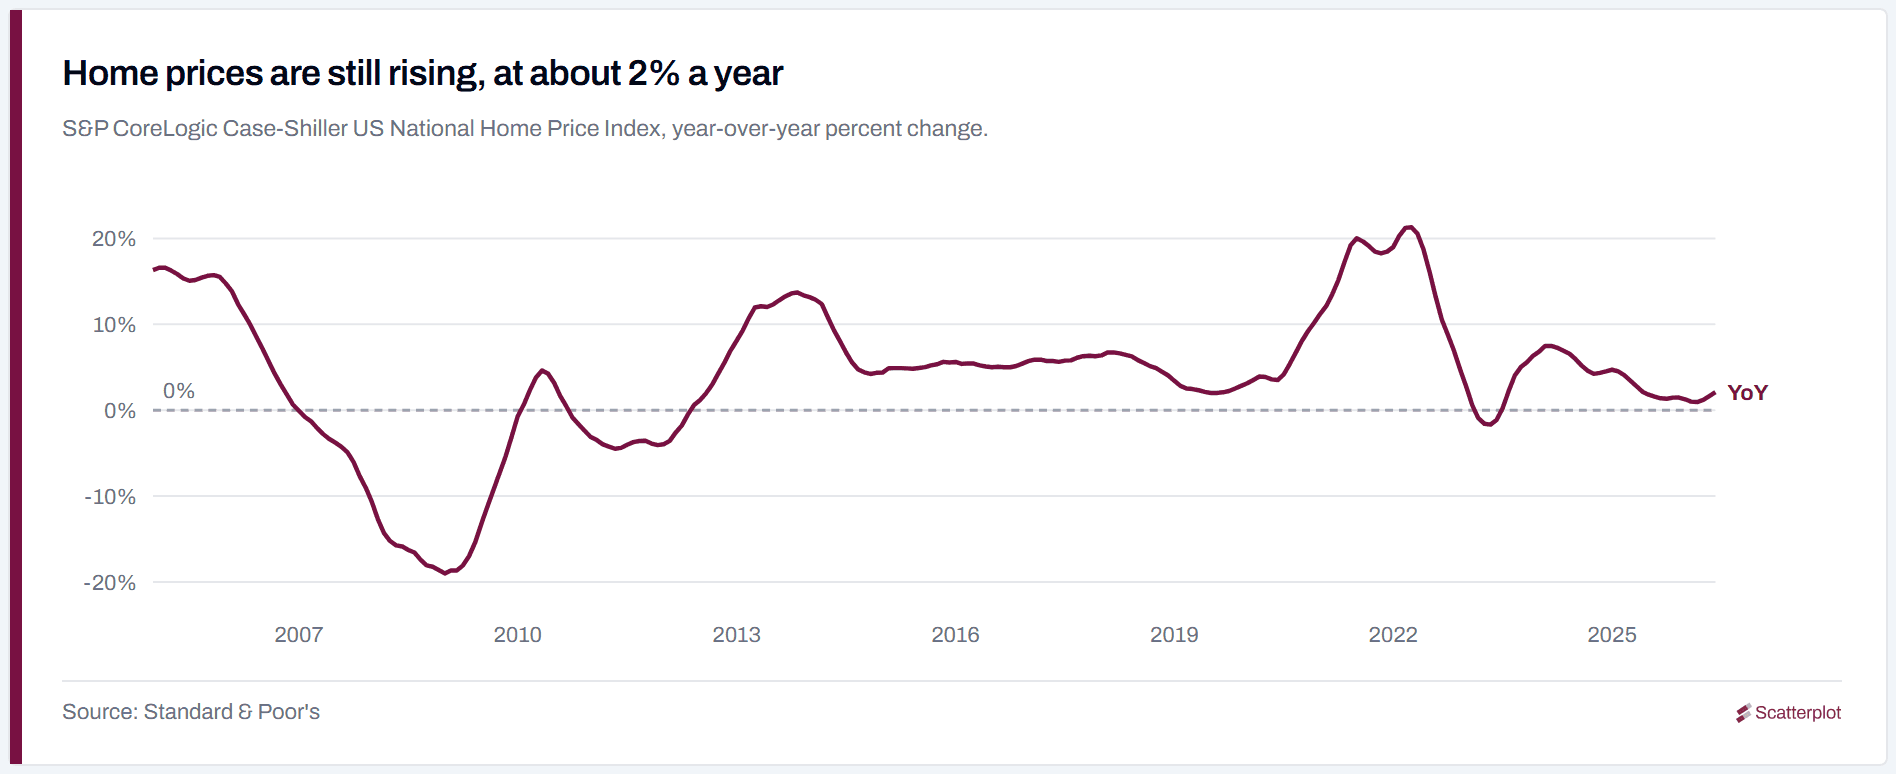
Home prices are still rising, at about 2% a year
The Case-Shiller US National Home Price Index is up 2.1% year over year. (Separately, the average new home sold for $508,800 in July, though that series is unadjusted and swings with the mix of houses builders close in a given month.) Volume collapsed; prices did not. This is the pattern of a low-turnover market rather than a distressed one.
What could change it ?
- Rates falling far enough to weaken lock-in. Every move lower narrows the gap between the mortgage rates homeowners already hold and the rates available on a new loan
- Time. Lock-in should decay gradually as life events (job changes, growing families, deaths and divorces) lead some homeowners to move despite the rate penalty.
- New construction continuing to fill the gap. The single-family side is worth watching: were builders to shift further toward multi-family, the segment that competes most directly with resale would get smaller.
The key downside risk is forced supply. The defining feature of this cycle so far has been constrained turnover rather than distressed selling. A labour-market deterioration severe enough to push more homeowners into selling would change that picture.
The mechanism, and a note from my own street
Mortgage-rate lock-in helps explain much of the unusual pattern on the resale side of the market. A homeowner with a 3% mortgage who sells and buys again takes on a new one at 6.71%, so they stay, the home never lists, and the freeze constrains supply as much as demand. An FHFA working paper puts the cost at 1.72 million prevented sales between 2022 and 2024 [1]. In a New York Fed survey, homeowners with mortgage rates below 3% raised their stated probability of moving within three years from 17.2% to 27.7% when hypothetically allowed to keep their existing rate [2]: stated intent, not observed moves. New homes come with no incumbent owner's low-rate mortgage to give up, so builders are not constrained the same way.
You can see the same pattern in miniature on my street. Houses used to turn over regularly; now almost nothing lists. Some of the families who might ordinarily have moved once their kids finished school are still here. I can't know how much of that is mortgage lock-in, but it looks a lot like the national pattern in the data.
FAQ
Is the US housing market frozen in 2026?
The resale market is. Existing-home sales run about 24% below their 2015–2019 average and have been roughly flat since mid-2023. New-home sales are about 11% above their pre-pandemic average.
Why aren't home prices falling if sales are so weak?
Supply is as constrained as demand. Inventory is about 23% below its pre-pandemic average, in part because homeowners with low-rate mortgages have less incentive to list, but sales are down about as much, so at the current pace there are about 4.3 months of supply against 4.2 months in 2015–19. The market is no looser than before. The Case-Shiller national index is up 2.1% year over year.
What is the mortgage rate lock-in effect?
Homeowners holding mortgages well below current market rates face a large payment increase if they sell and buy again, so they stay put. An FHFA working paper estimates this prevented 1.72 million home sales between 2022 and 2024 [1].
Are homebuilders still building?
Yes, but they have changed what they build. Permits run about 11% above their 2015–2019 average, and total starts are down just 3% year over year, but single-family starts are down 9.1% while multi-family starts are up 14.3%. Builder sentiment sits at 35, against 50 neutral.
Sources and notes
Chart data. Series accessed via Trading Economics; each chart names the agency that publishes it. Series run to different dates because the agencies publish on different calendars: mortgage rates to 3 September 2026; MBA applications and NAHB sentiment to August 2026; Census and NAR monthly series to July 2026; Case-Shiller to June 2026. Every chart runs to its own latest release, and each figure quoted in the text is that chart's endpoint.
Method. Underlying series are used as published by their respective agencies; we do not independently seasonally adjust the data. Sales, starts and permits are published at seasonally adjusted annual rates (SAAR) by the Census Bureau and NAR. For presentation and comparison, some series are averaged or indexed as described below.
Two series need extra care. Housing inventory is published without any seasonal adjustment (listings always peak in summer and bottom out in December), so we show it as a 12-month average, which cancels that yearly cycle out. The MBA application indices are weekly and noisy, so they are shown and compared as a three-month moving average: the same measure in the chart, the headline and the text.
Index and multi-series comparisons (the existing- vs. new-home sales index, and the permits/starts/new-sales chart) use trailing 12-month averages to smooth monthly volatility. The existing-home sales level chart and its latest-month figure (4.06M) show the raw published SAAR value instead. Where we report year-over-year changes for construction (permits, total starts, and the single-family/multi-family split), those changes compare the latest trailing 12-month average with the trailing 12-month average one year earlier, not the latest month against the same month a year ago. Other baseline comparisons use the plain 2015–2019 average unless otherwise noted. That window is a choice: it covers the five pre-pandemic years, and picking a different one would change the levels, materially so for construction, where 2015–19 was itself a weak era.
Two further limits. All comparisons are of raw levels, not adjusted for population or household growth; US households have grown since 2017, so these figures understate the fall in resale activity per household and flatter the construction numbers. And the Case-Shiller index is a three-month average published with a two-month lag, so the June 2026 reading reflects transactions from roughly April to June.
Research cited
Batzer, Coste, Doerner & Seiler, The Lock-In Effect of Rising Mortgage Rates, FHFA Working Paper 24-03: https://www.fhfa.gov/document/wp2403.pdf
Mortgage Rate Lock-In and Homeowners' Moving Plans, Federal Reserve Bank of New York, Liberty Street Economics, May 2024: https://libertystreeteconomics.newyorkfed.org/2024/05/mortgage-rate-lock-in-and-homeowners-moving-plans
Disclosure
This content is provided for informational and educational purposes only and should not be relied upon as investment advice or as a recommendation to buy or sell any investment or make any financial decision. No representation is made that any investment strategy, market view, forecast, or interpretation will be successful.
Charts and analysis are based on historical data obtained from third-party sources believed to be reliable, but the accuracy, completeness, and timeliness of the data are not guaranteed. Data may be revised by the original source after publication. Certain charts use calculations or transformations, including indexing, moving averages, and comparisons with historical periods, as described in the accompanying text and methodology notes.
Historical relationships, trends, and market conditions may not persist in the future. Past performance is not indicative of future results. All investing involves risk, including the loss of principal.
Please refer to our Terms and Conditions for more information.
Want to use these charts?
Charts in this piece are available branded for your firm and updated daily. If you'd like to use them in client conversations, send us a note at support@scatterplot.co.


Enjoyed this? Get more in your inbox.
Weekly insights for advisors
— charts, research, and practical tools. No fluff.
Investment Foundations
Fed Rate Hikes Since 1994: What Happened in Each Cycle
Inflation, unemployment and equity returns across seven Fed rate-hike episodes since 1994, each with its start, end and accompanying FOMC statement.
Read moreSanjeev Pati, CFA
September 21, 2026 · 10 min read
Market Insights
September 2026 Market Update: Oil Up, Gold and Long-Term Treasuries Down Since the Iran Conflict
September 2026 market update: U.S. stocks sit 2.6% below their August high, and gold and long-term Treasuries are down since the Iran conflict. 10 charts.
Read moreSanjeev Pati, CFA
September 11, 2026 · 10 min read