

How Often Does the Stock Market Drop 1% in a Day?
In the last 6 weeks, there have been 3 days where the U.S. market dropped more than 1% in a day. Historically, a 1% drop happens every 8 trading days on average, but the typical gap (median) is just 4 days. This article looks at why both a single 1% drop and a cluster of them are normal market events.

Sanjeev Pati, CFA
Founder, Scatterplot
Introduction
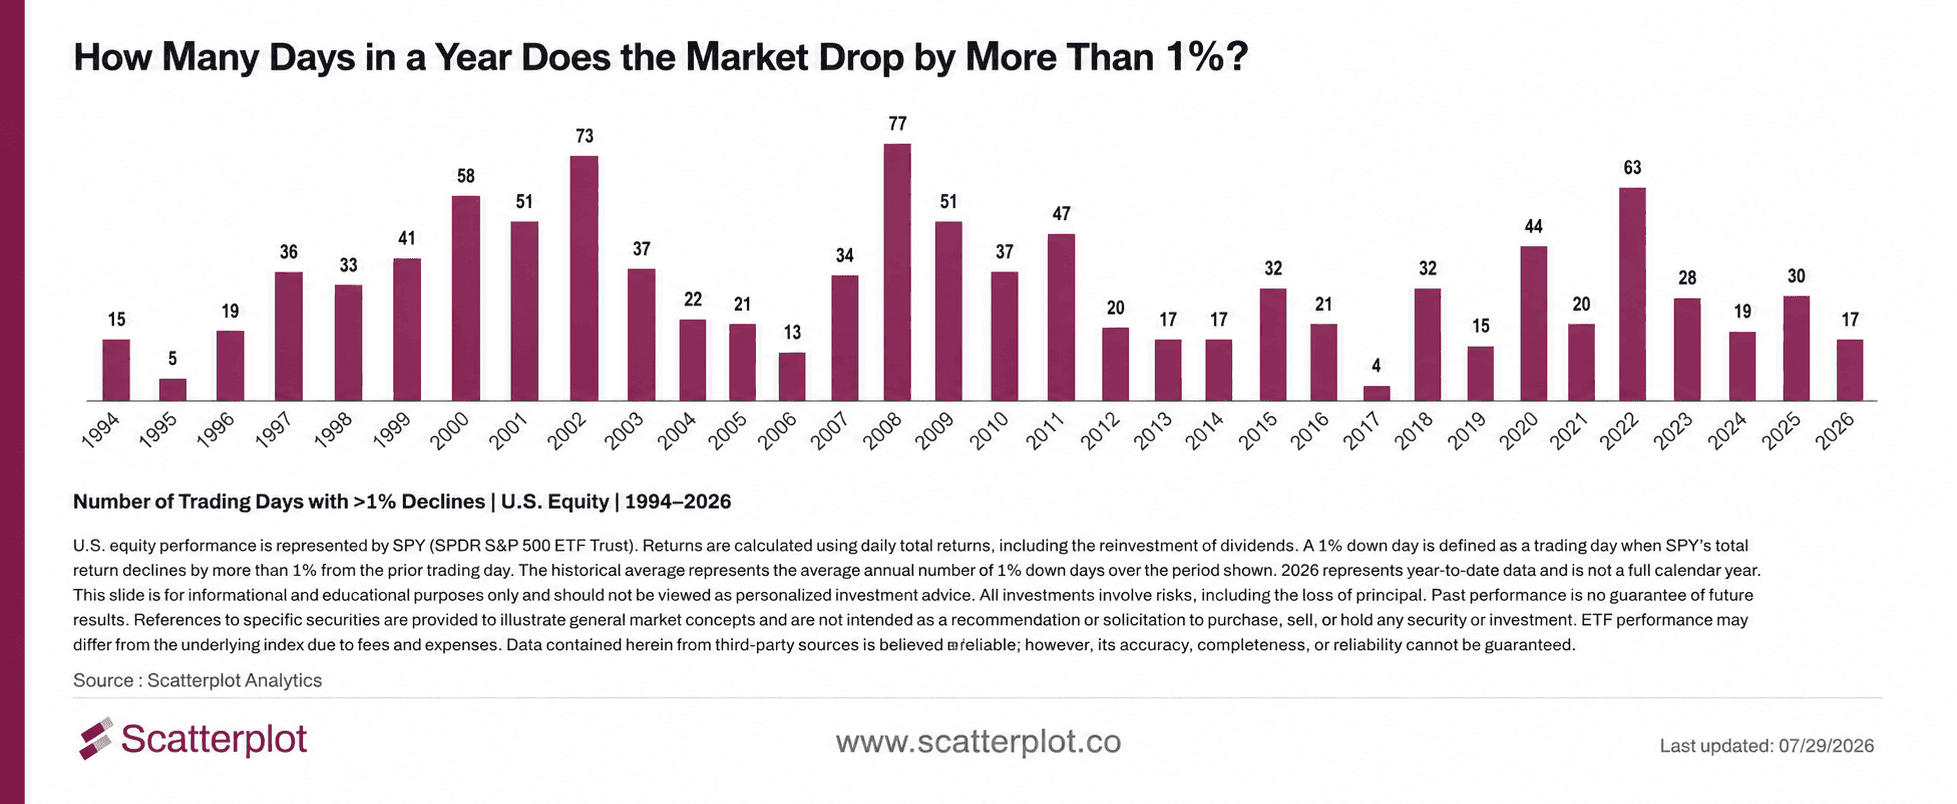
Historically, the S&P 500 (SPY) has dropped more than 1% in a day, about once every 8 trading days, roughly 32 times a year. That's the average, since 1994. But the median is just 4 trading days, half the time.
Here's why that gap matters: A 1% daily drop does not spread out evenly. More than 60% are followed by another drop within five trading days. Over 90% within a month. Then there's usually a long calm stretch before the next one. That's what pulls the average up to 8 days, even though the typical experience is closer to half that.
1 in 8 Trading Days
We looked at SPY total return data from January 1994 through July 2026: about 12.8% of all trading days close down more than 1%, which works out to roughly 32 such days a year, or 1 in every 8 trading days.
Years where the S&P 500 finished negative had 59 of these drops on average. Years where it finished positive had 26.
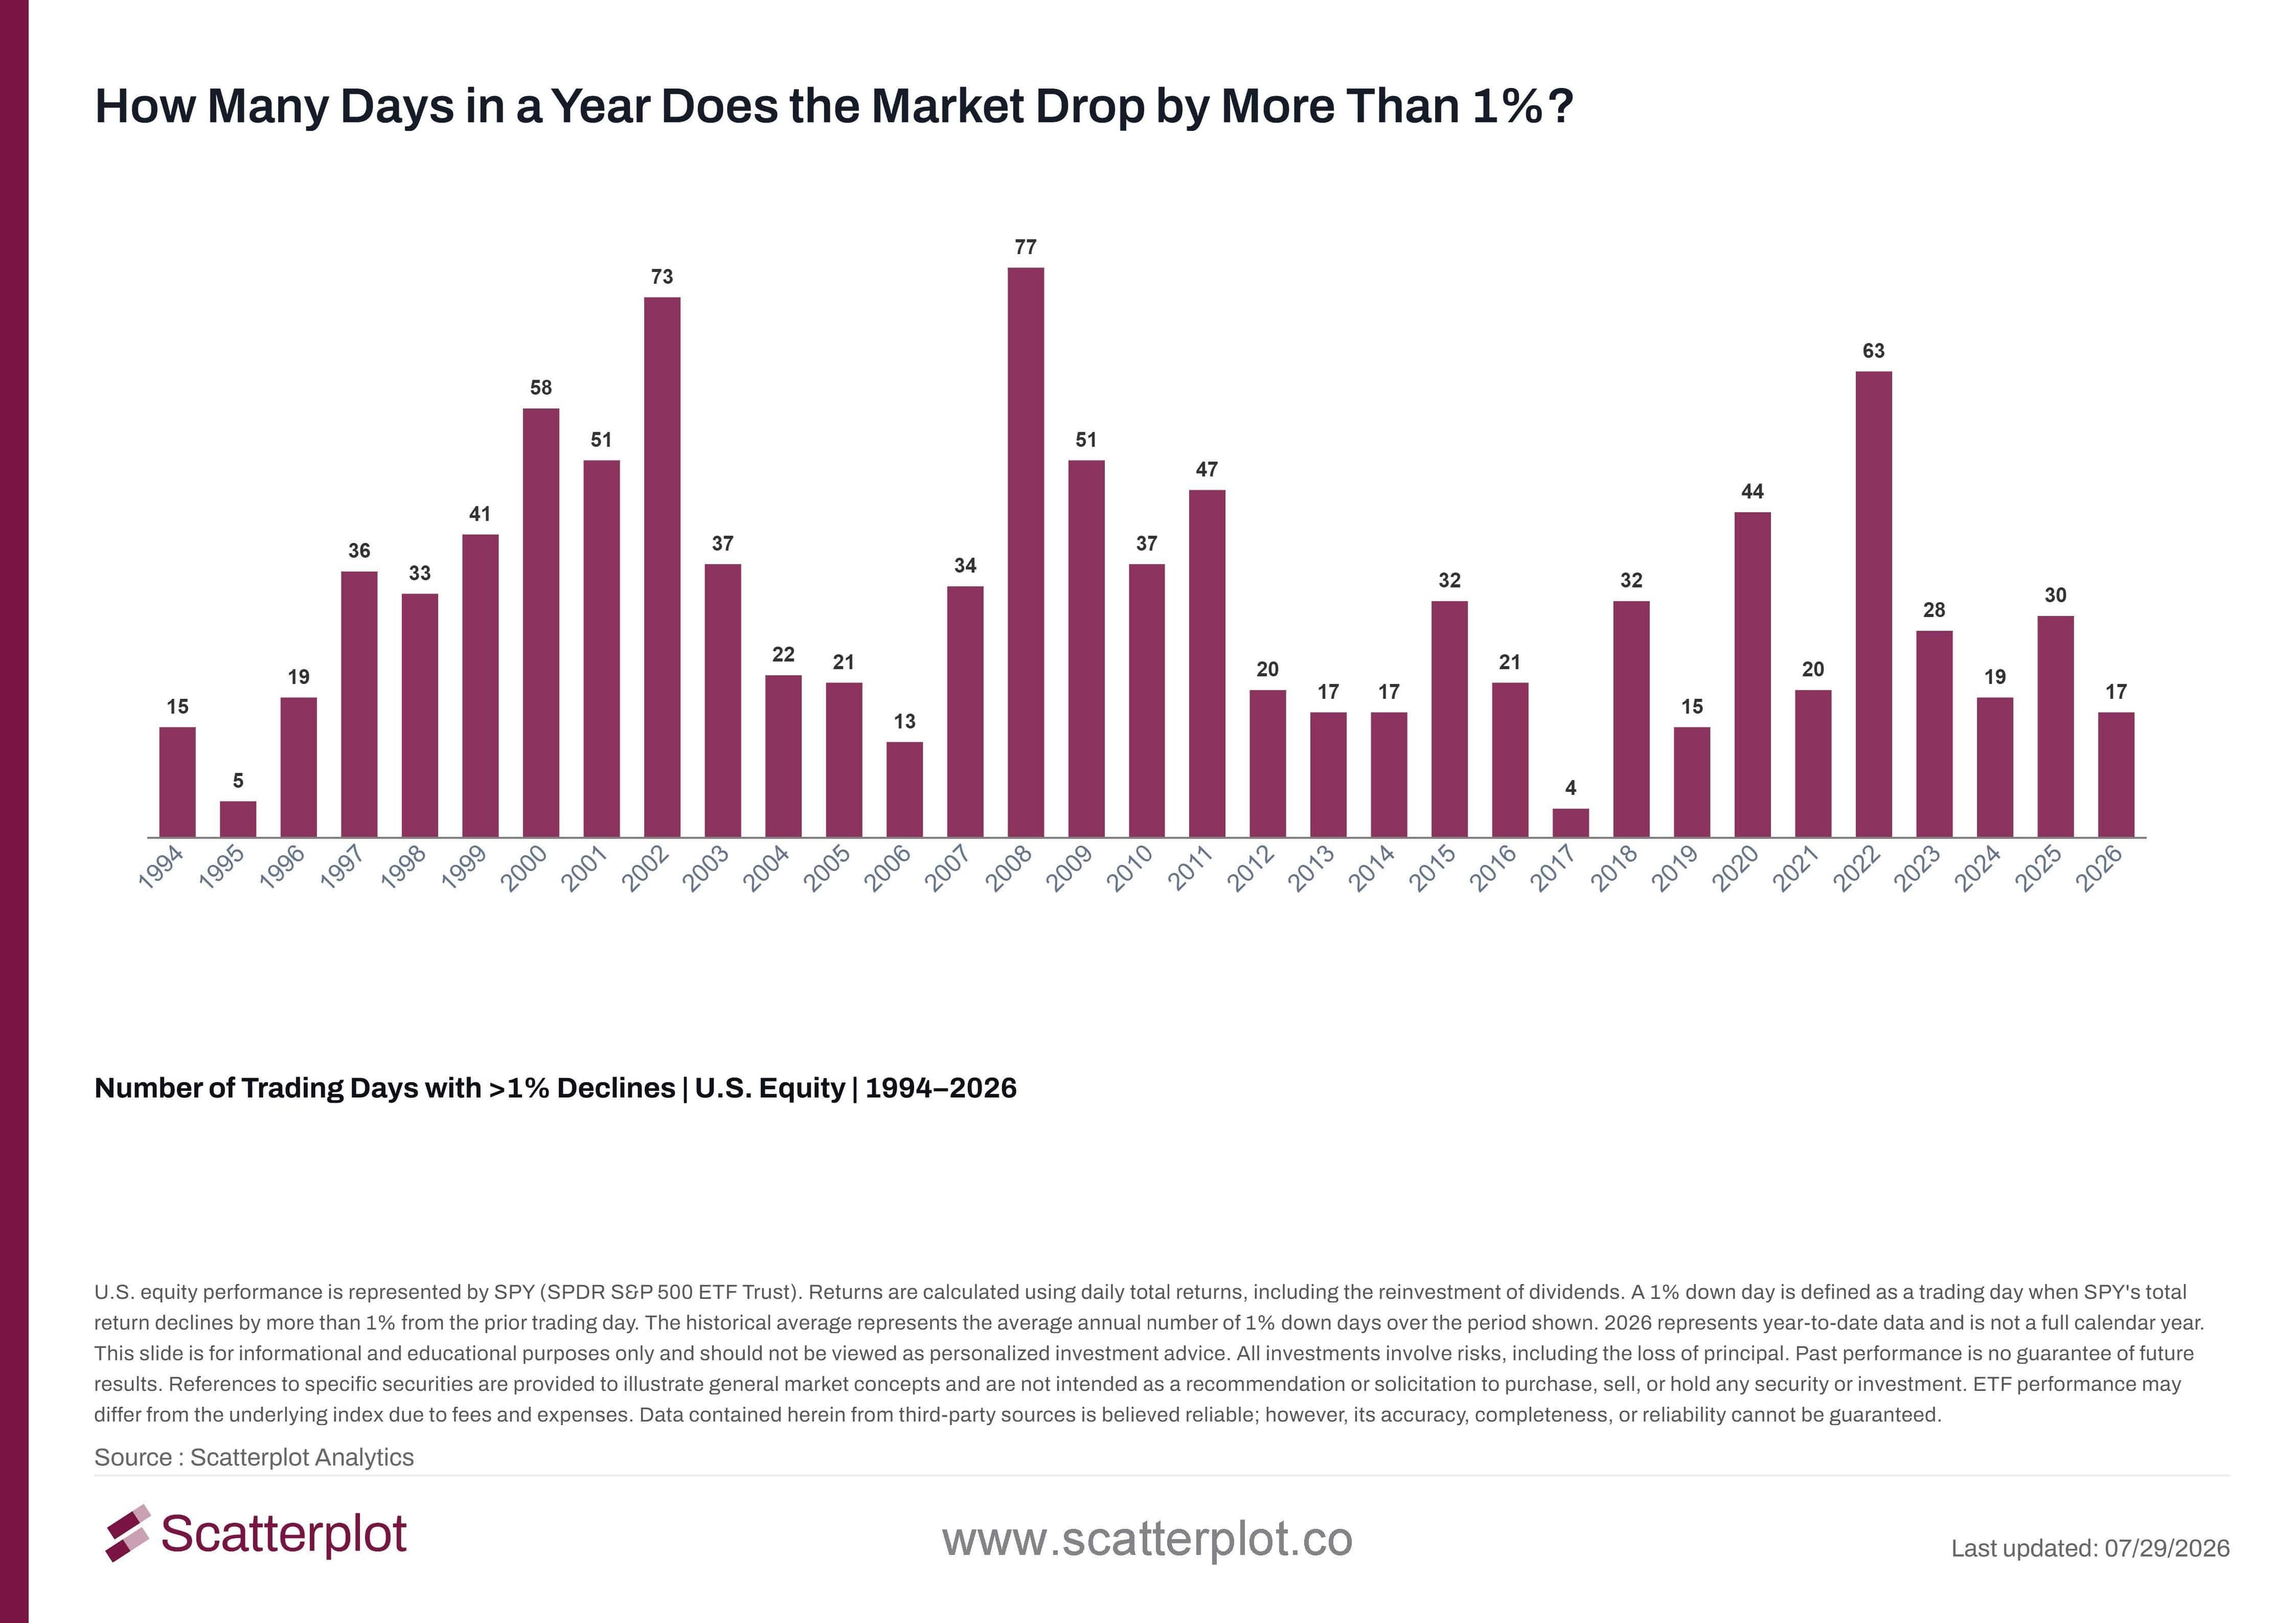
This chart updates daily. Track it live at scatterplot.co
1% Down Days in 2026
Here's what that looks like on an actual price chart, using this year as an example:
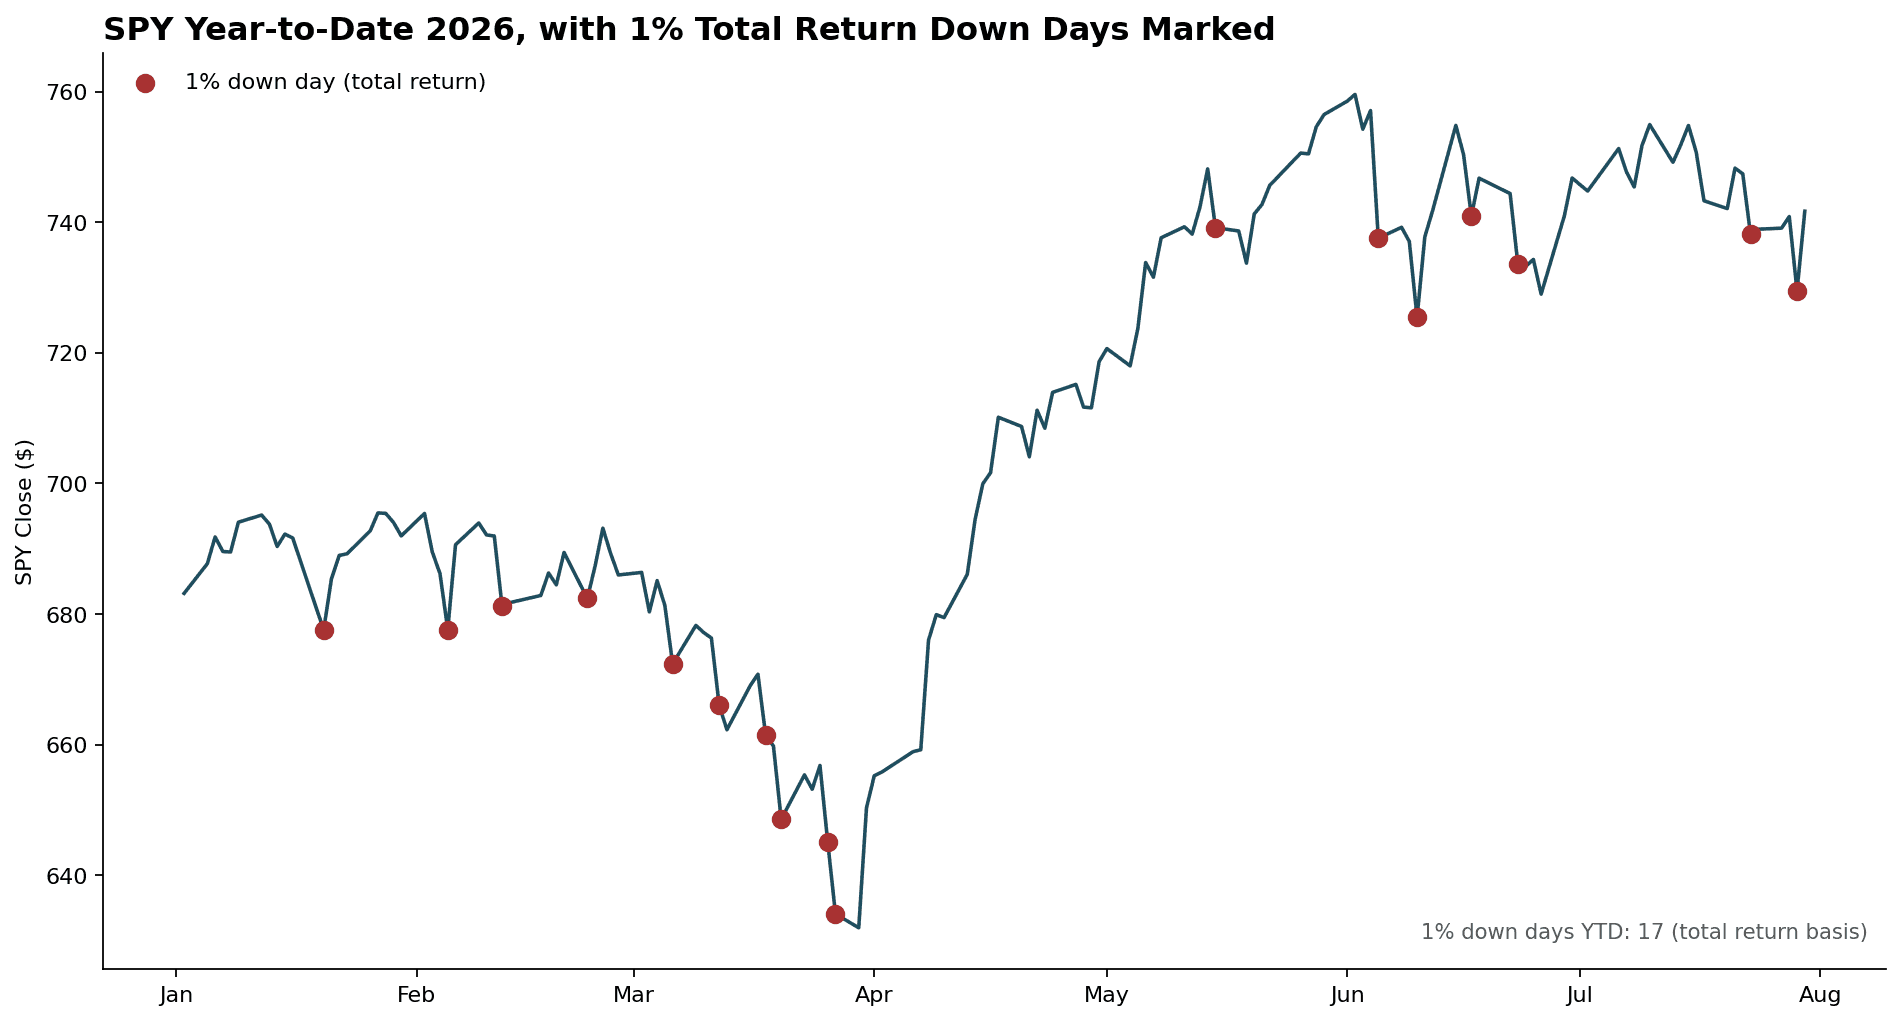
2026 has had 17 days closing down more than 1% (total return basis) so far. You can see those days aren't spread out evenly, they show up in a couple of identifiable stretches rather than scattered randomly across the calendar.
What Does the Average Actually Hide?
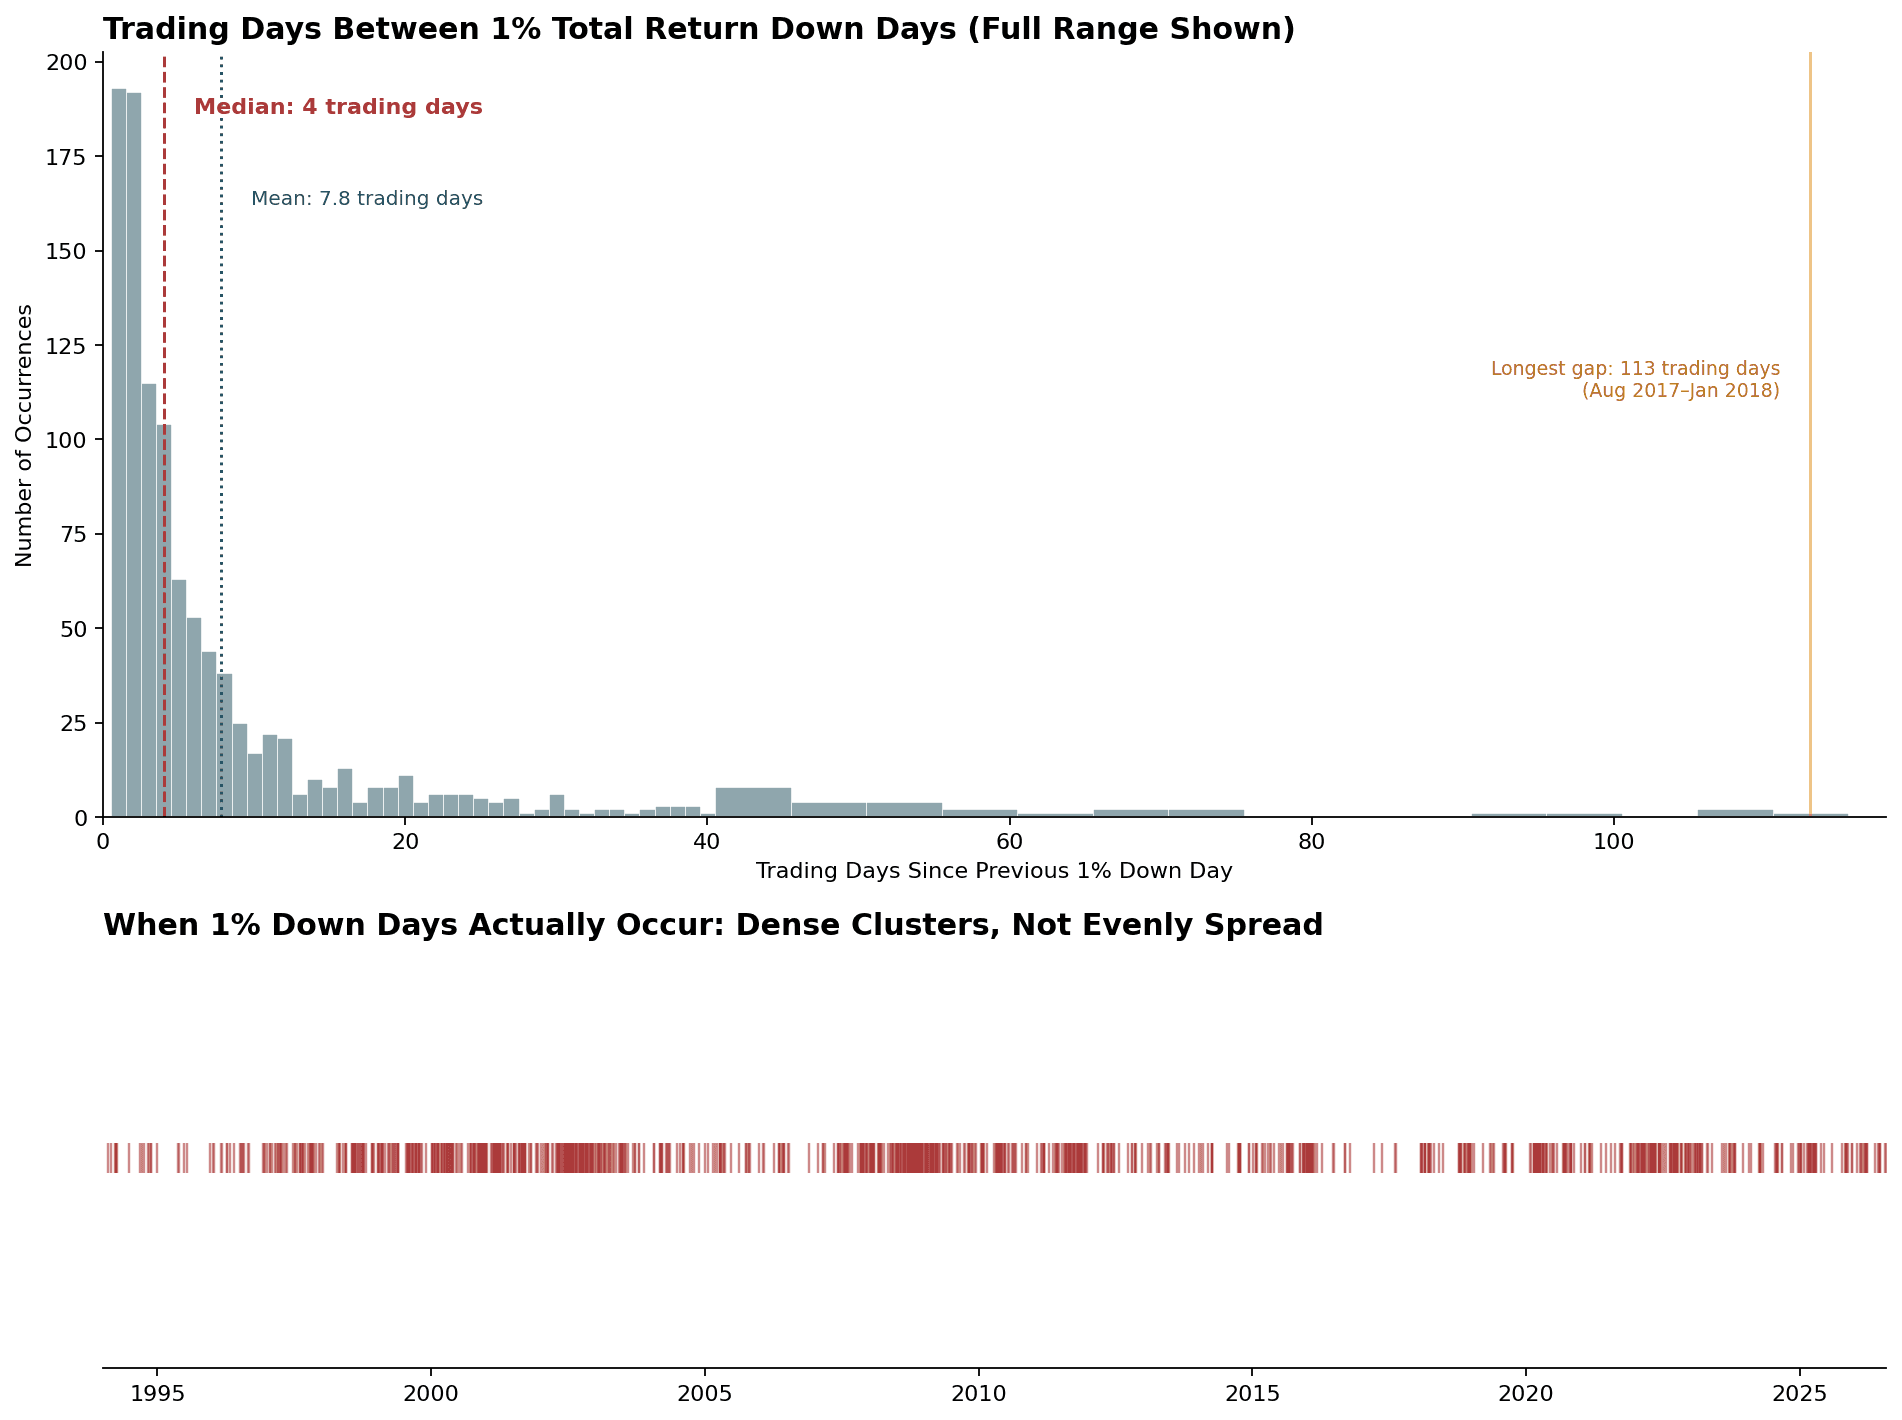
An average is just one number standing in for a whole distribution. We looked at the actual gap, in trading days, between every 1% down day going back to 1994. Here's what we found:
- Median gap: 4 trading days. More than half the time, another 1% down day shows up within five trading days.
- 18.4% happen back to back, the very next trading day after the last one.
- Nearly two-thirds (63.6%) of 1% down days have been followed by another within five trading days.
- 91.5% happen within 21 trading days, roughly one month.
- The longest gap in the dataset was 113 trading days (about 5.5 months), running from mid-August 2017 to late January 2018, the calmest stretch since 1994.
The mean (7.8 trading days) sits well above the median (4 trading days) because a handful of unusually long calm stretches drag the average up. That's the sign of a skewed distribution. It's also a sign of volatility clustering, a well-documented pattern where big moves tend to follow big moves, and calm periods tend to follow calm periods, rather than being spread out evenly over time.
Do Clusters of Down Days Tend to Fade?
We define a cluster as two or more 1% down days in which each successive event occurs no more than 15 trading days after the previous one. That 15-day window is our own analytical choice, not an industry-standard definition, so it's worth naming as a convention rather than a fixed rule. Cluster returns are measured from the trading day immediately before the first 1% down day through the final 1% down day in the cluster. Forward returns are measured from that final event over the next 63 and 126 trading days, roughly three and six months. Recovery means SPY's total return level was back above its pre-cluster level 63 trading days after the final event.
From 1994 to 2026, there have been 95 such clusters. The average return from the start of a cluster through its final 1% down day was -4.7%. The average subsequent return was +7.3% over the next 63 trading days and +10.2% over the next 126 trading days, compared with average forward returns of +2.9% and +5.9%, respectively, across all eligible trading days in the sample. Forward-return averages include 93 clusters at the 63-trading-day horizon and 92 clusters at the 126-trading-day horizon; the most recent clusters don't yet have enough subsequent history and are excluded. Three months after the cluster ended, 71% of clusters had recovered their entire decline and SPY was back above its pre-cluster level.
That's a historical tendency based on 32 years of data, not a guarantee about what happens after any specific cluster, including the current cluster, which contains two 1% down days in late July, too recent to classify one way or the other.
Why Does This Matter More Than the Headline Number?
This year, the market has dropped more than 1% in a day 17 times so far. (This chart updates daily on our portal, so you can see this number update in real time.)
Historically, a decline of more than 1% has occurred about once every eight trading days, so on its own, this isn't unusual.
Nearly two-thirds of 1% down days have historically been followed by another within five trading days, which means a stretch of several rough days close together is consistent with the historical pattern rather than unusual relative to it.
The historical frequency and clustering pattern described above provide useful context for interpreting a rough stretch, but they don't indicate whether markets will move higher or lower from here.
FAQ
How often does the stock market drop more than 1% in a day?
Historically, about 1 in every 8 trading days, or roughly 32 times per year, based on SPY total return data from January 1994 through July 2026.
Do big down days happen randomly throughout the year, or do they cluster?
Historically, they cluster. The median gap between 1% down days is just 4 trading days, and nearly two-thirds occur within five trading days of the previous one. Long calm stretches between clusters are what pull the average gap up to 8 days.
Why do large market moves cluster together?
This is known as volatility clustering, a well-documented pattern where periods of large price swings tend to follow other periods of large swings, and calm periods tend to follow calm periods, rather than volatility being evenly distributed over time.
Do clusters of down days tend to recover?
Historically, yes, more often than not. Across 95 clusters of two or more 1% down days since 1994, the average return was +7.3% over the following 63 trading days and +10.2% over the following 126 trading days, both above the market's average forward return from all trading days over the same periods (+2.9% and +5.9%). Three months after a cluster ended, SPY had recovered its entire decline in 71% of cases. This is a historical tendency, not a predictive signal for any individual cluster.
Disclosure
This content is provided for informational and educational purposes only and should not be relied upon as investment advice. No representation is made that any investment strategy or market view will be successful. Past performance is not indicative of future results. All investing involves risk, including the loss of principal. Please refer to our Terms and Conditions for more information.


Enjoyed this? Get more in your inbox.
Weekly insights for advisors
— charts, research, and practical tools. No fluff.
Investment Foundations
Fed Rate Hikes Since 1994: What Happened in Each Cycle
Inflation, unemployment and equity returns across seven Fed rate-hike episodes since 1994, each with its start, end and accompanying FOMC statement.
Read moreSanjeev Pati, CFA
September 21, 2026 · 10 min read
Market Insights
September 2026 Market Update: Oil Up, Gold and Long-Term Treasuries Down Since the Iran Conflict
September 2026 market update: U.S. stocks sit 2.6% below their August high, and gold and long-term Treasuries are down since the Iran conflict. 10 charts.
Read moreSanjeev Pati, CFA
September 11, 2026 · 10 min read