

September 2026 Market Recap: The Fed Raises Rates and the 10-Year Treasury Yield Hits Its Highest Since 2002
A recap of the main market events of September 2026, in 13 charts.

Sanjeev Pati, CFA
Founder, Scatterplot
Data as of September 30, 2026
Introduction
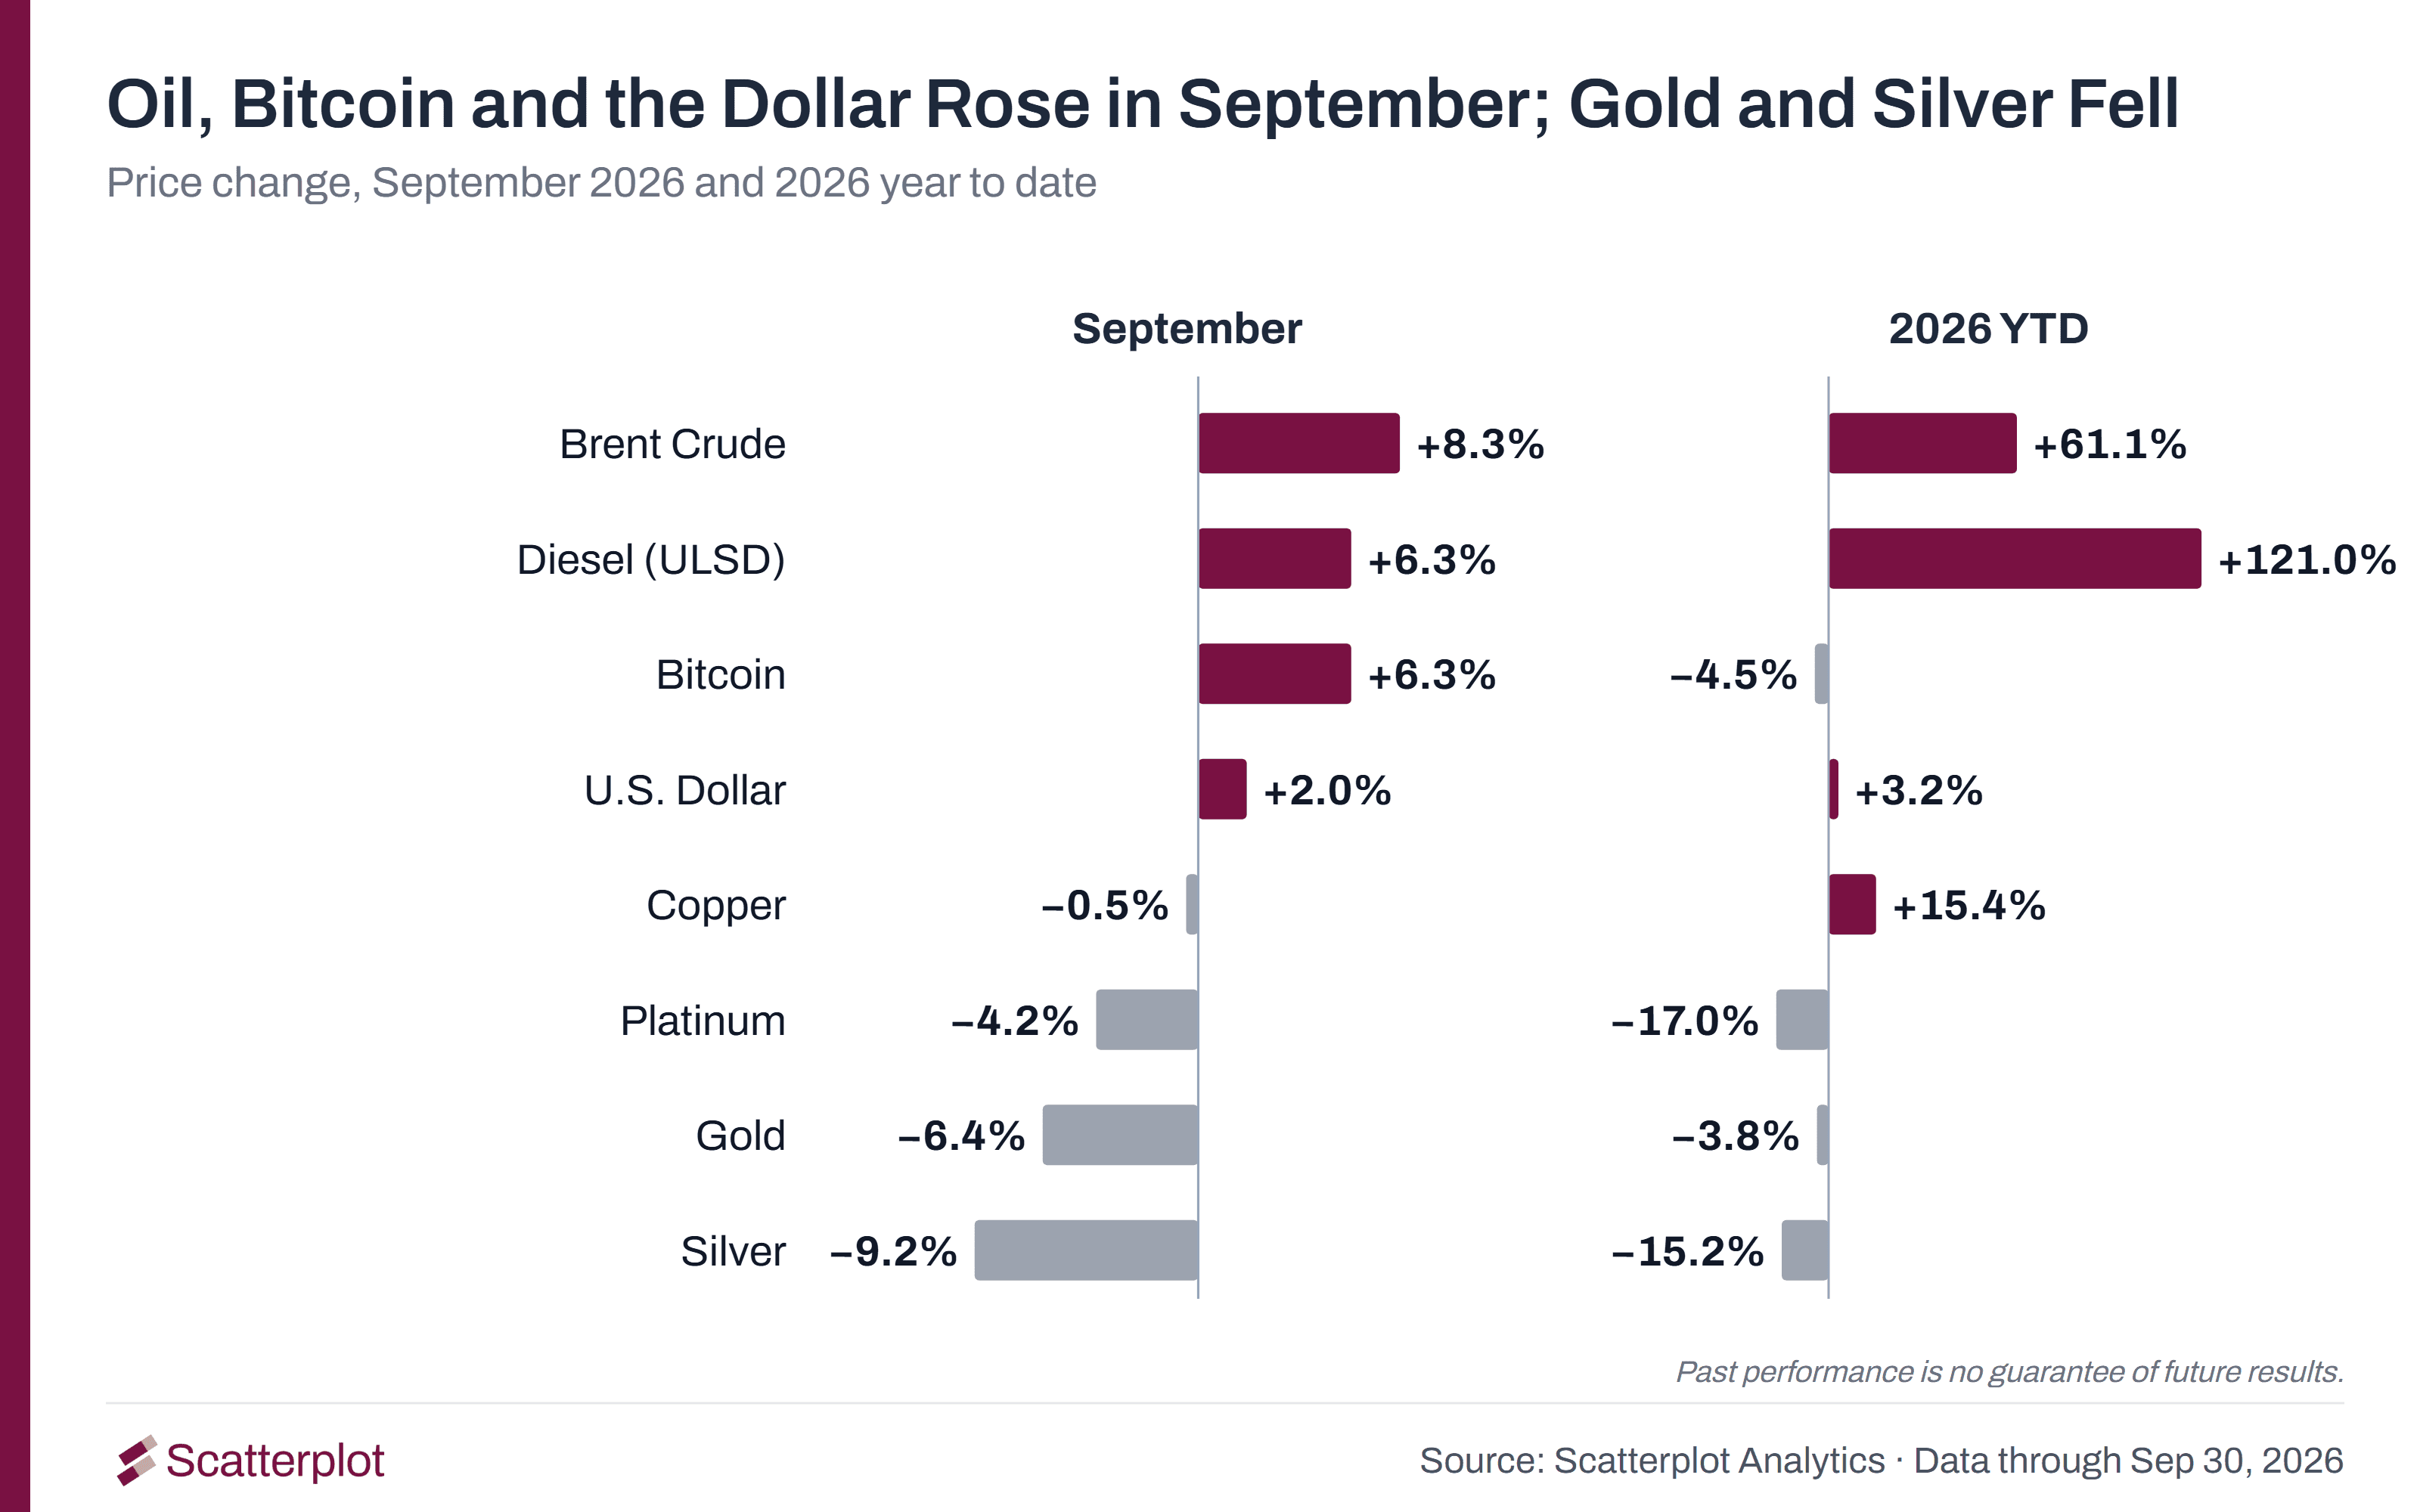
This September 2026 market recap covers the main market events of the month. The Federal Reserve raised interest rates for the first time since 2023, and the 10-year Treasury yield had its highest close since 2002. U.S. stocks returned −0.3% for the month, with technology the only sector to rise. Oil, the U.S. dollar and Bitcoin rose, and gold fell.
Key takeaways
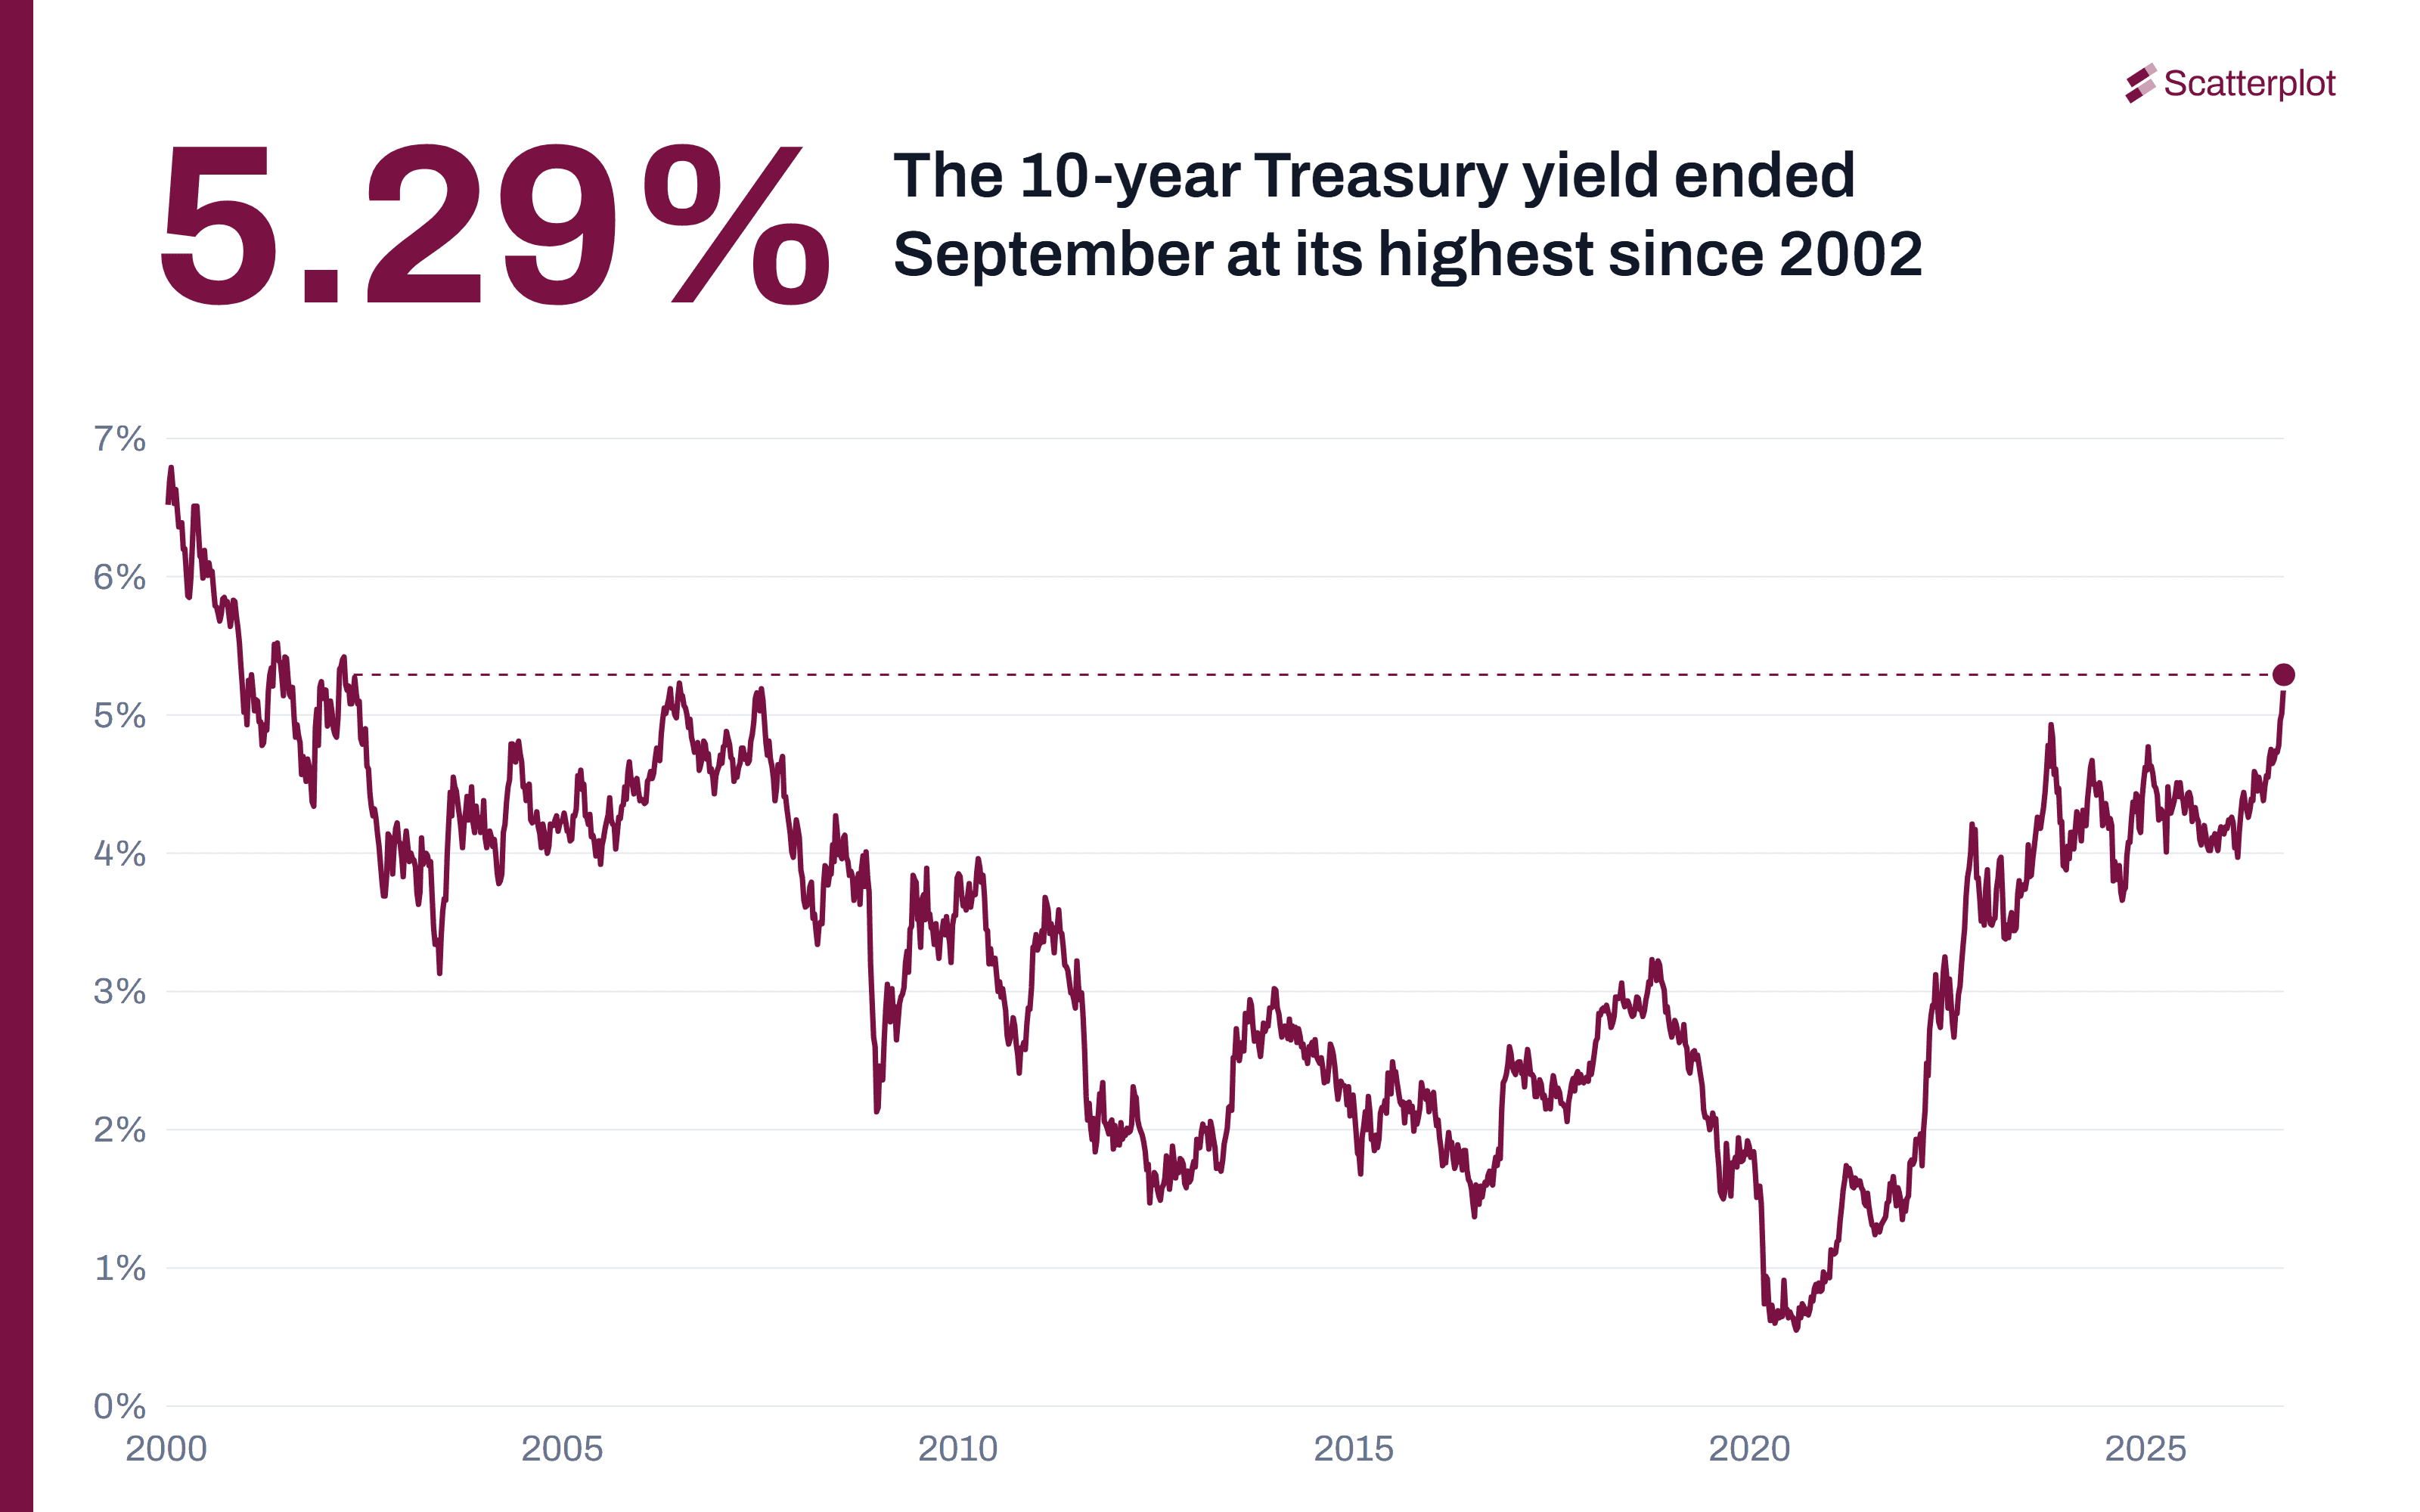
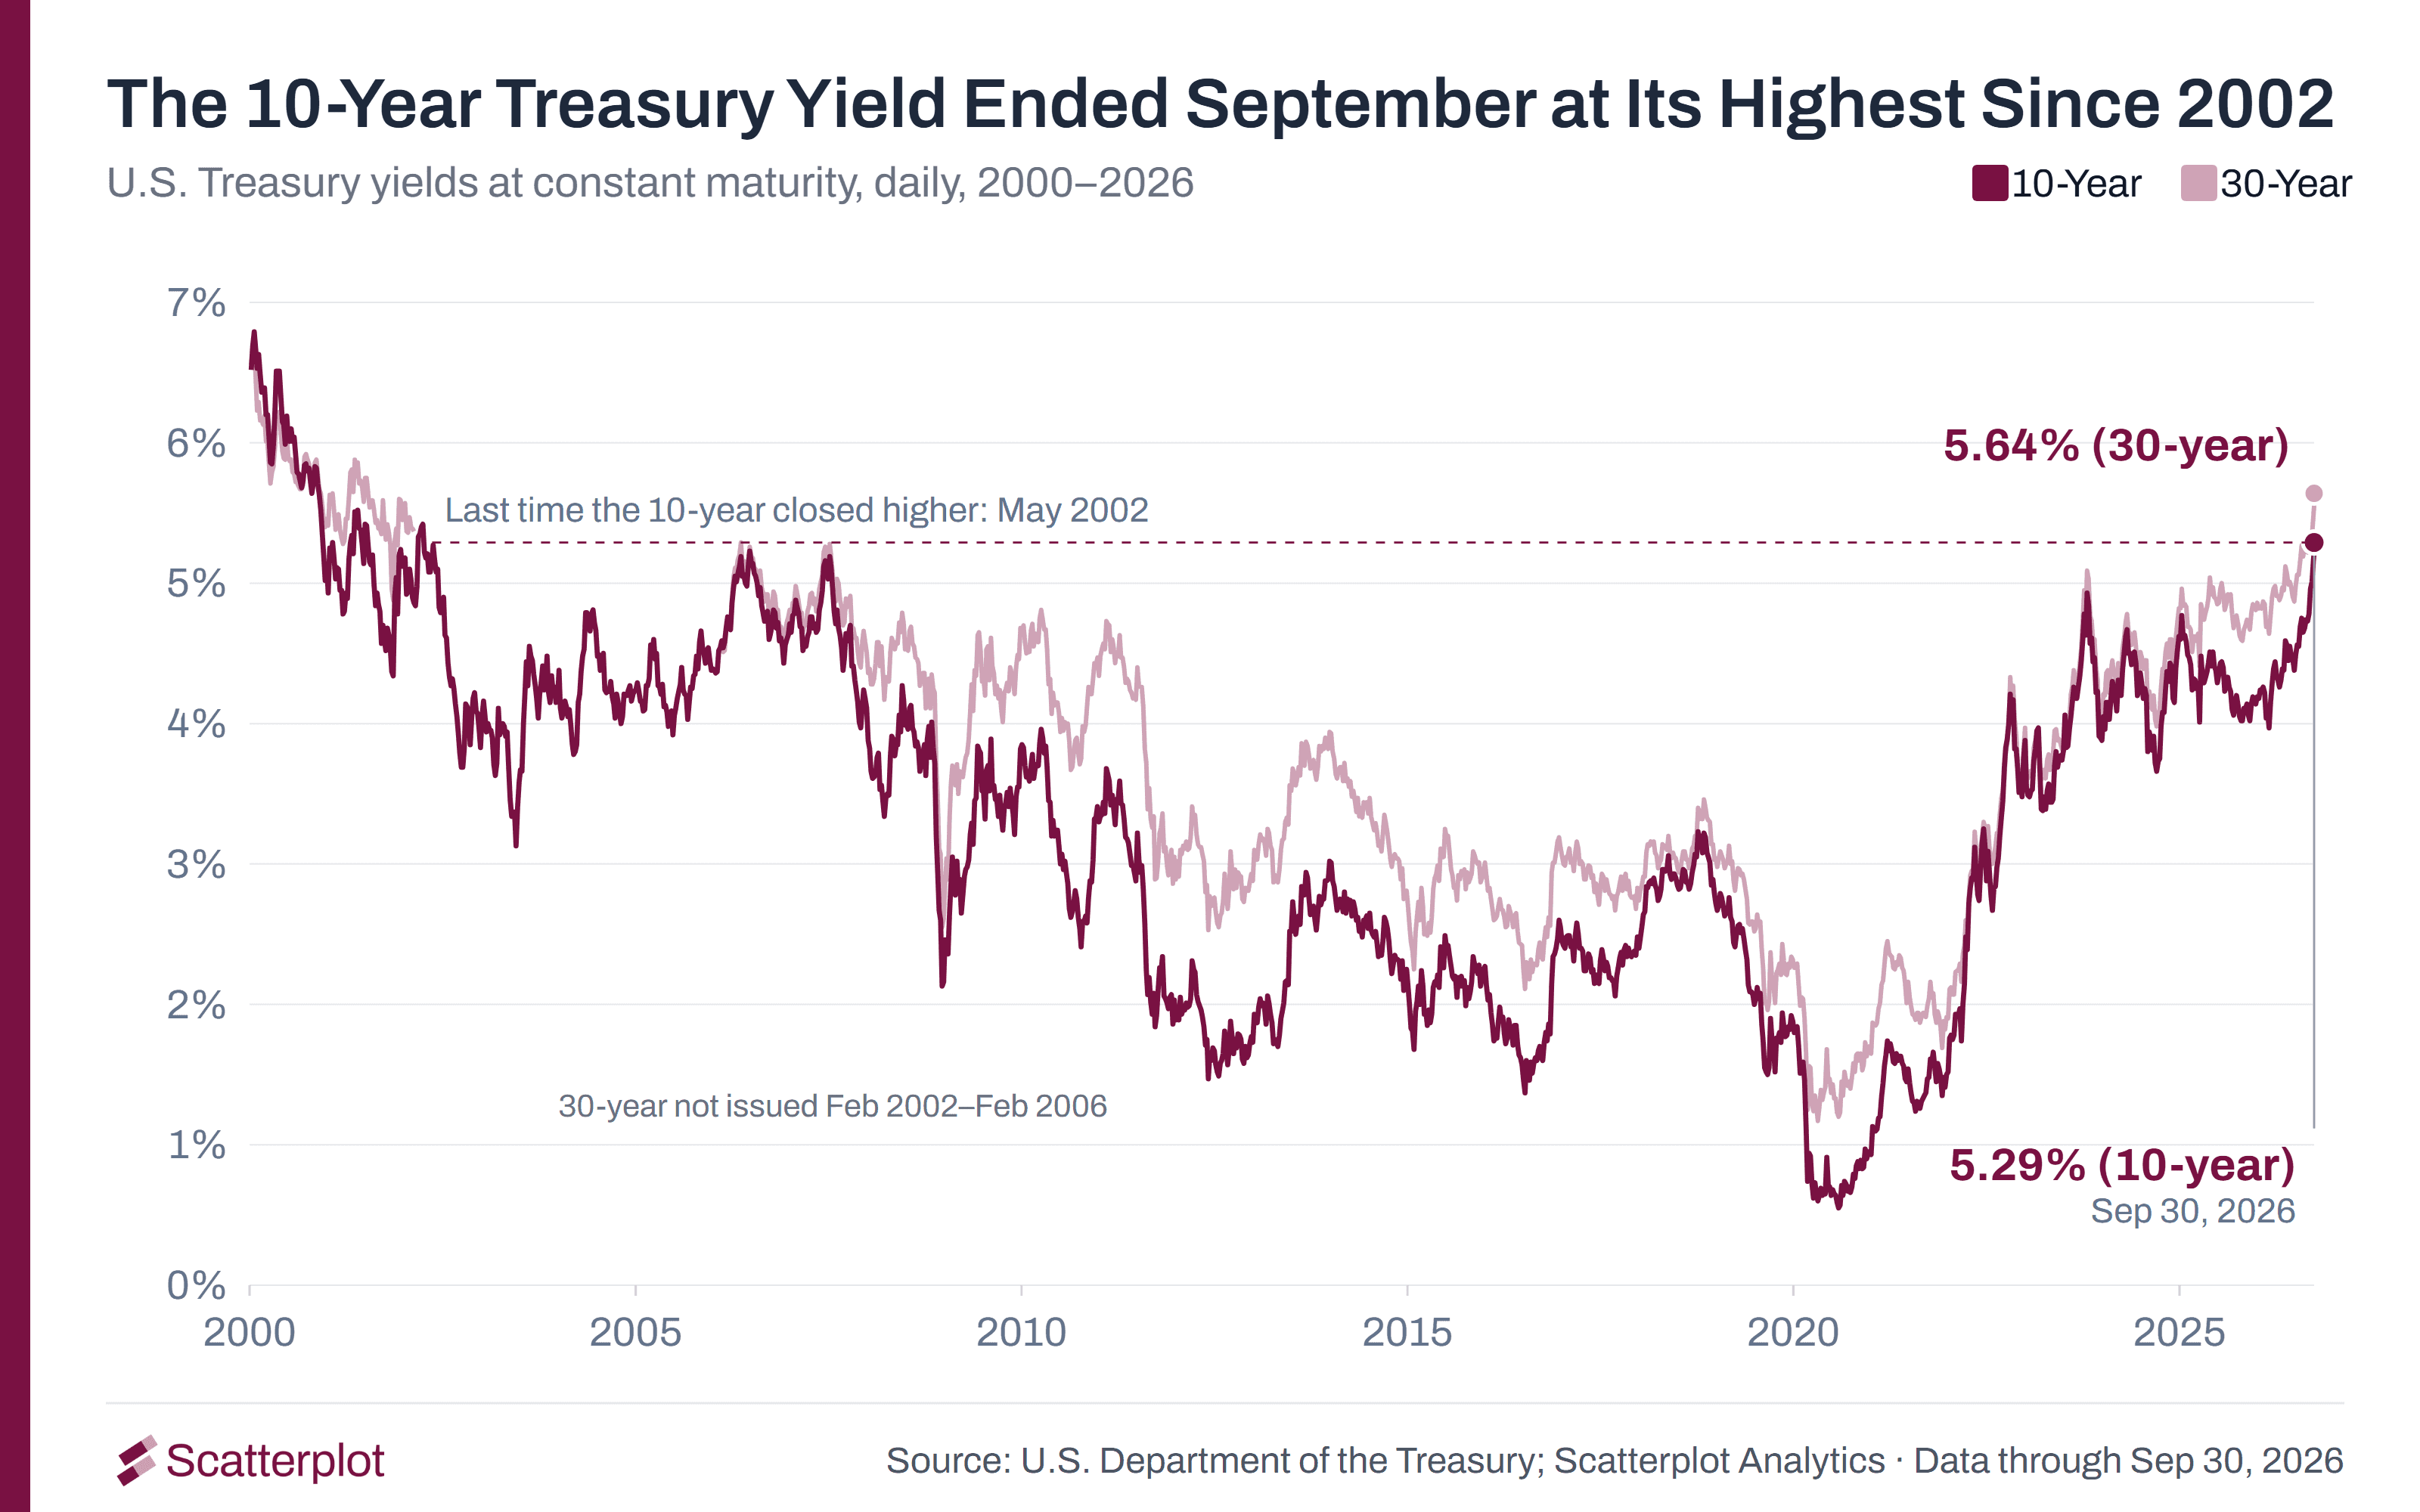
- The 10-year Treasury yield closed September at 5.29%, its highest close since May 2002.
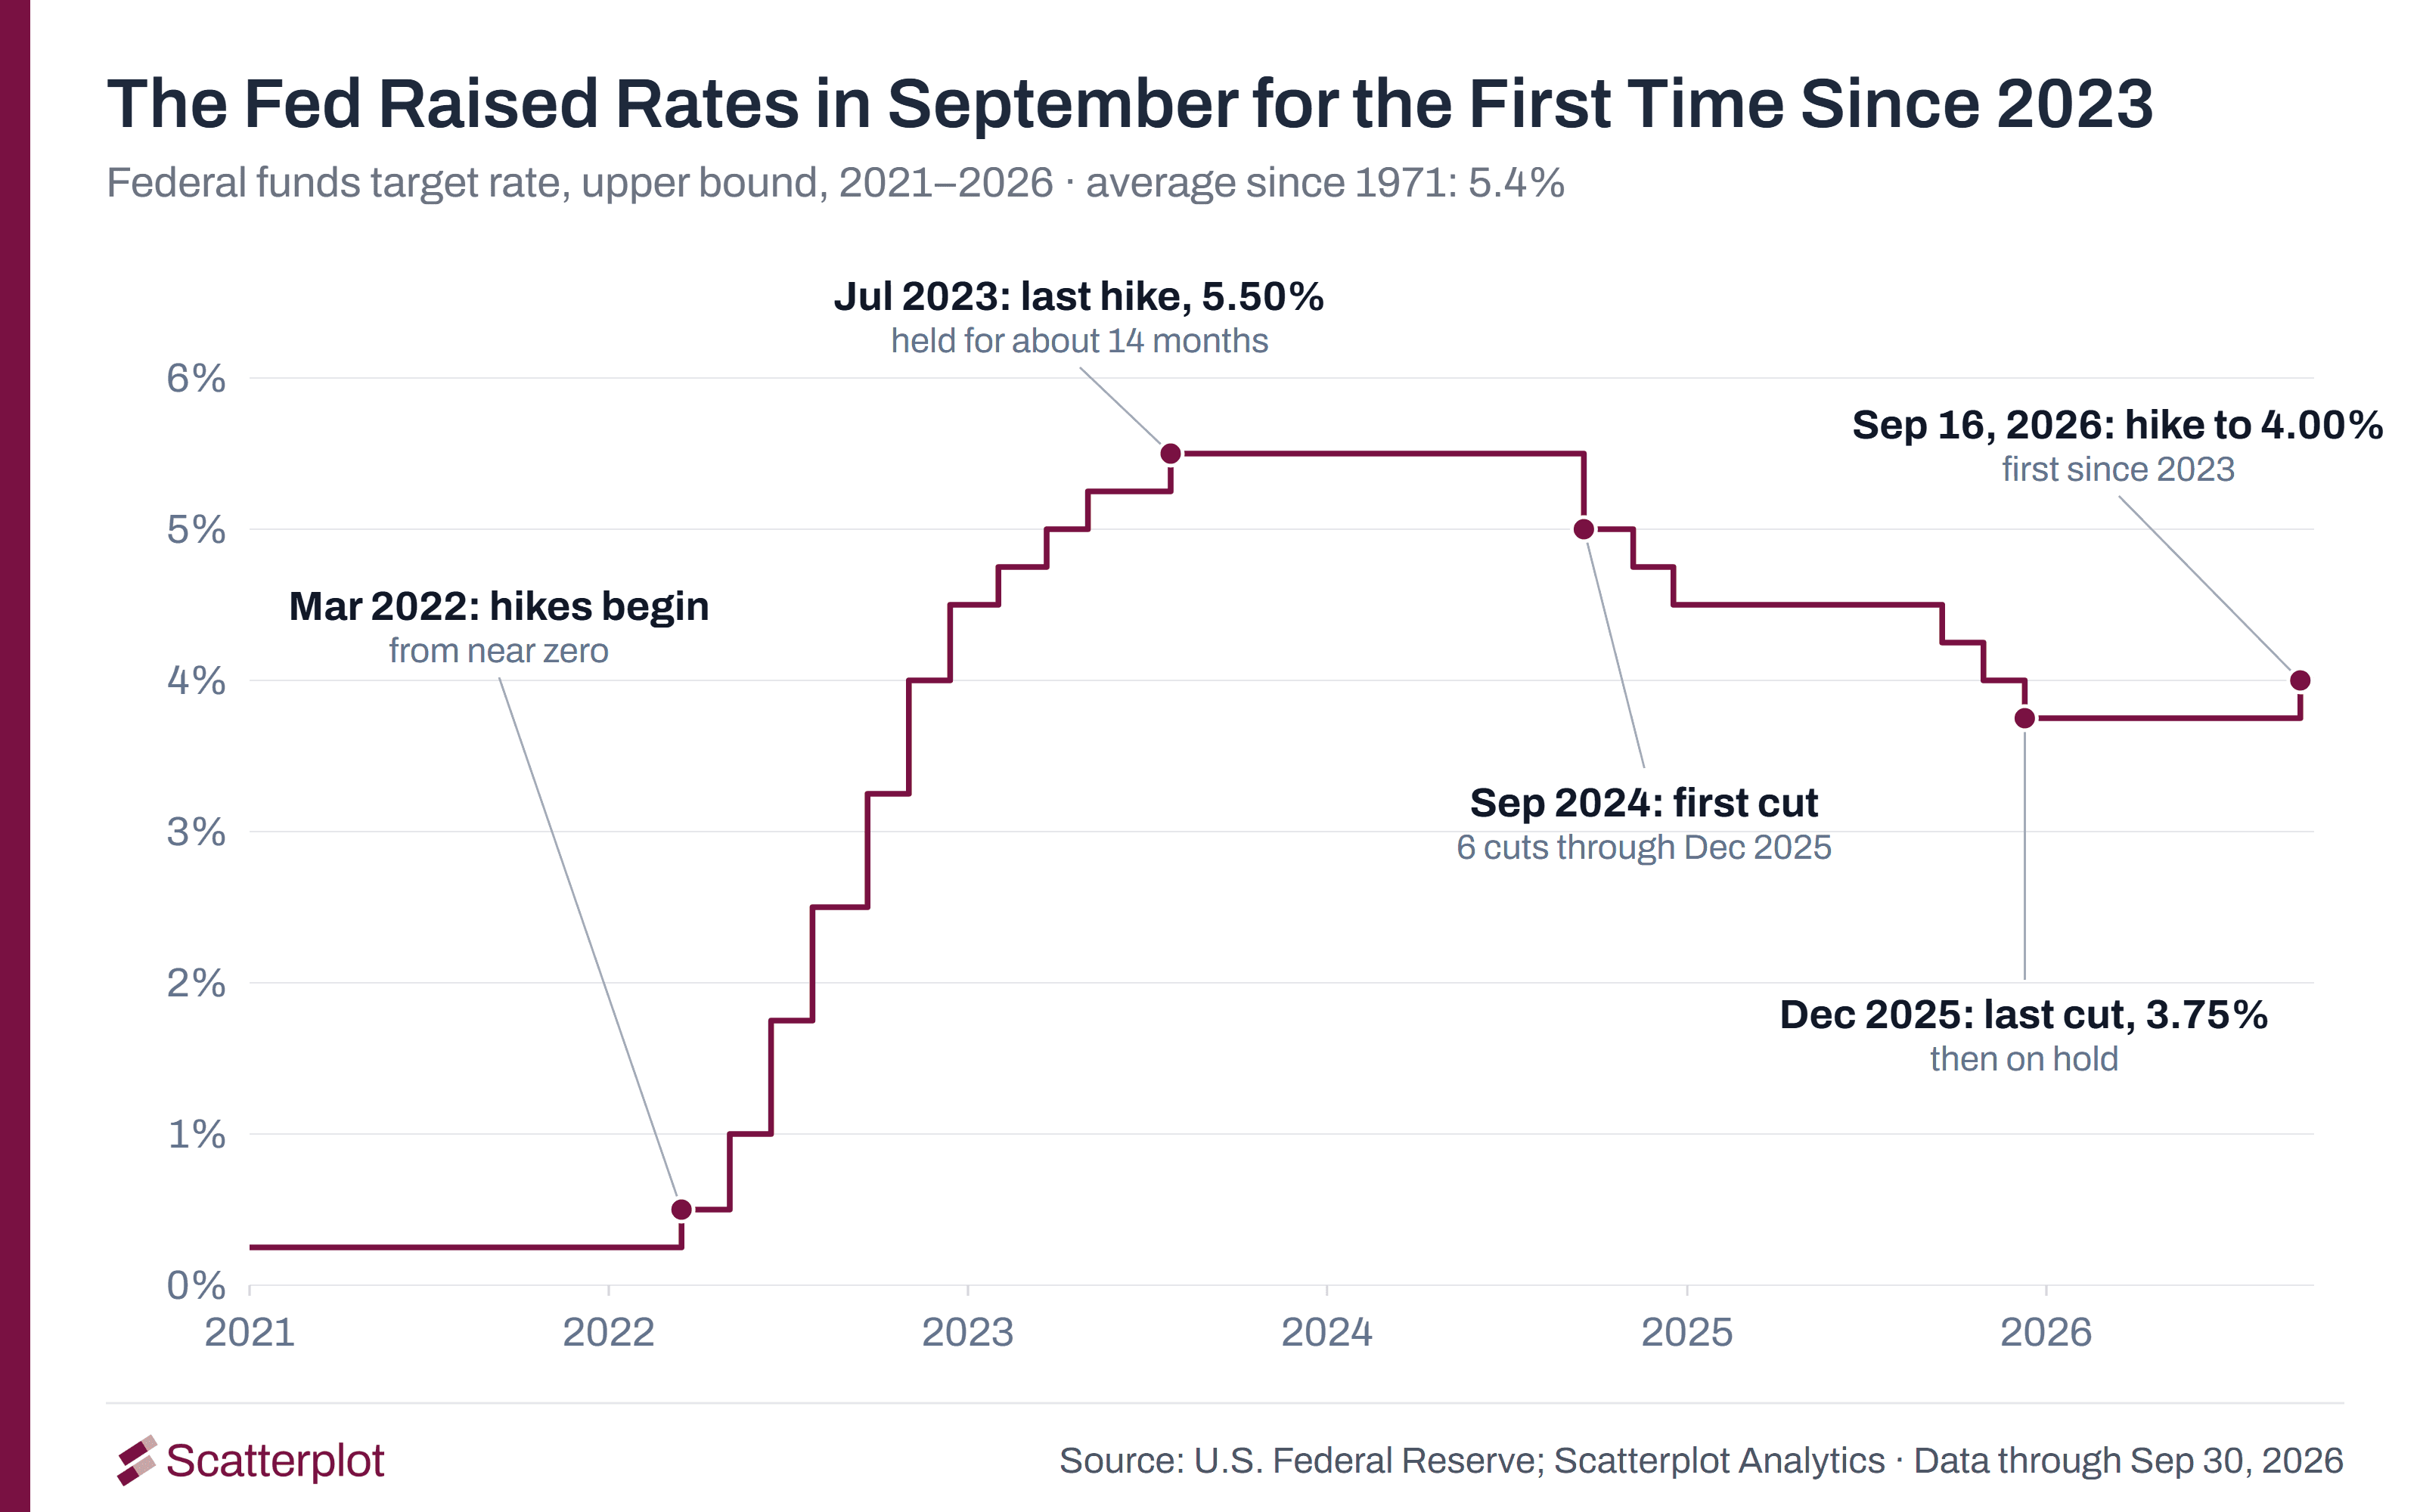
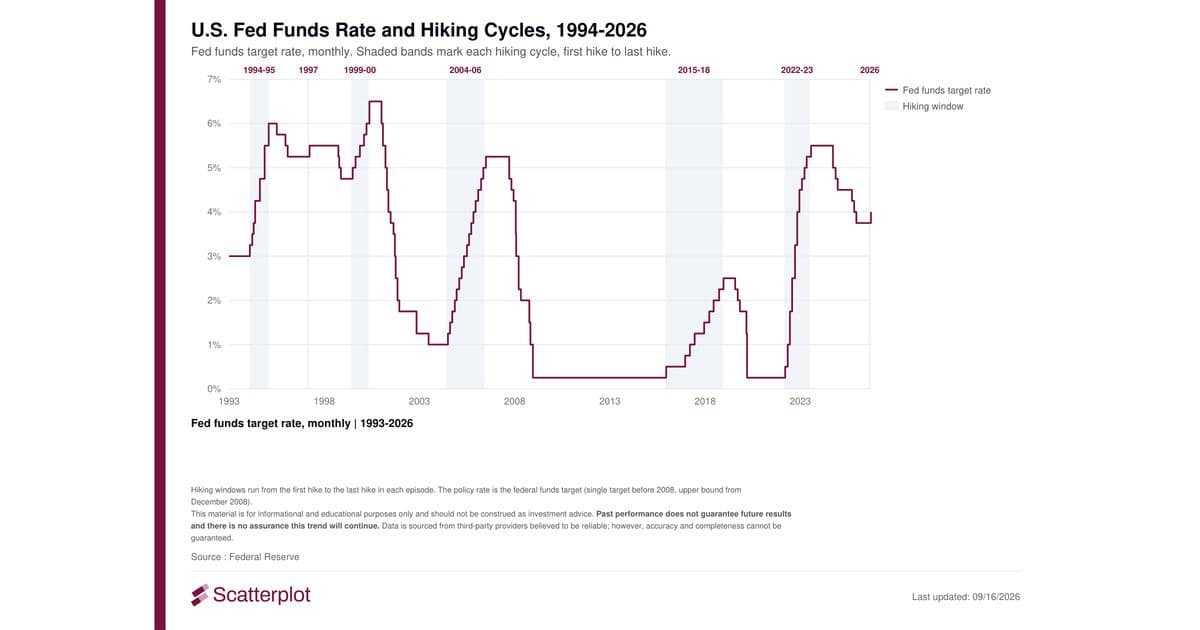
- The Fed raised its target range to 3.75%–4.00% on September 16, its first increase since July 2023.
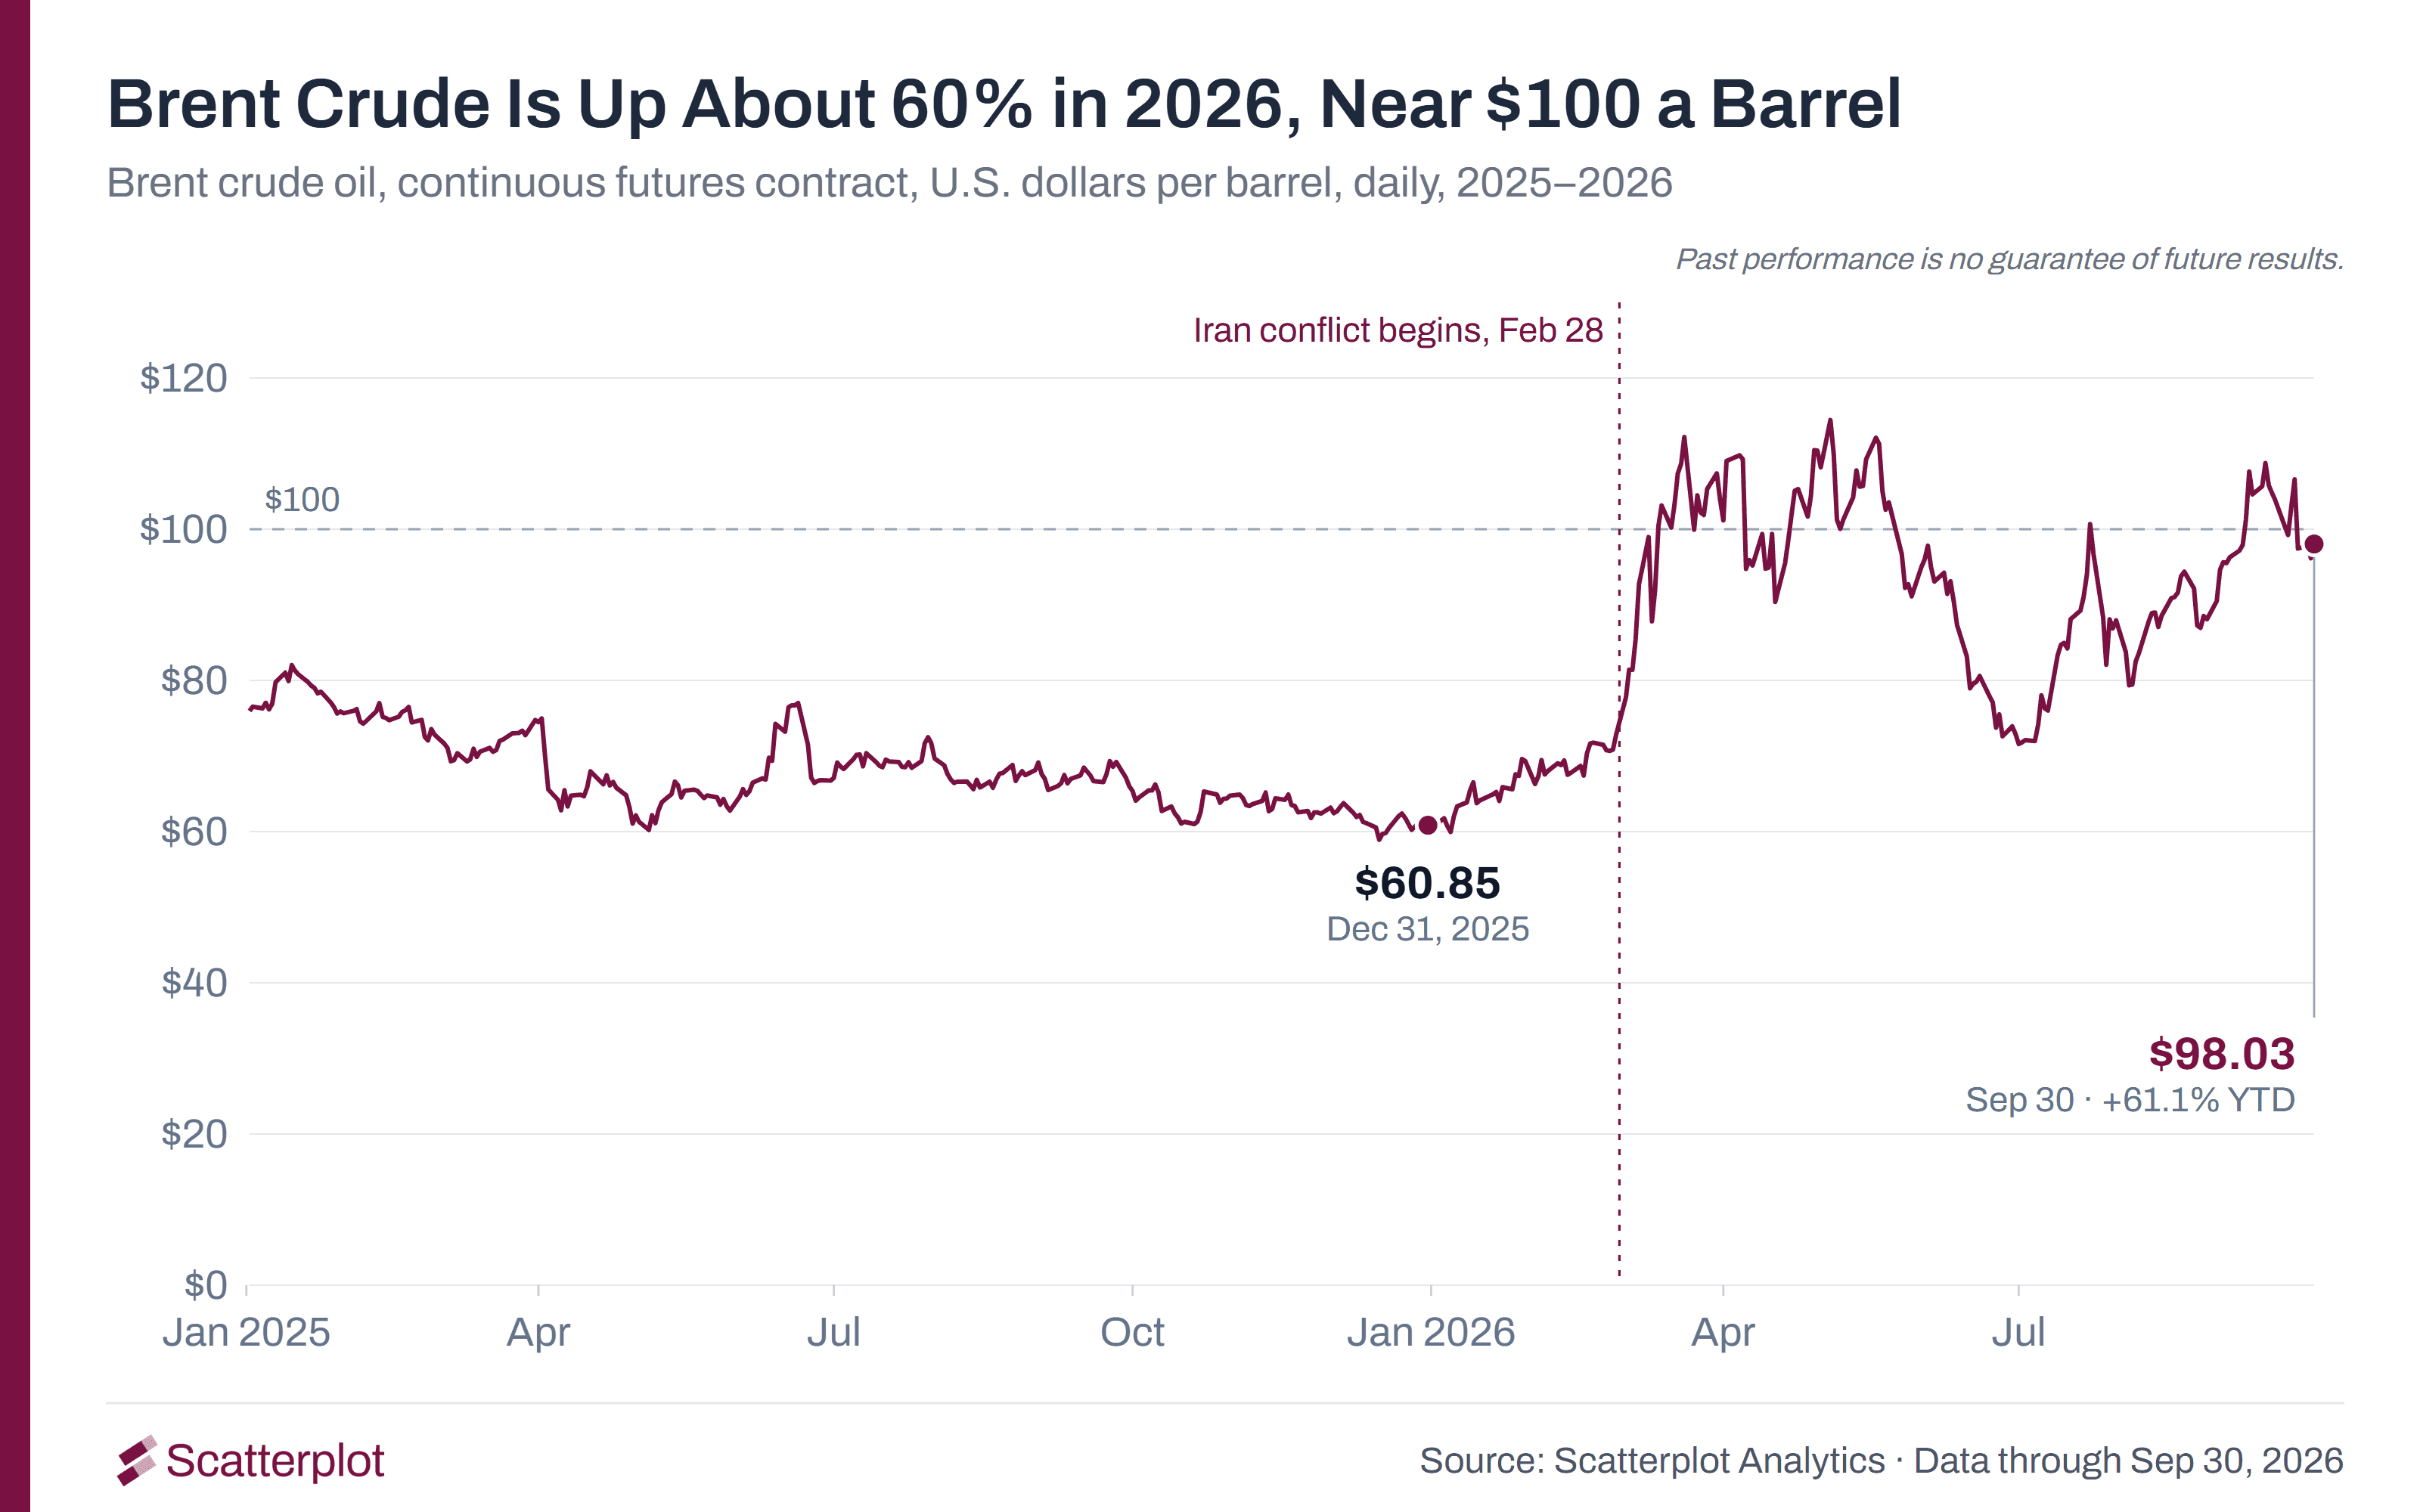
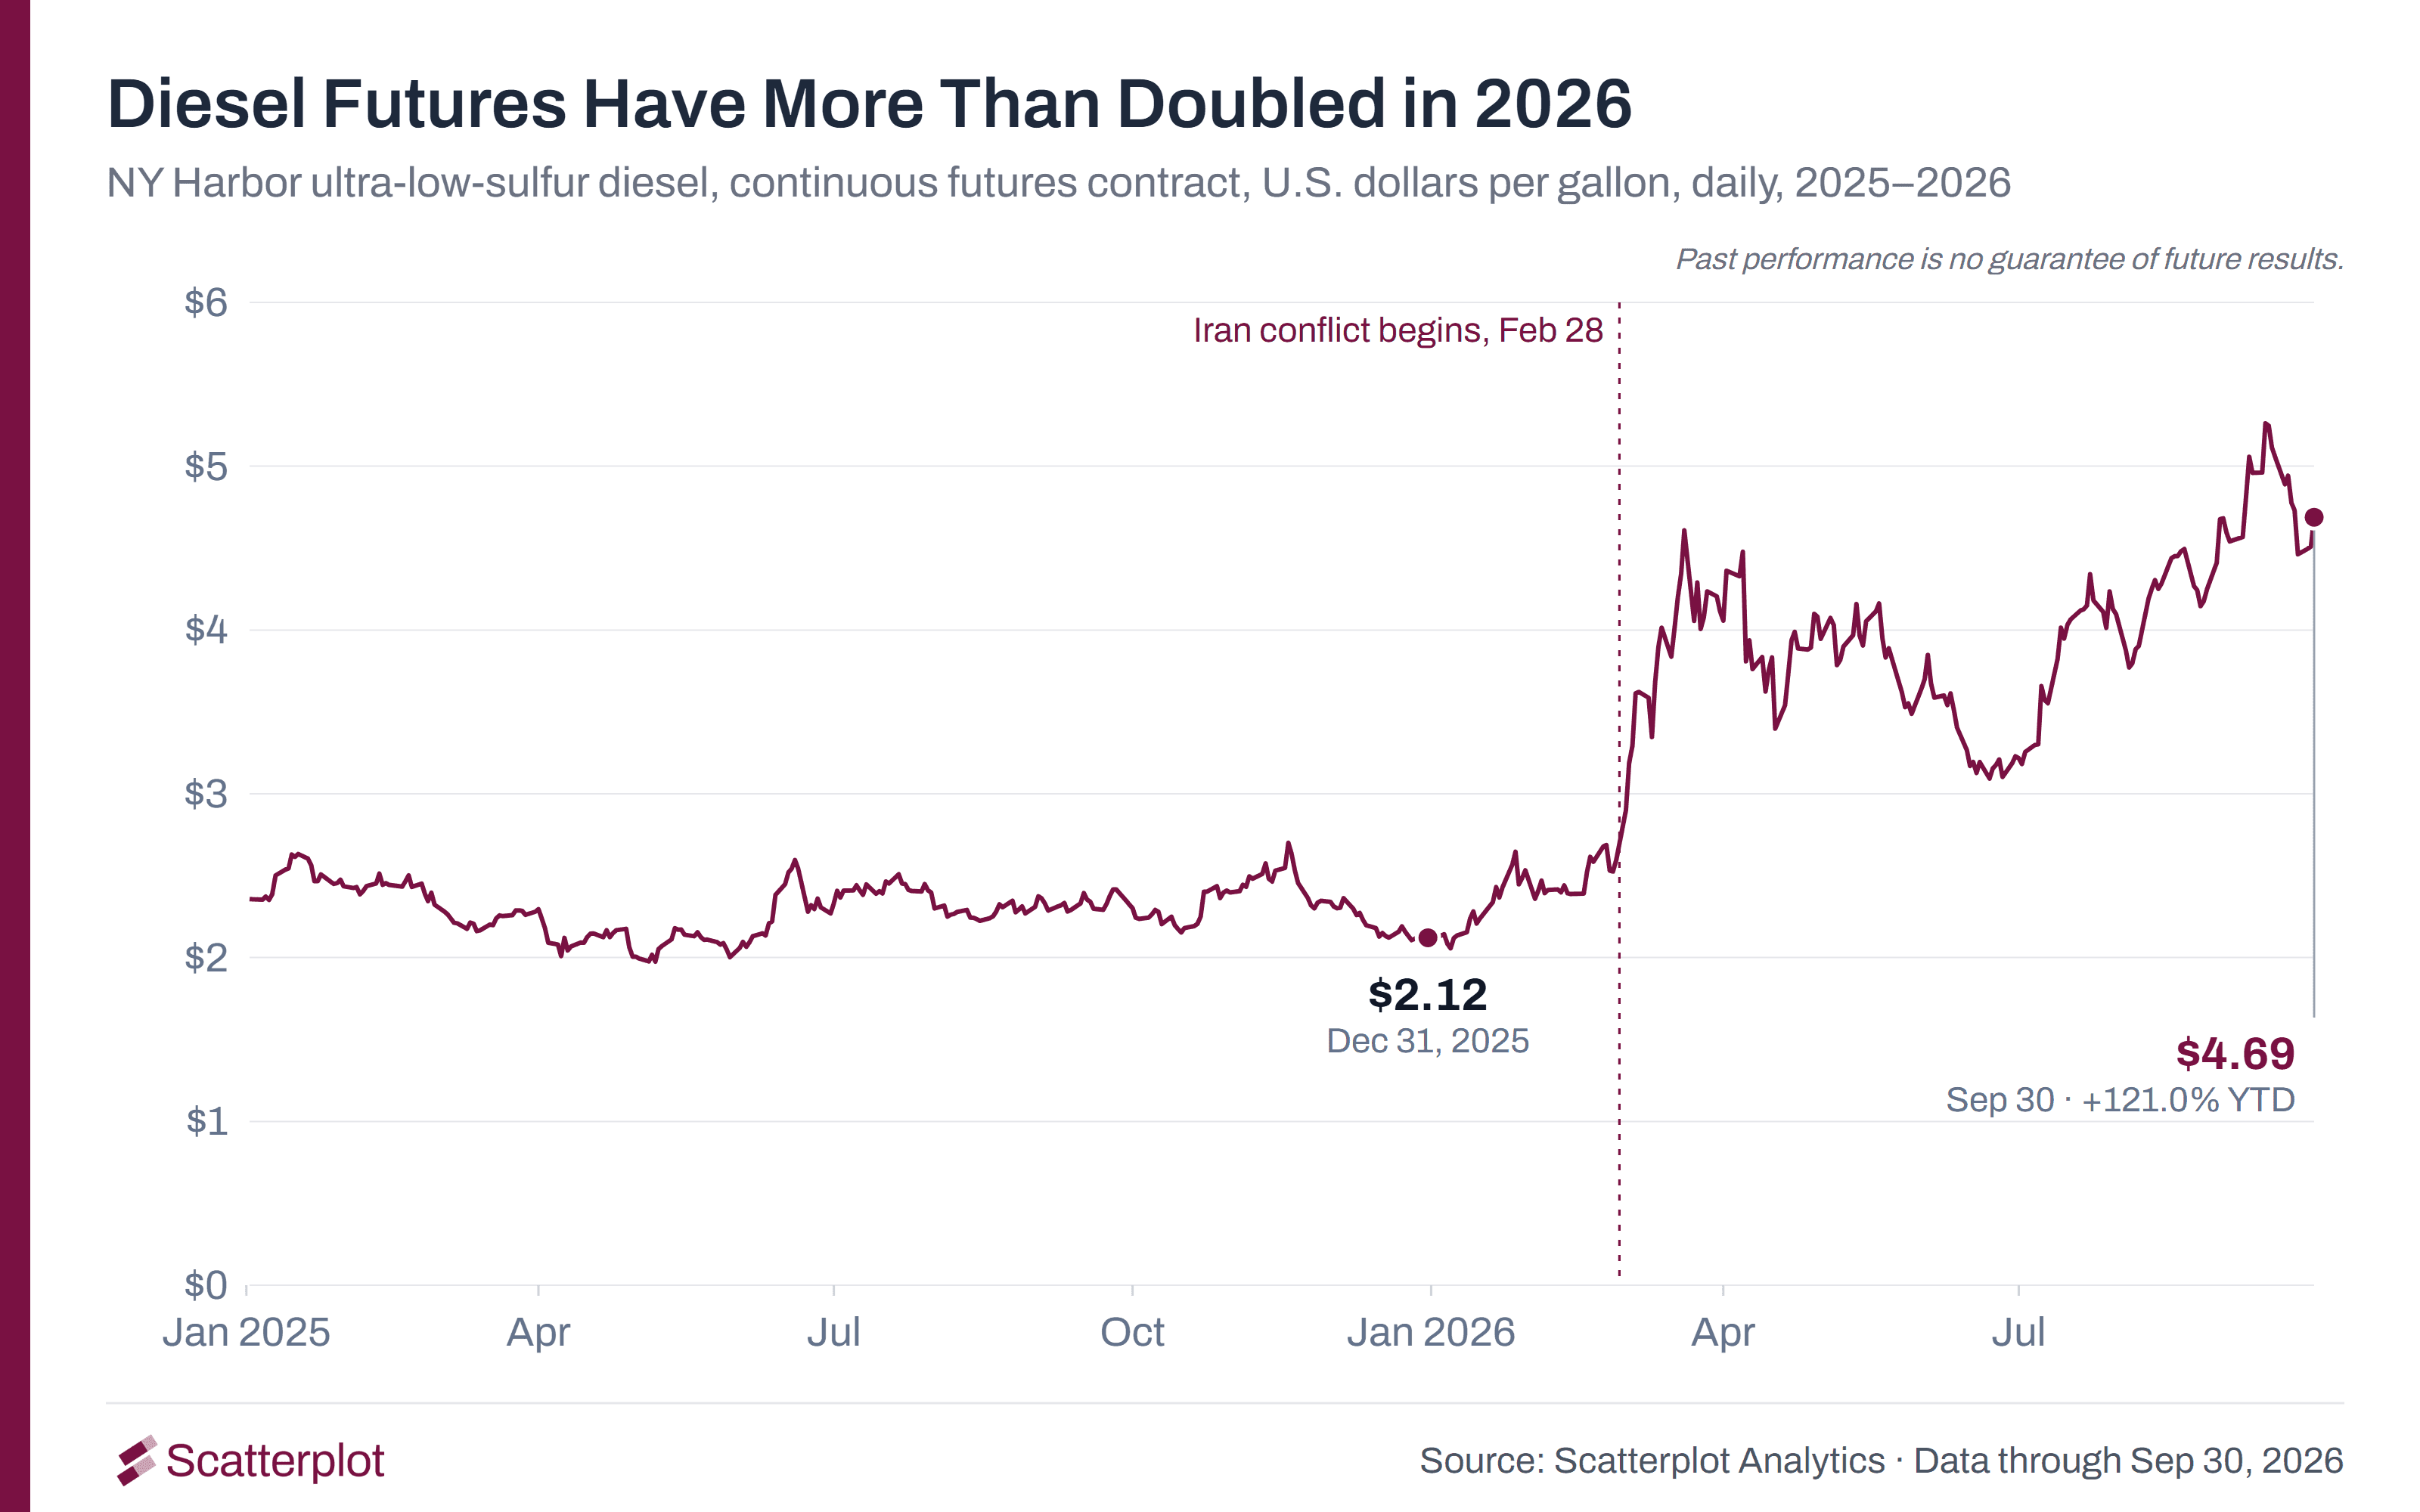
- Brent crude is up 61.1% in 2026, and diesel futures have more than doubled.
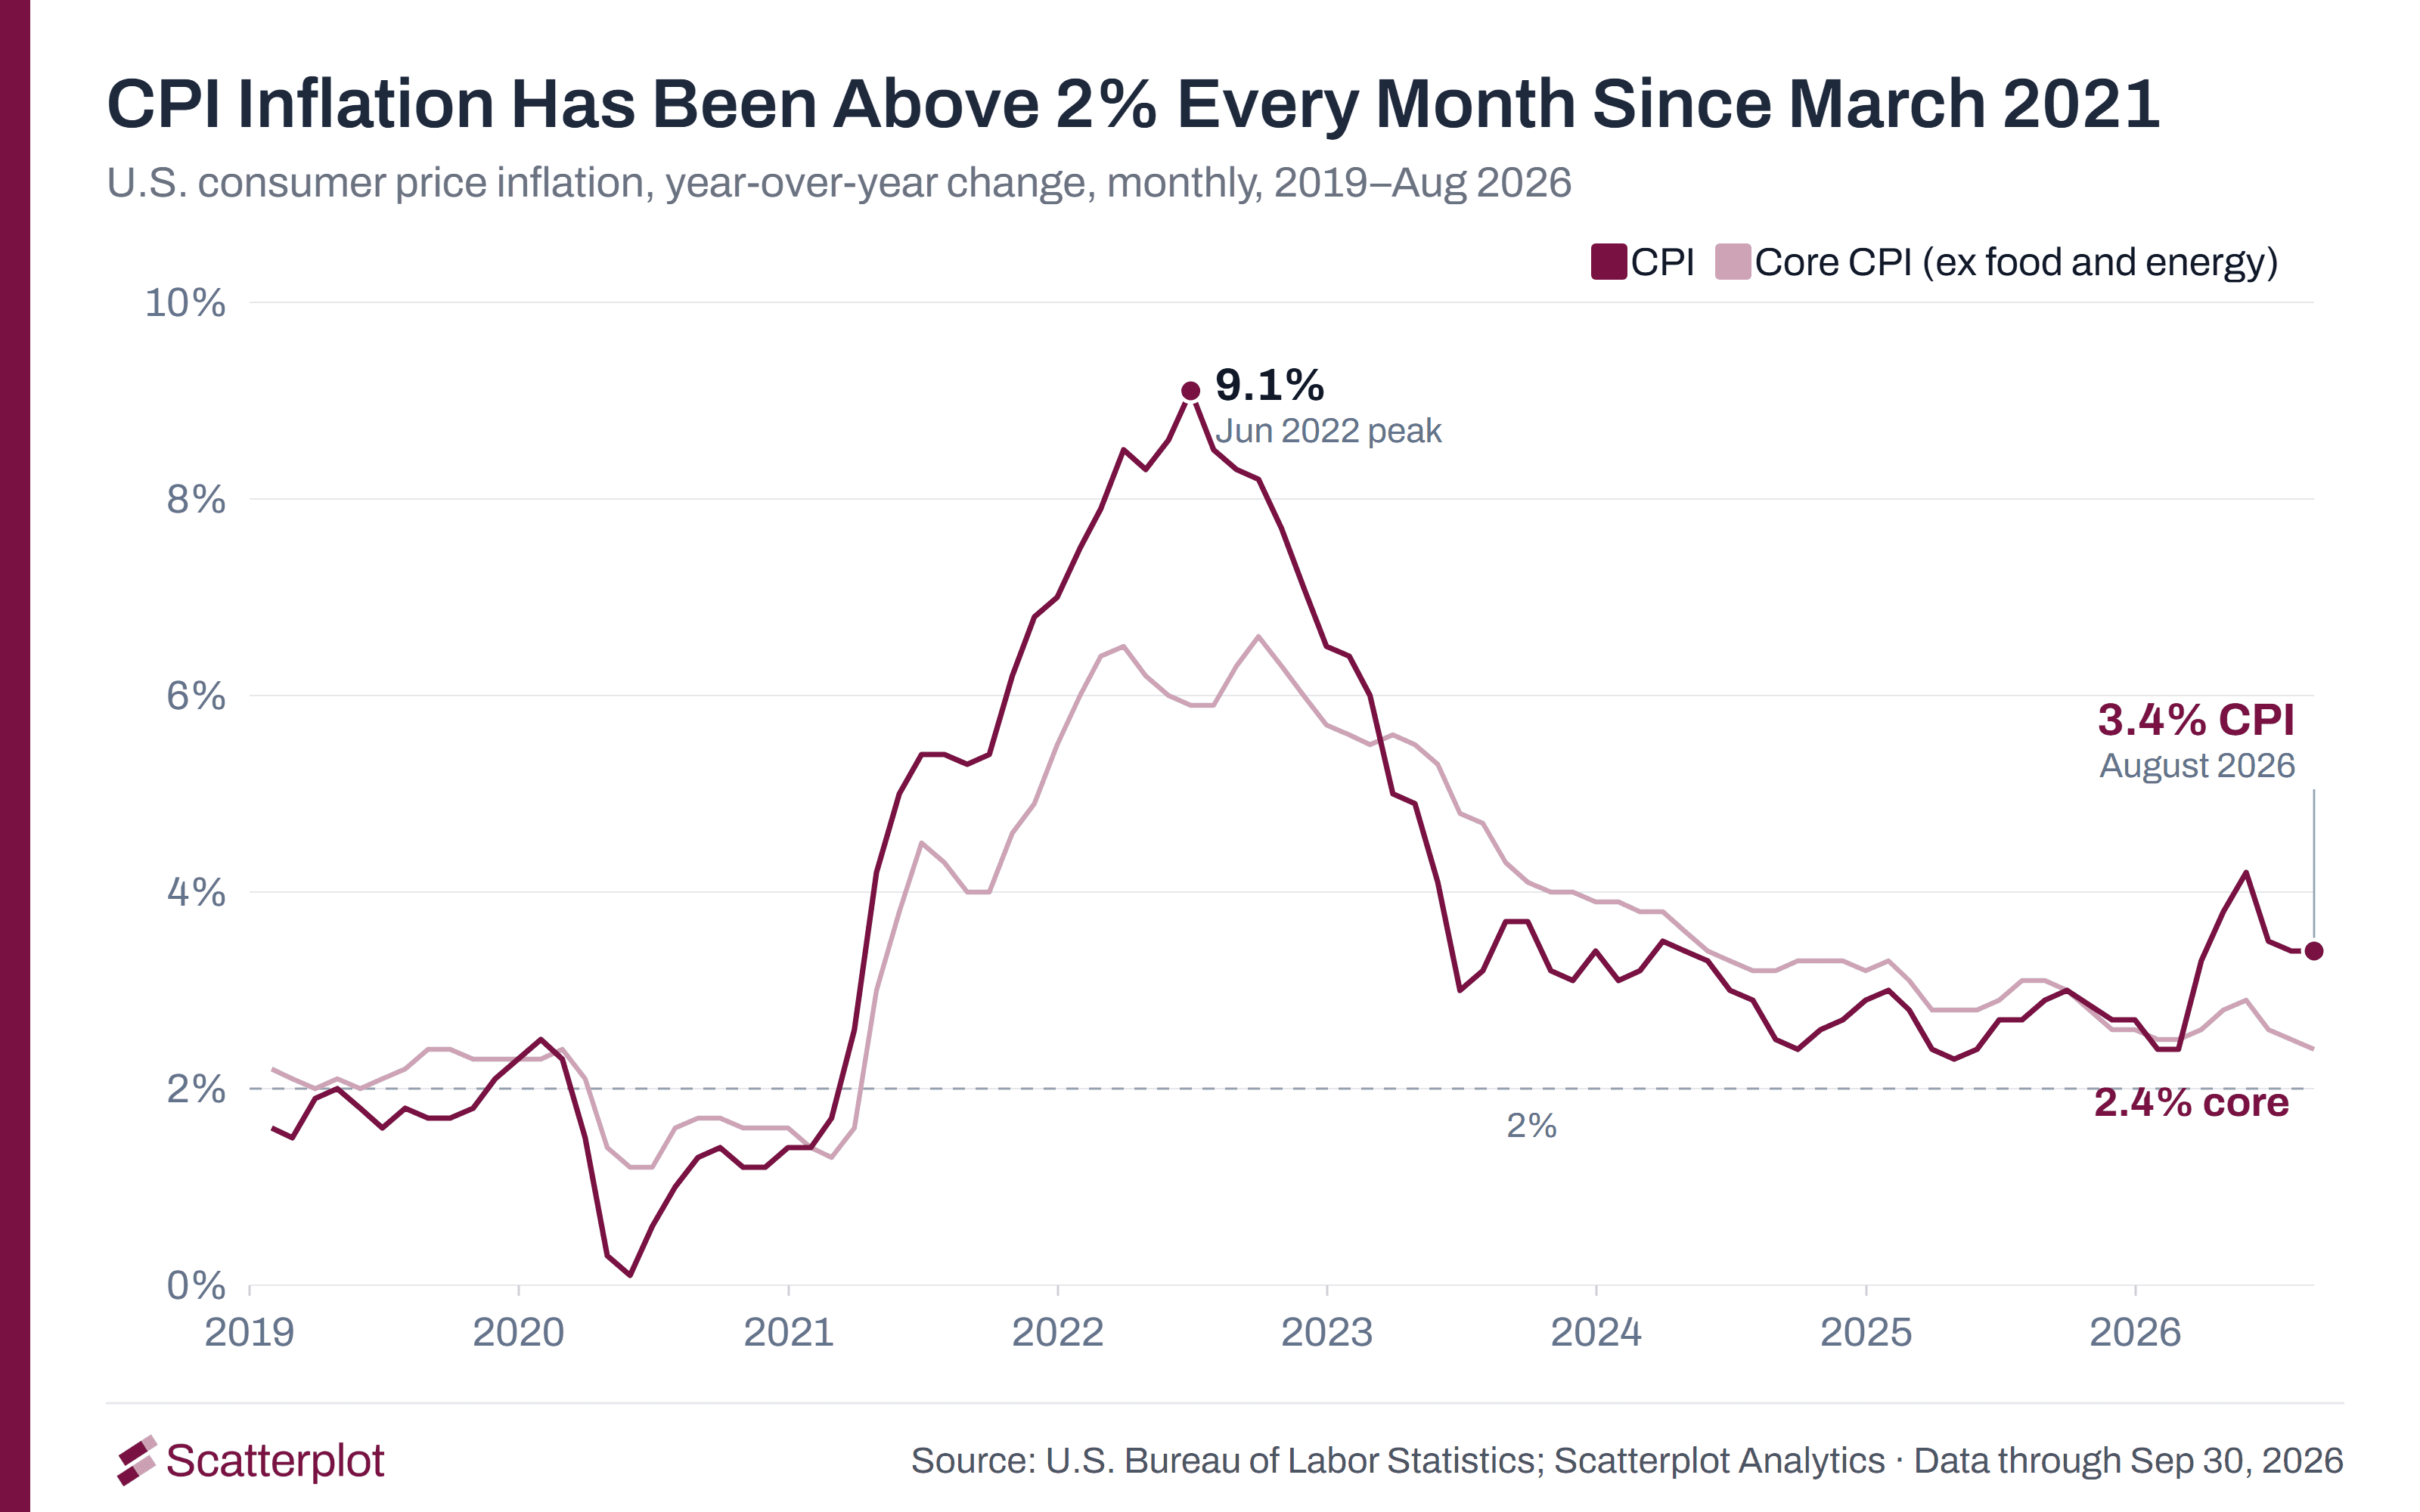
- Consumer prices rose 3.4% in the year to August, and core inflation was 2.4%.
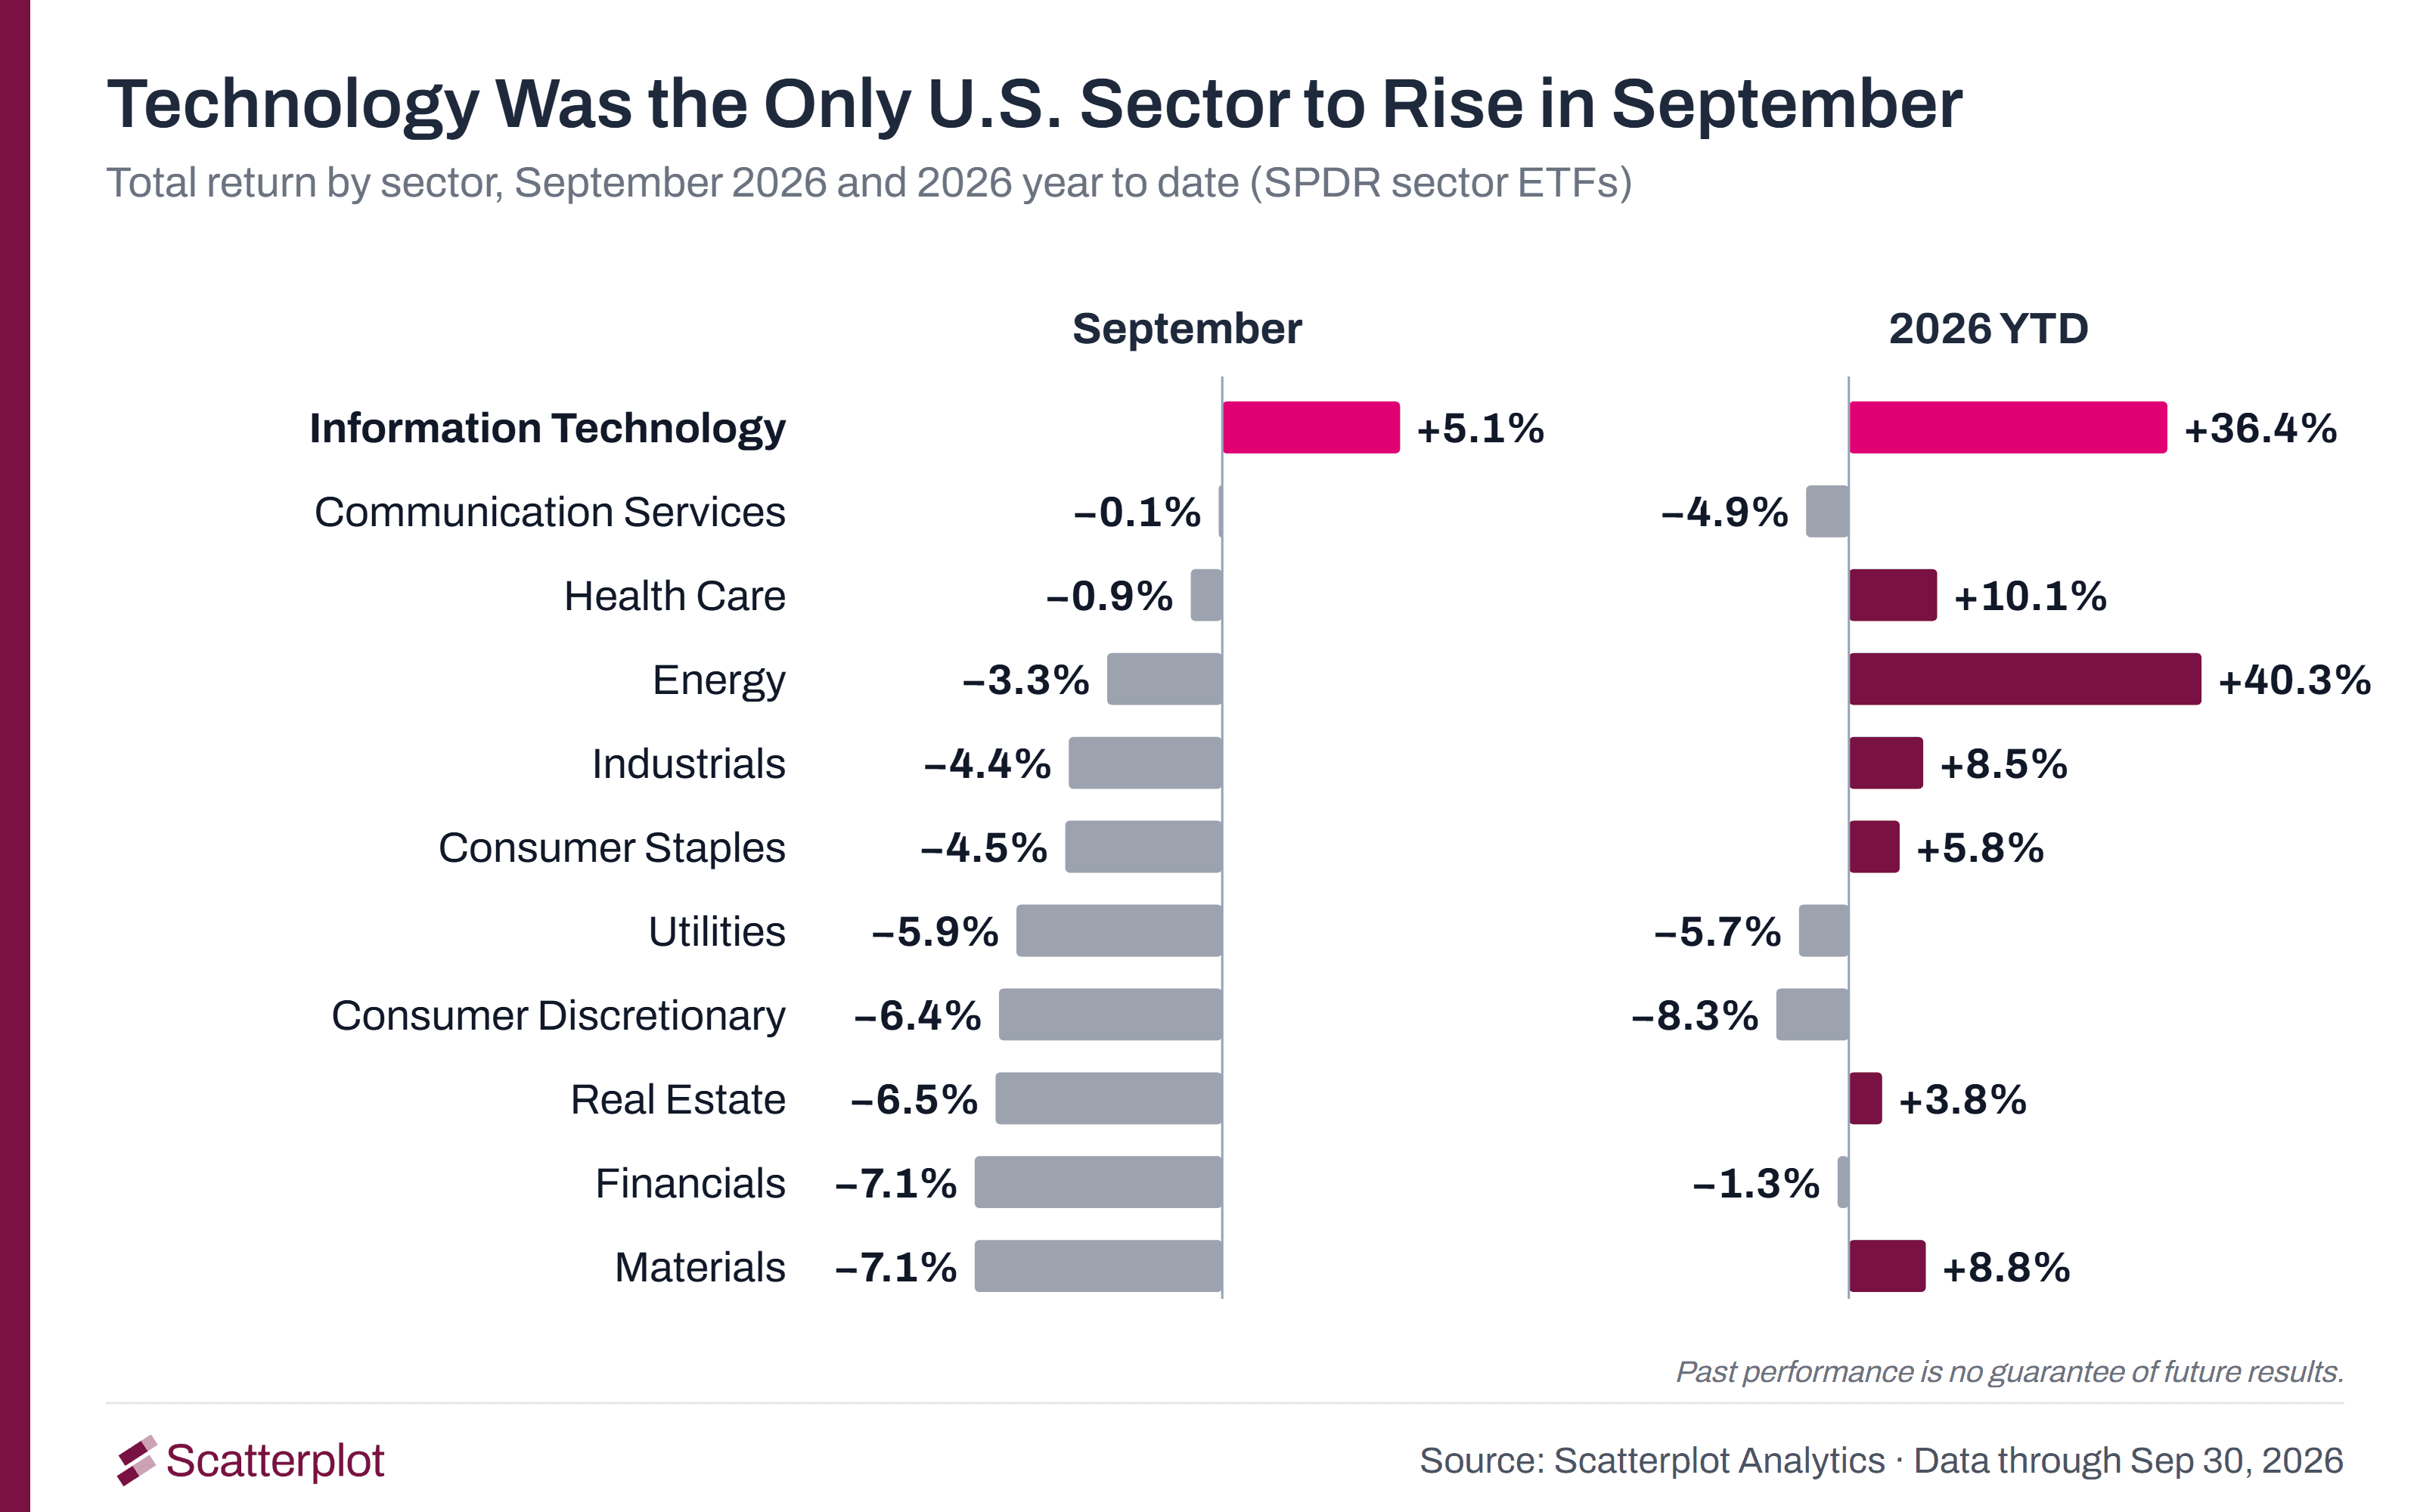
- Technology returned 5.1% in September. Every other U.S. sector fell.
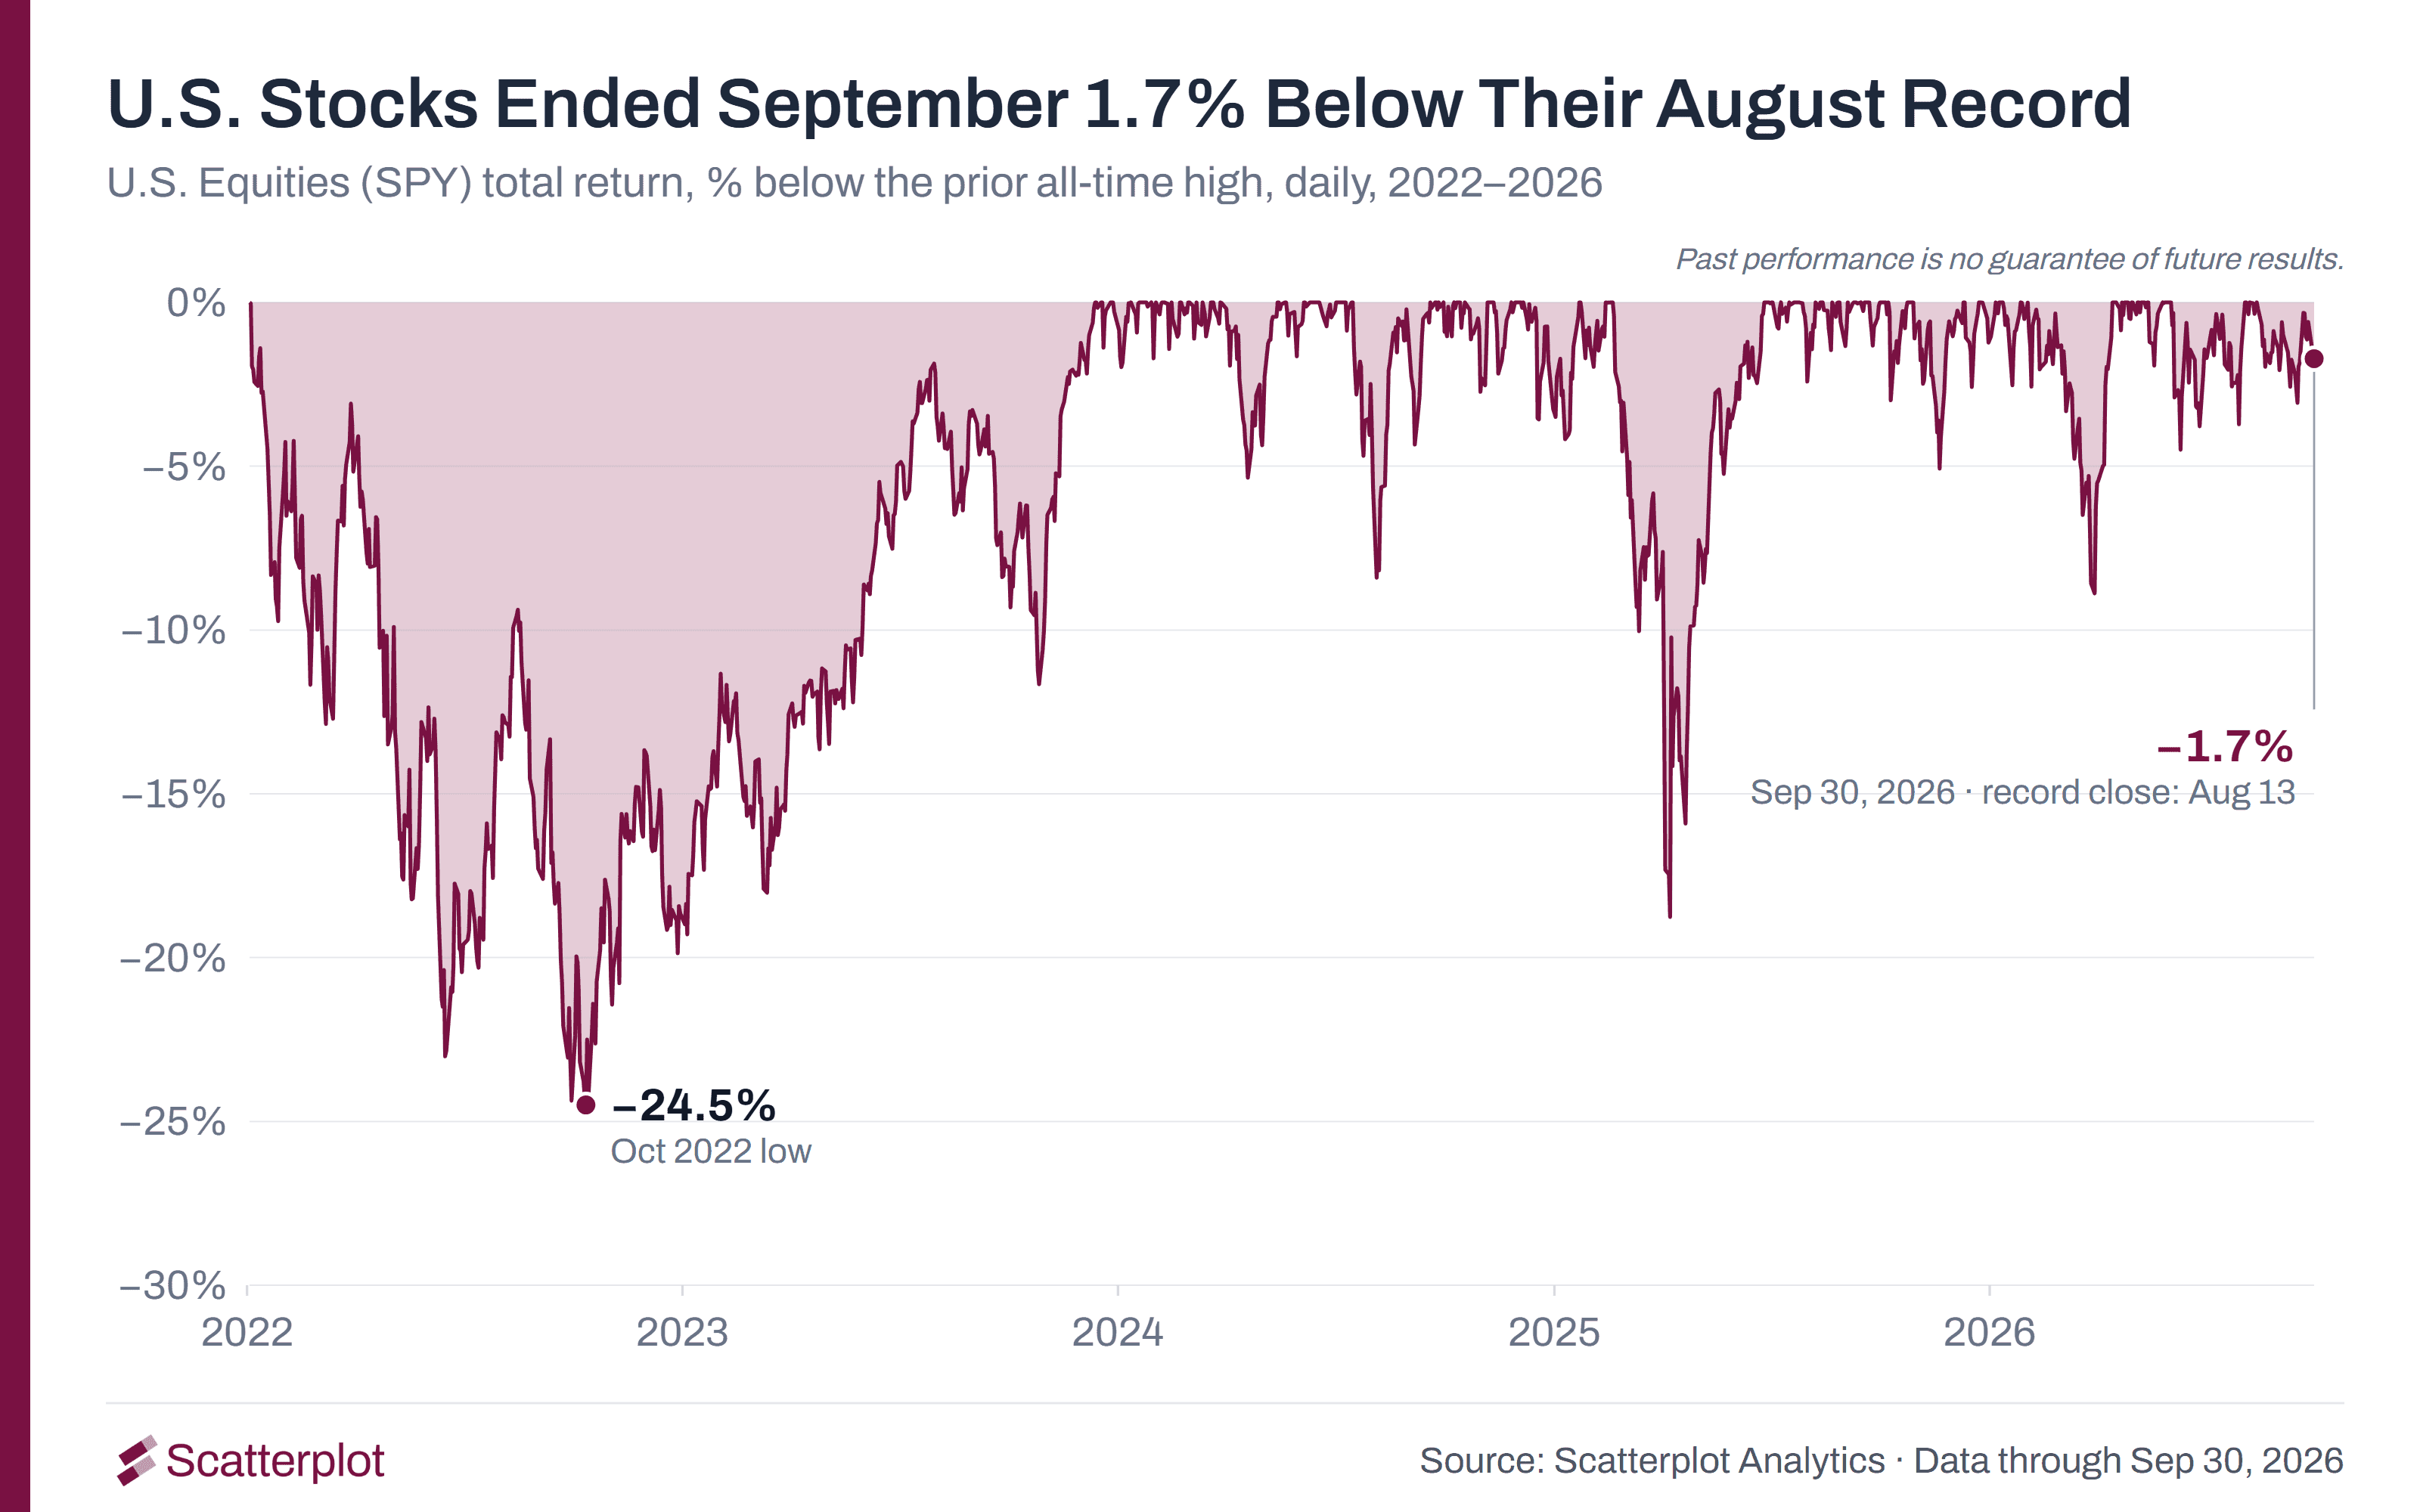
- U.S. equities ended September 1.7% below their August record, up 12.7% for the year.
- The U.S. dollar rose 2.0%, and Bitcoin rose for a third straight month.
1. The 10-year Treasury yield closed September at its highest since 2002
The 10-year Treasury yield rose from 4.75% to 5.29% in September, its highest close since May 2002.
Track the live chart at scatterplot.co.
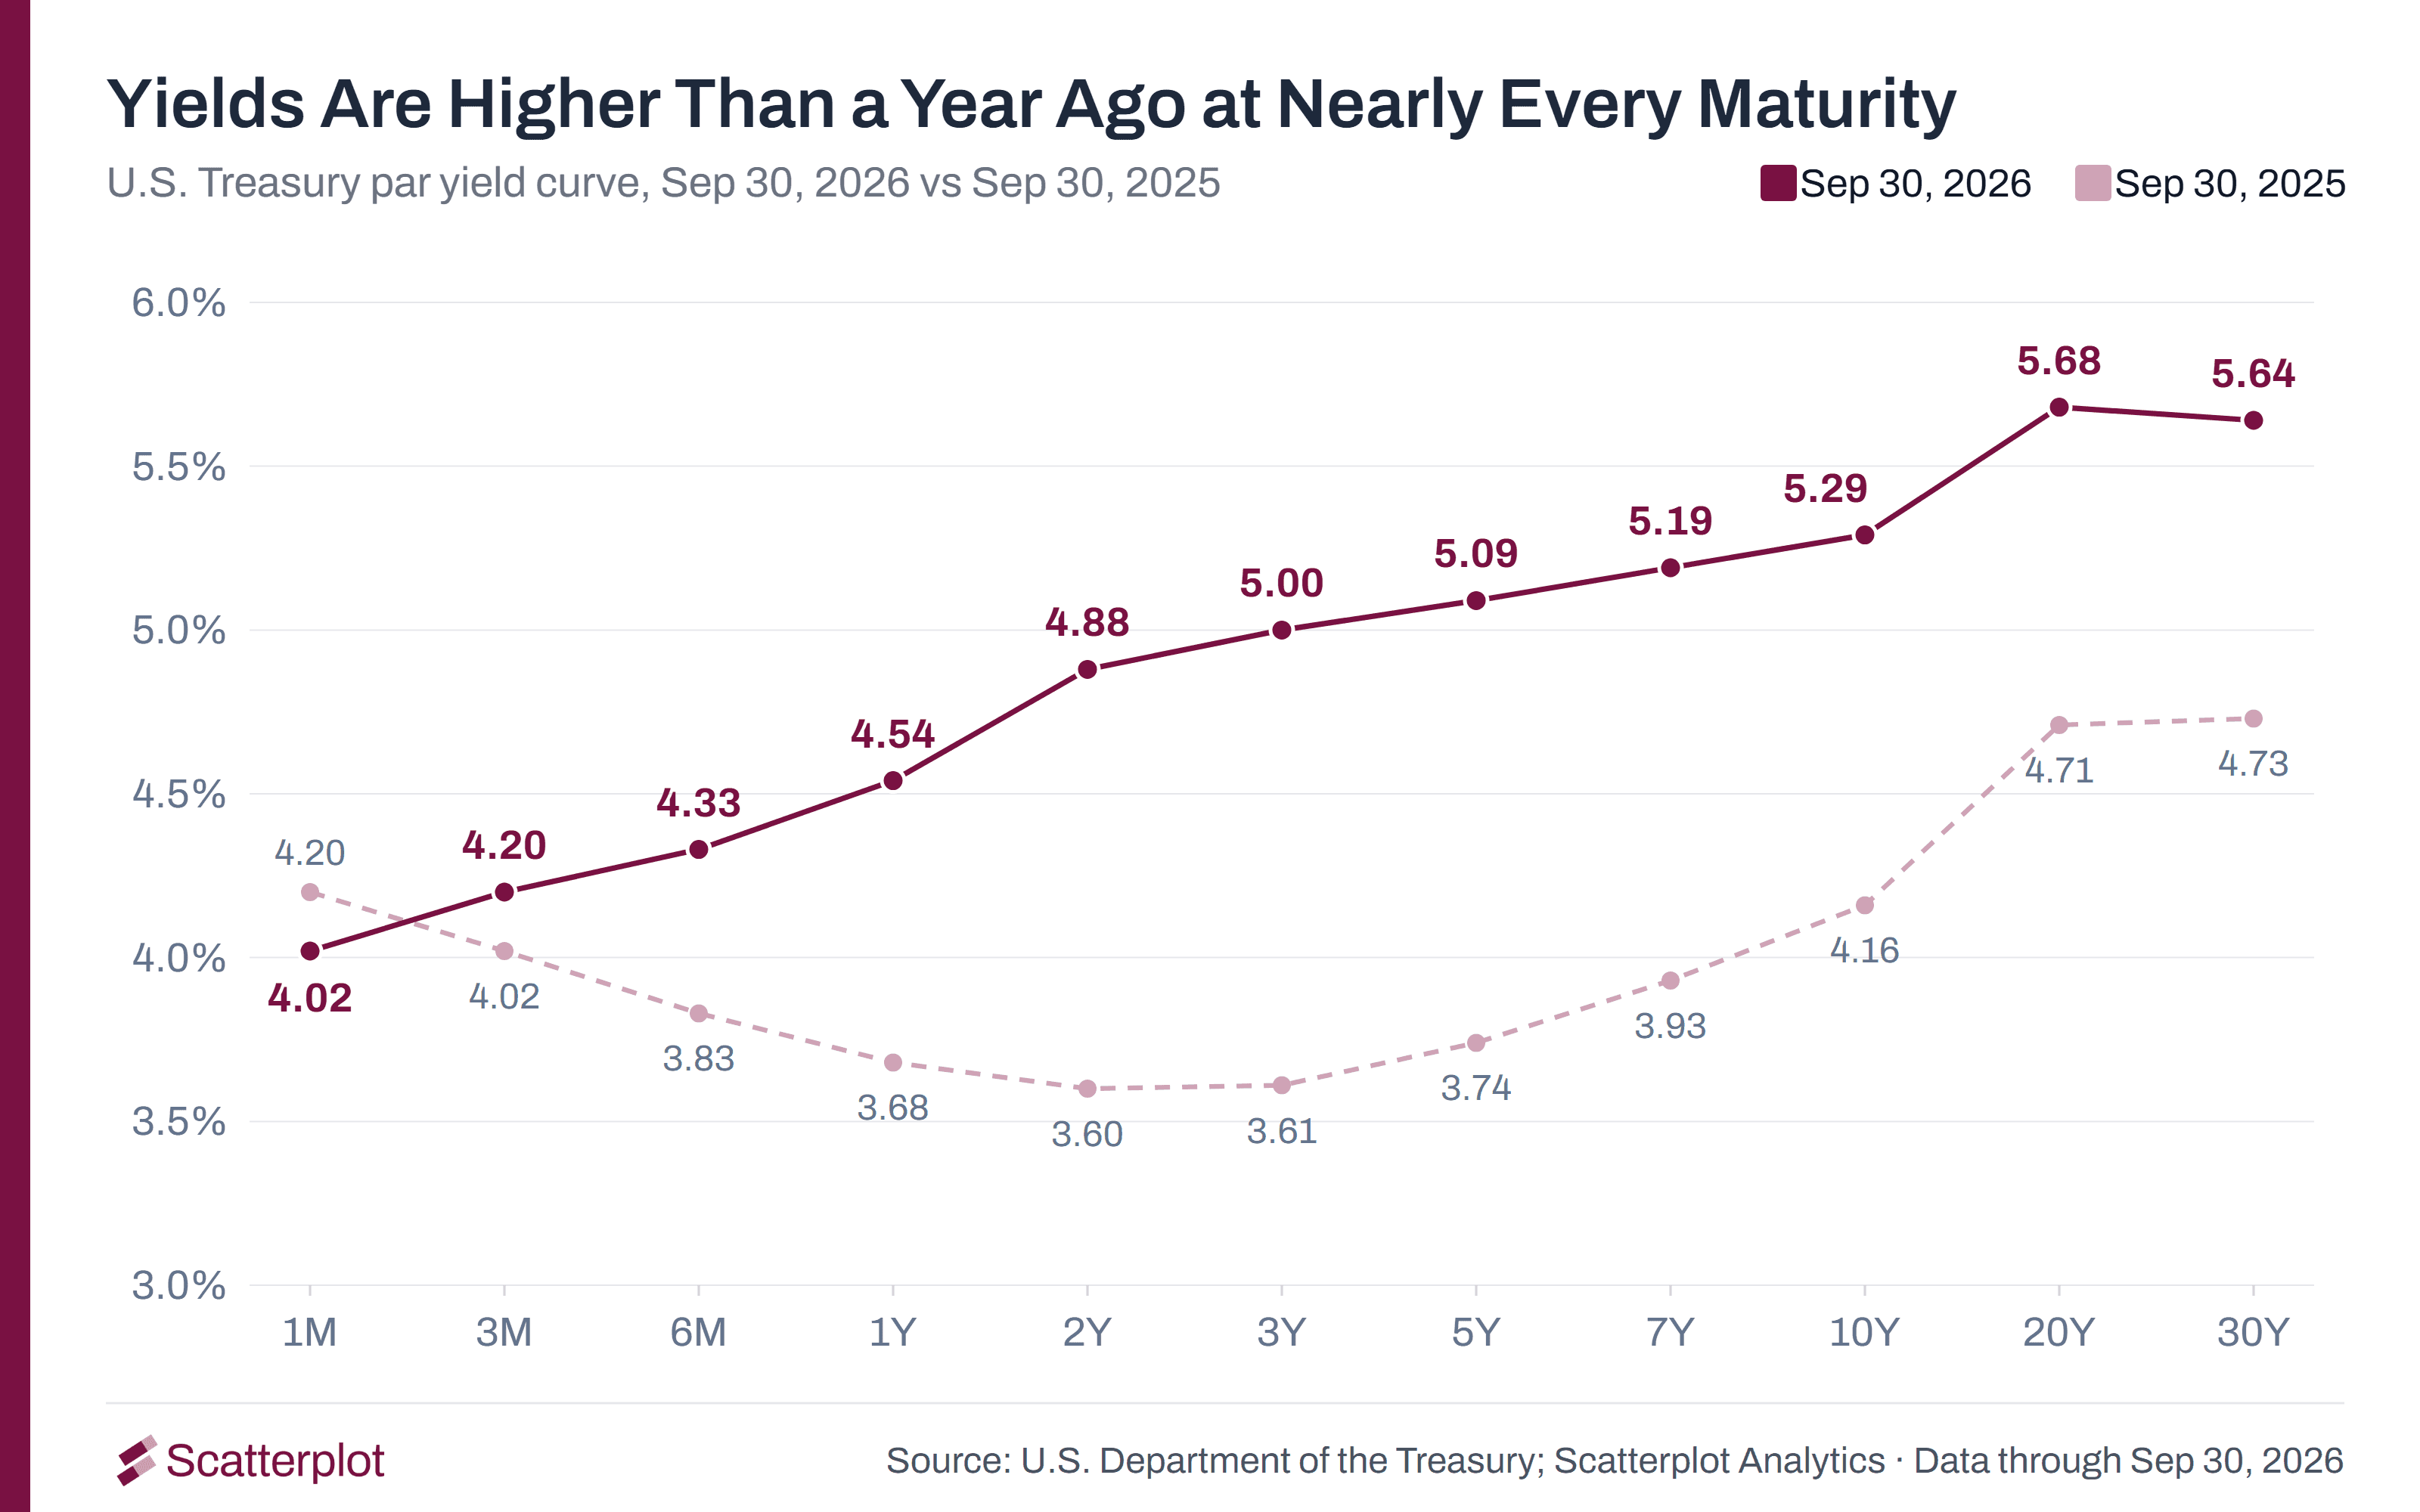
Yields are higher than a year ago at every maturity from 3 months to 30 years. Only the 1-month yield is lower.
Track the live chart at scatterplot.co.
2. The Fed raised rates for the first time since 2023
On September 16, the Federal Reserve raised its federal funds target range by a quarter point, to 3.75%–4.00%. It was the first increase since July 2023. For earlier cycles, see Fed Rate Hikes Since 1994: What Happened in Each Cycle.
Track the live chart at scatterplot.co.
3. Oil and diesel prices are far above their year-end levels
Brent crude ended September at $98.03 a barrel, up 61.1% in 2026.
Track the live chart at scatterplot.co.
Diesel futures have more than doubled this year, from $2.12 to $4.69 a gallon.
Track the live chart at scatterplot.co.
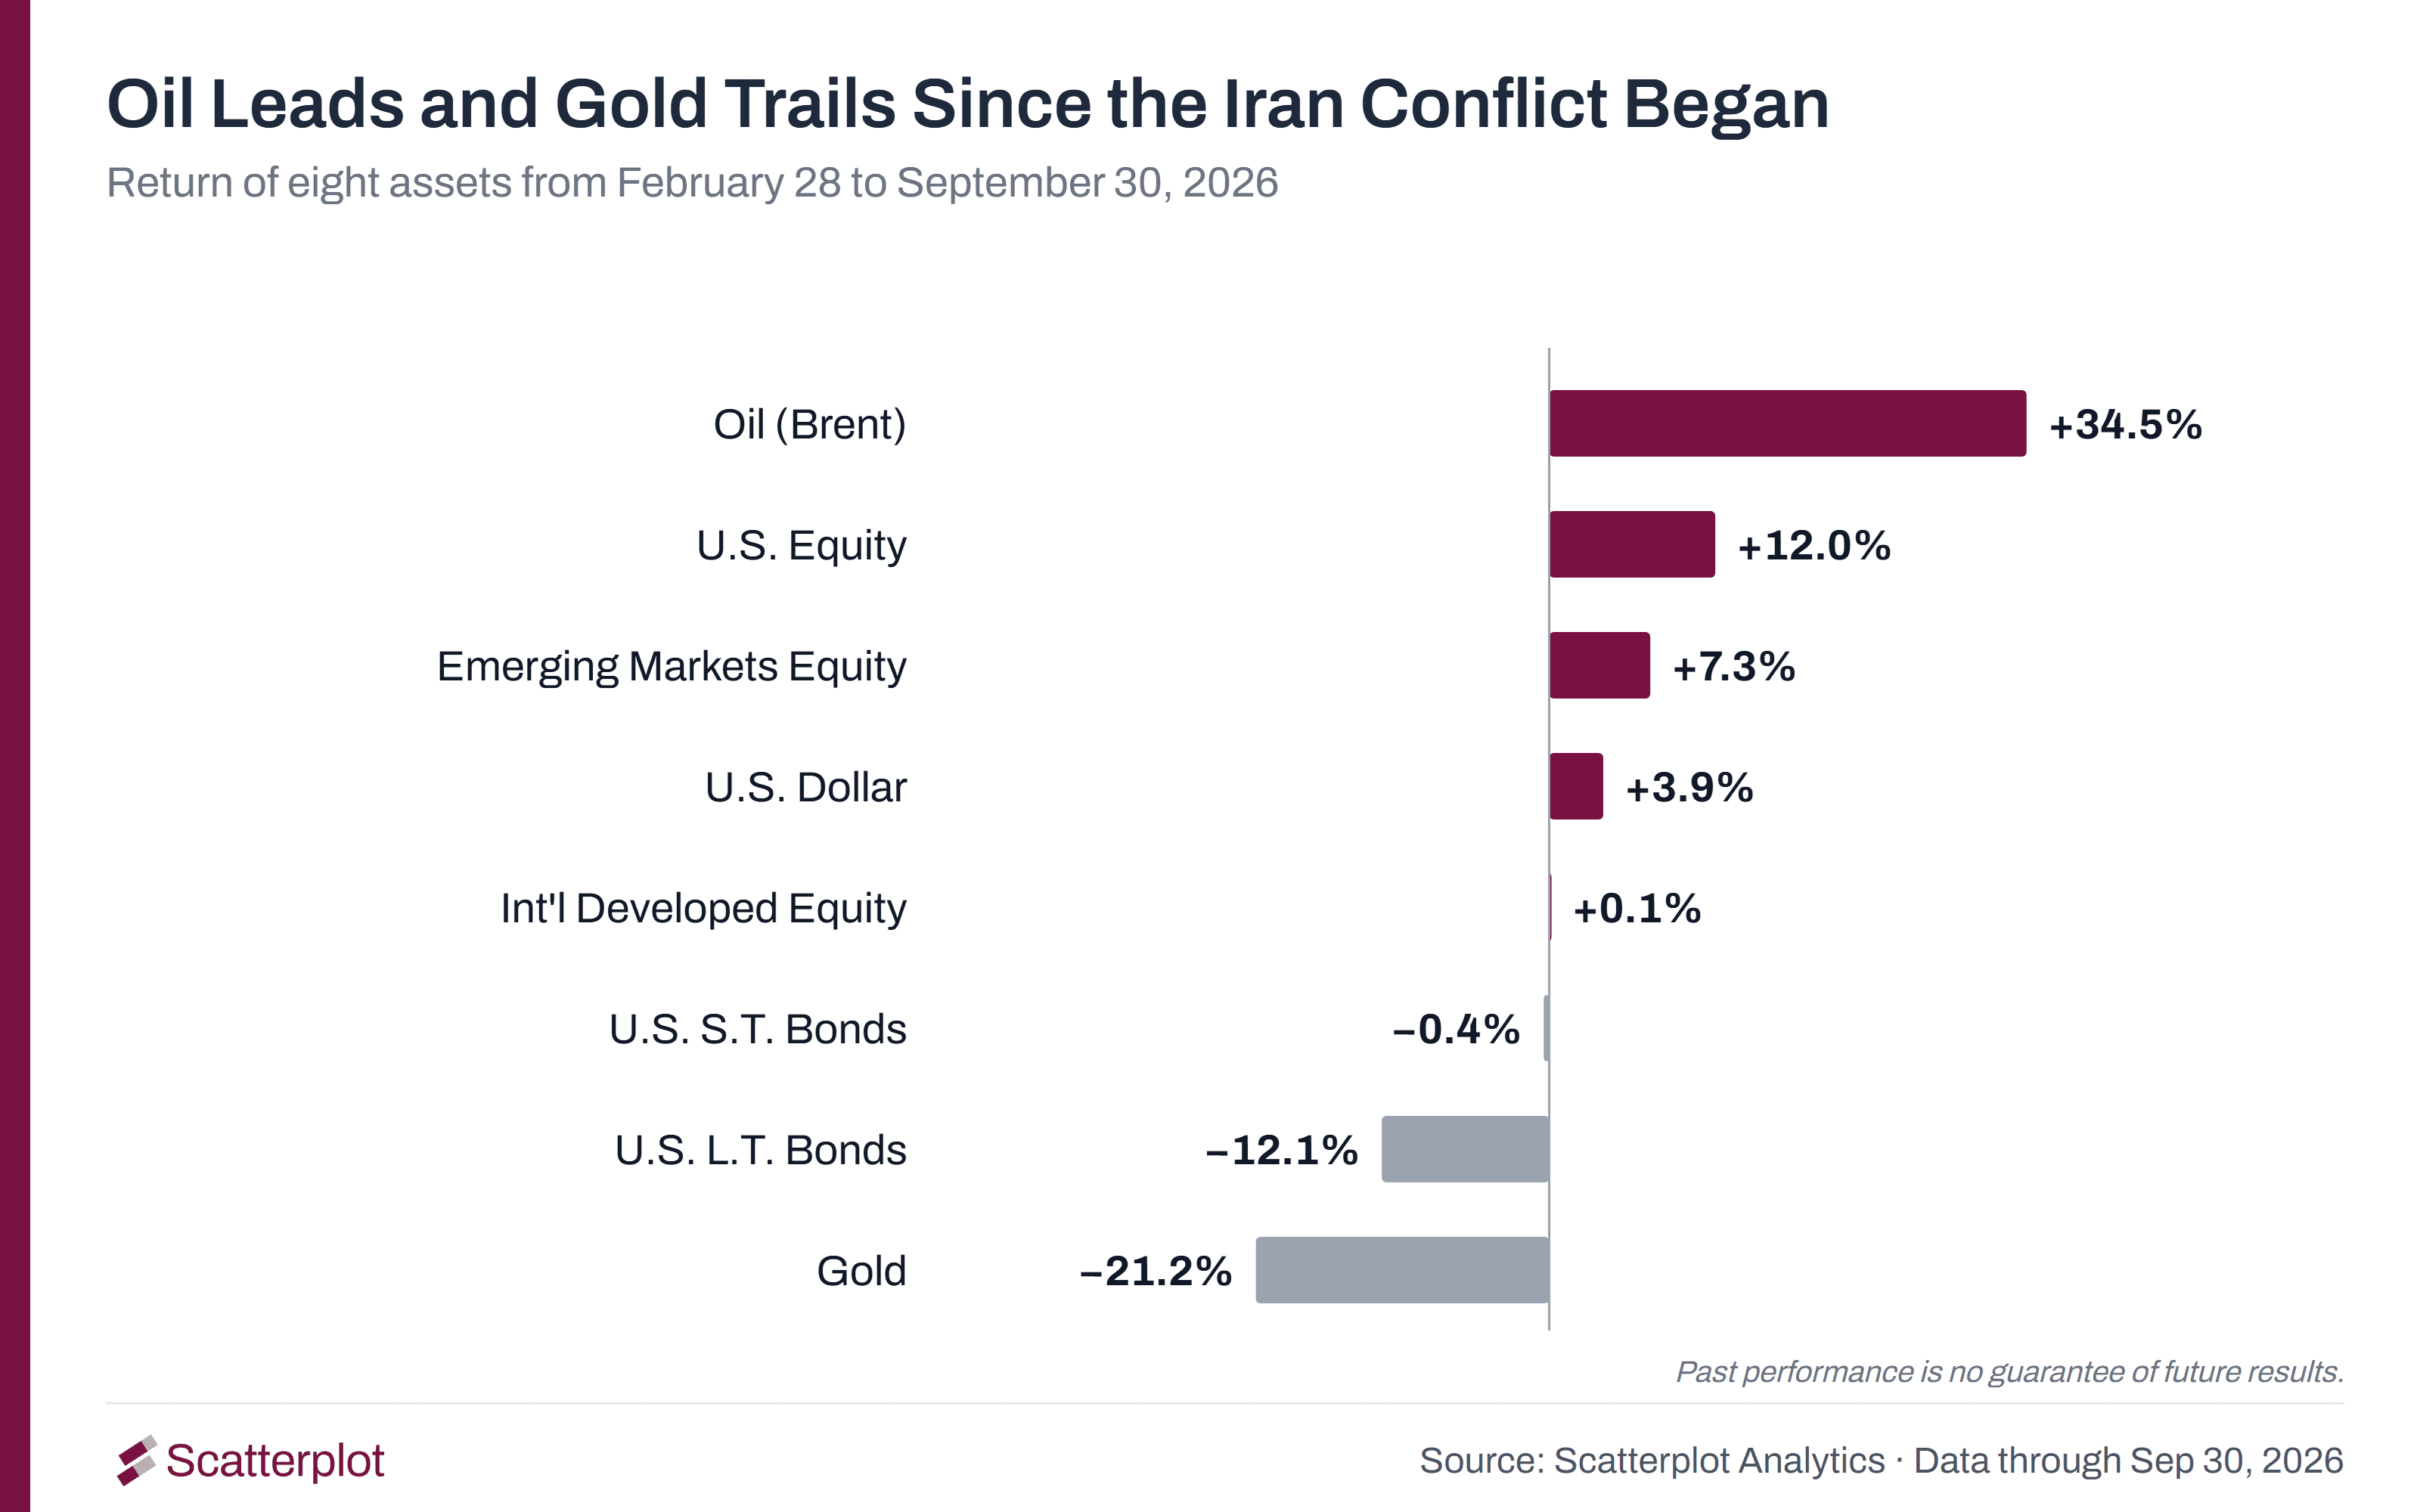
Since the Iran conflict began on February 28, oil has gained the most of the eight assets in the chart below, at 34.5%. Gold has lost the most, at 21.2%.
Track the live chart at scatterplot.co.
For more background on oil, see Why $100 Oil Hurts the U.S. Economy Less Than It Used To.
4. Consumer price inflation has been above 2% since March 2021
Consumer prices rose 3.4% in the year to August. Core inflation, which excludes food and energy, was 2.4%.
Track the live chart at scatterplot.co.
5. Technology was the only U.S. sector to rise in September
Information technology returned 5.1% in September, and the other 10 sectors fell.
Track the live chart at scatterplot.co.
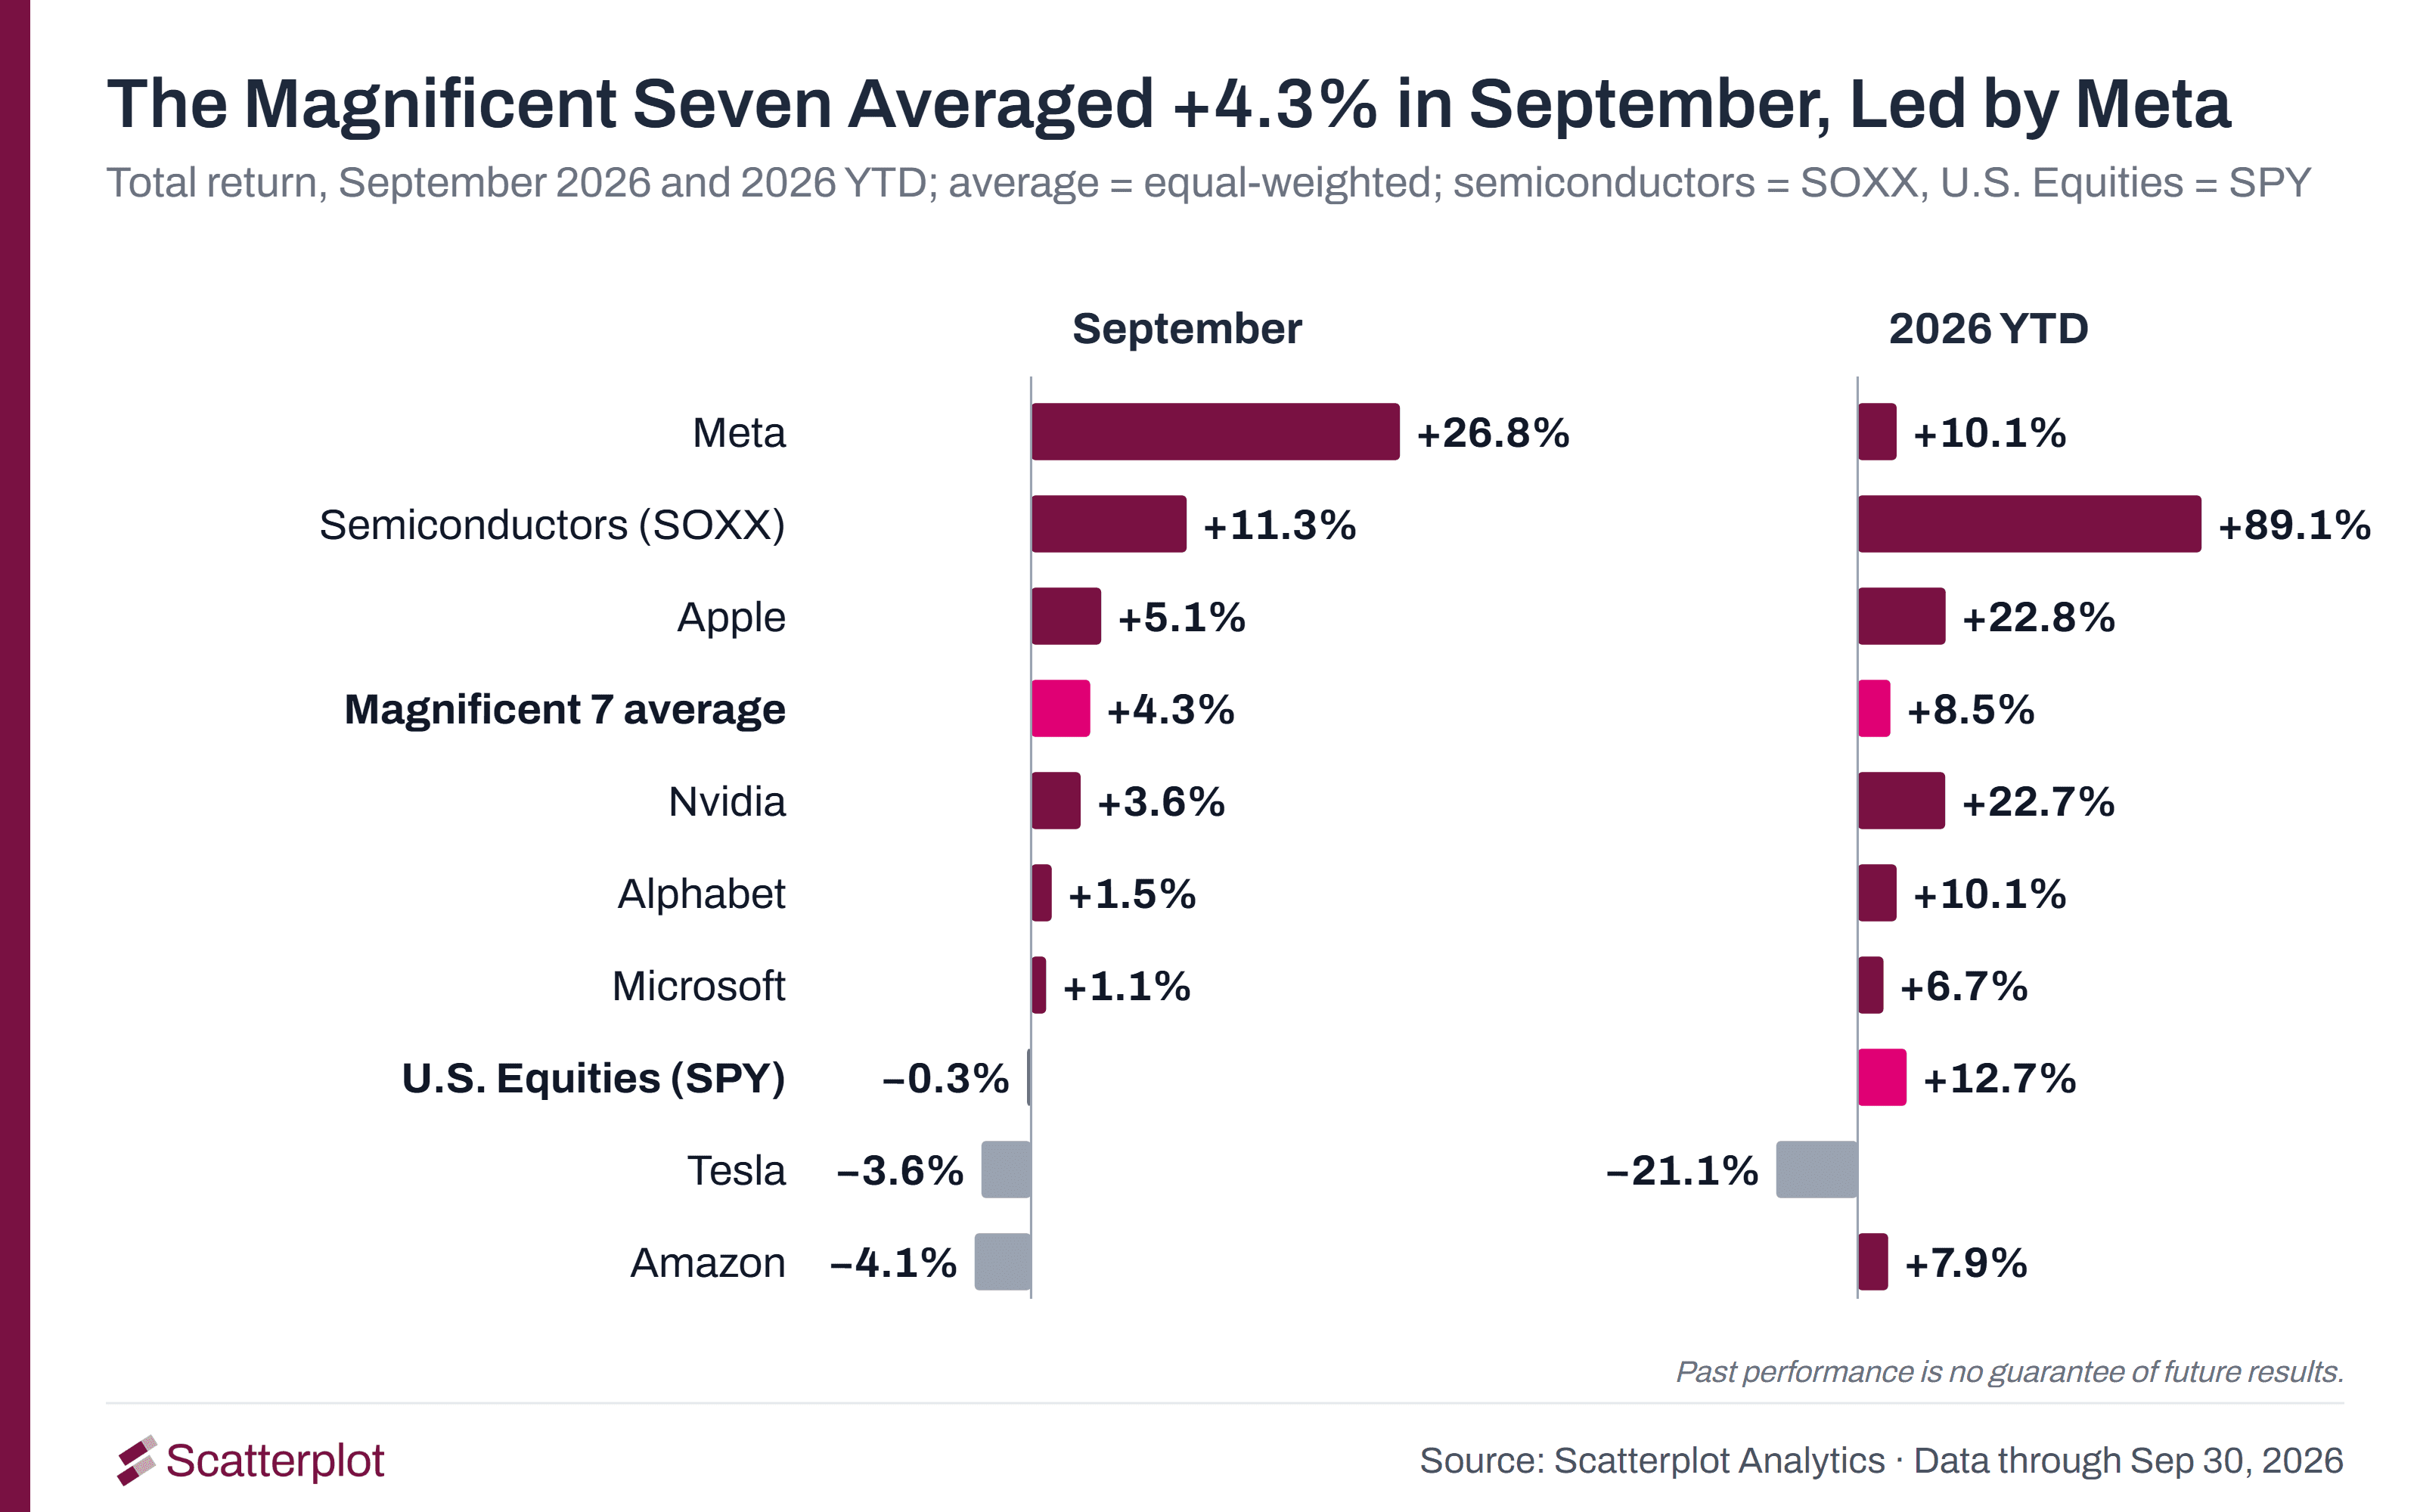
The Magnificent Seven averaged a 4.3% return in September, while U.S. equities as a whole returned −0.3%. Most of that average came from Meta, which returned 26.8%. The other six averaged 0.6%.
Track the live chart at scatterplot.co.
6. U.S. stocks ended the third quarter just below their record high
U.S. equities ended September 1.7% below their August 13 record close. They returned 2.4% in the third quarter and 12.7% for the year to date.
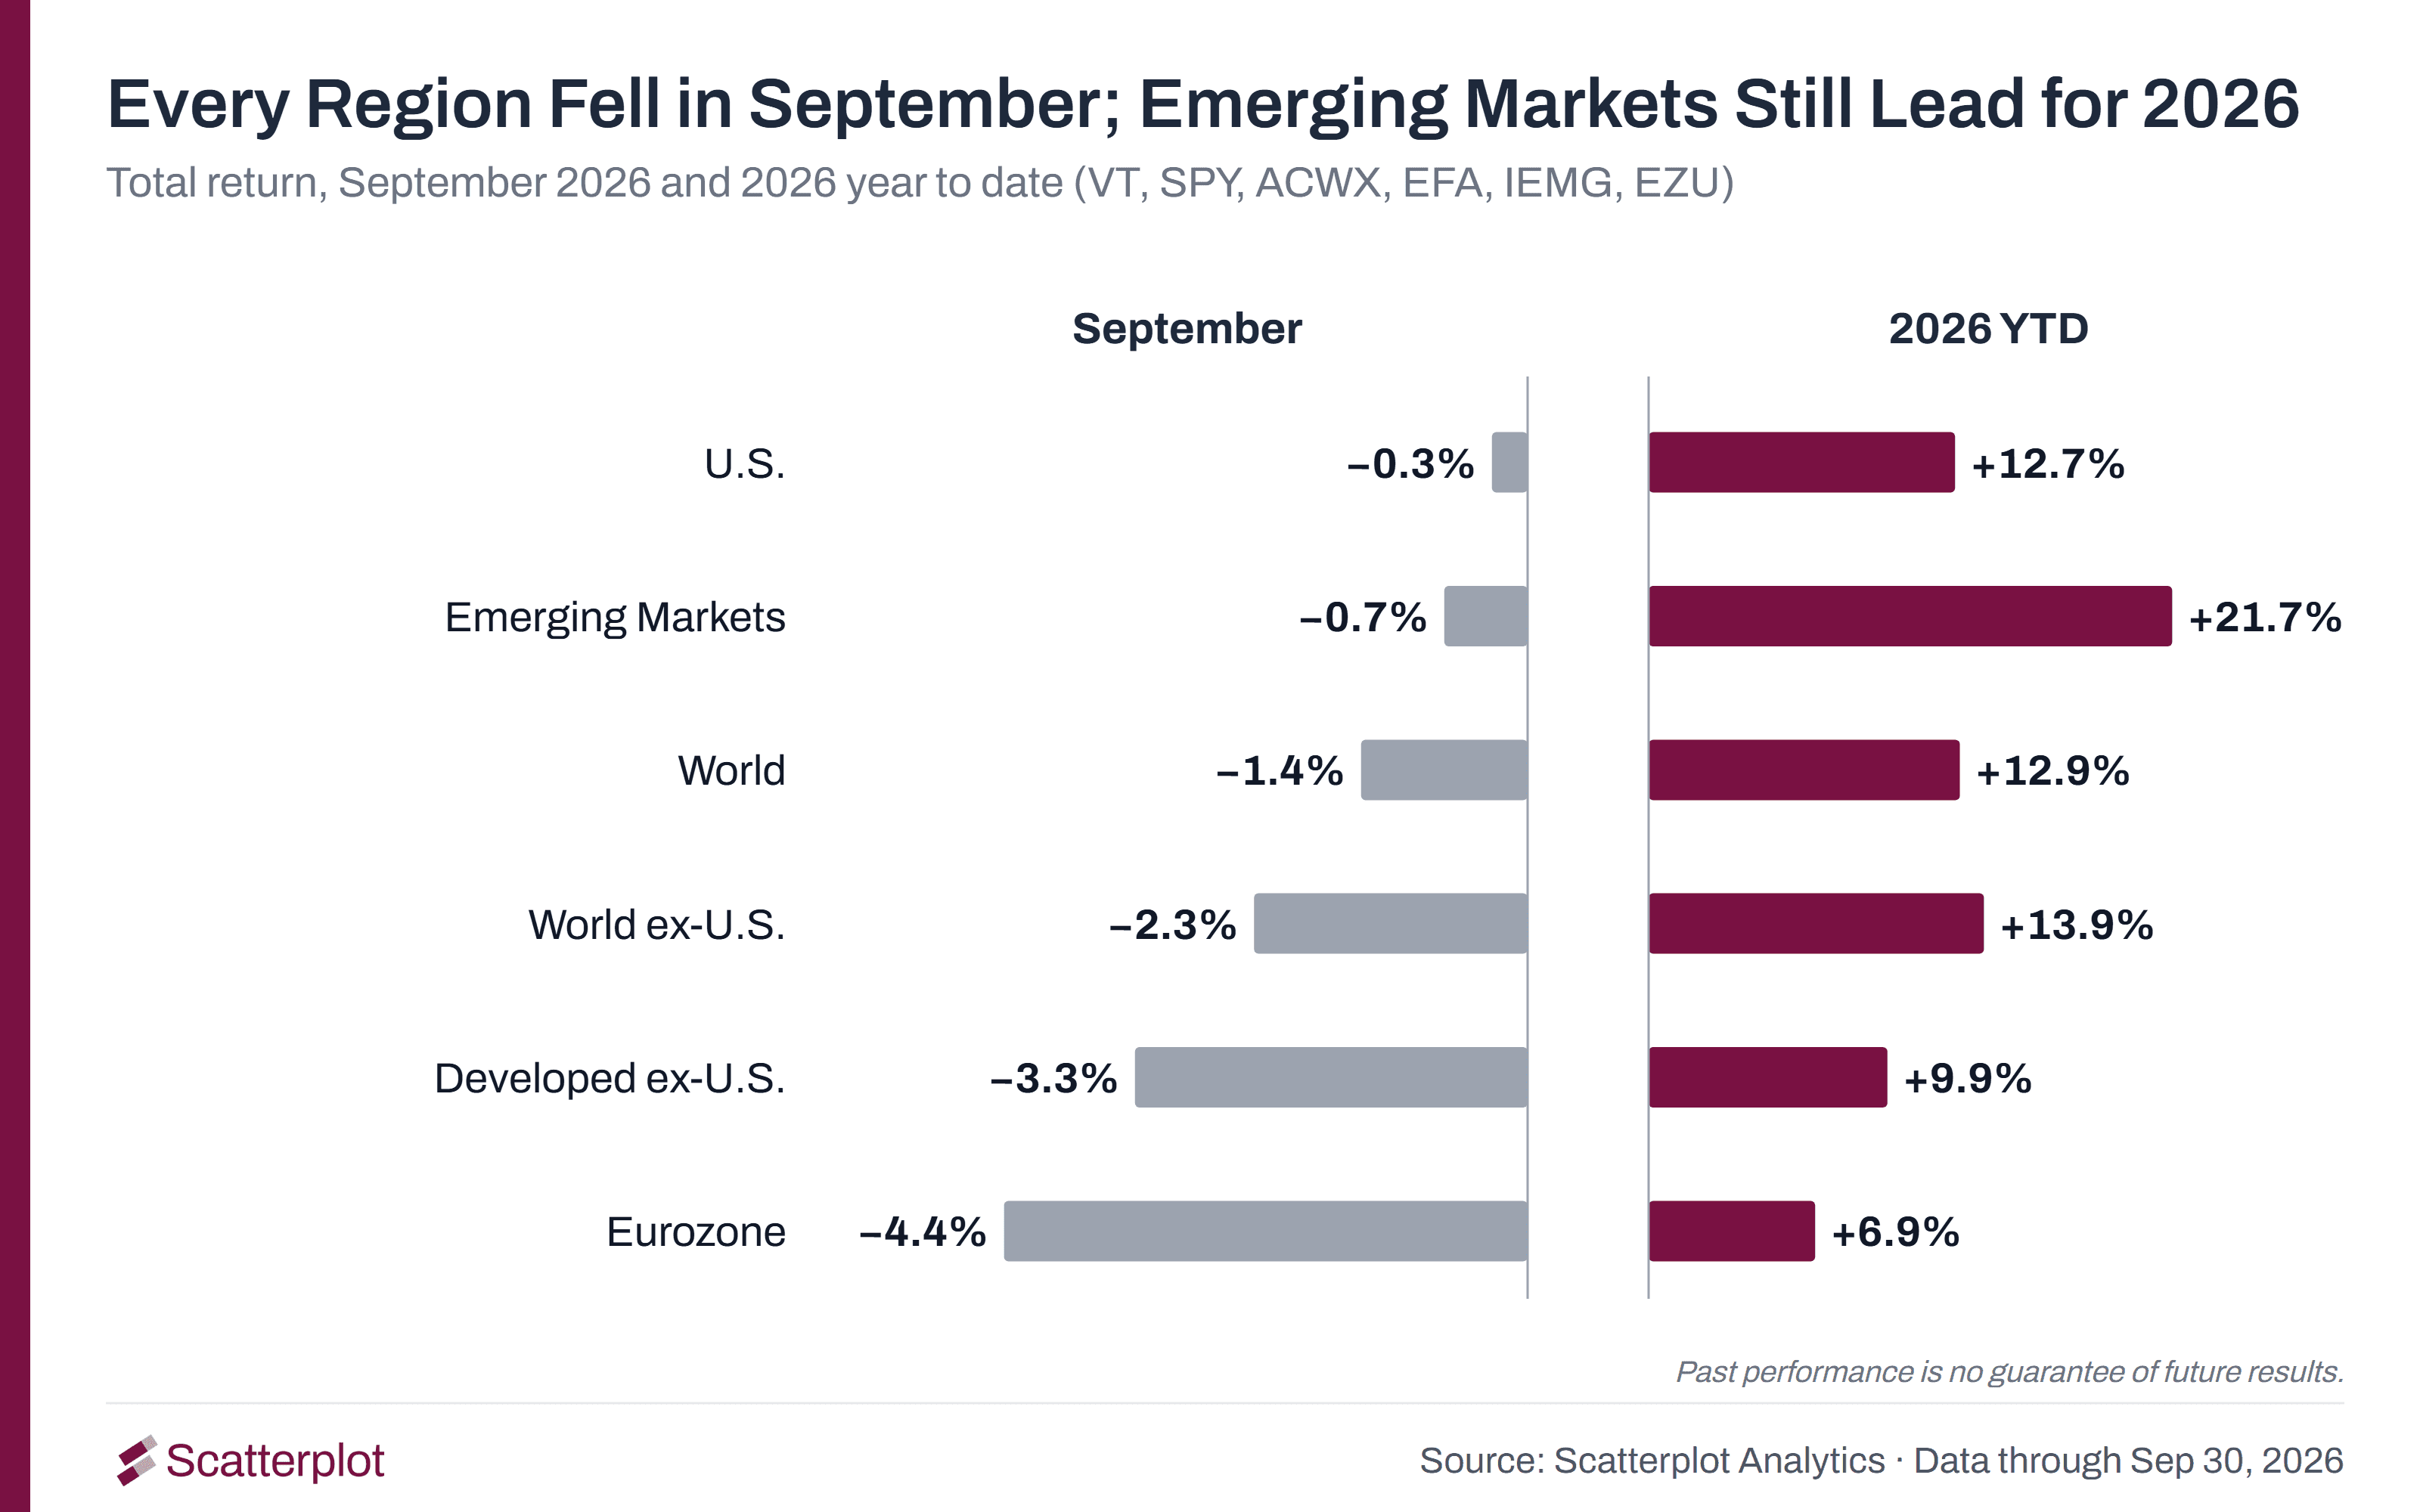
Every region we track fell in September. Emerging markets still lead for the year, at 21.7%.
Track the live chart at scatterplot.co.
7. The dollar and Bitcoin both rose in September
The U.S. dollar rose 2.0% in September, its largest monthly gain since June. Bitcoin rose 6.3%, its third straight monthly gain, and is up 42.7% over three months.
Track the live chart at scatterplot.co.
8. Hiring picked up in August after a weak early summer
U.S. employers added 29,000 jobs in September, down from 133,000 in August. The unemployment rate rose to 4.2%, from 4.1%. The July and August job counts were revised lower by a combined 60,000.
Because Scatterplot's data updates daily, this section already reflects the September jobs report, released on October 2. The rest of this recap uses data as of September 30.
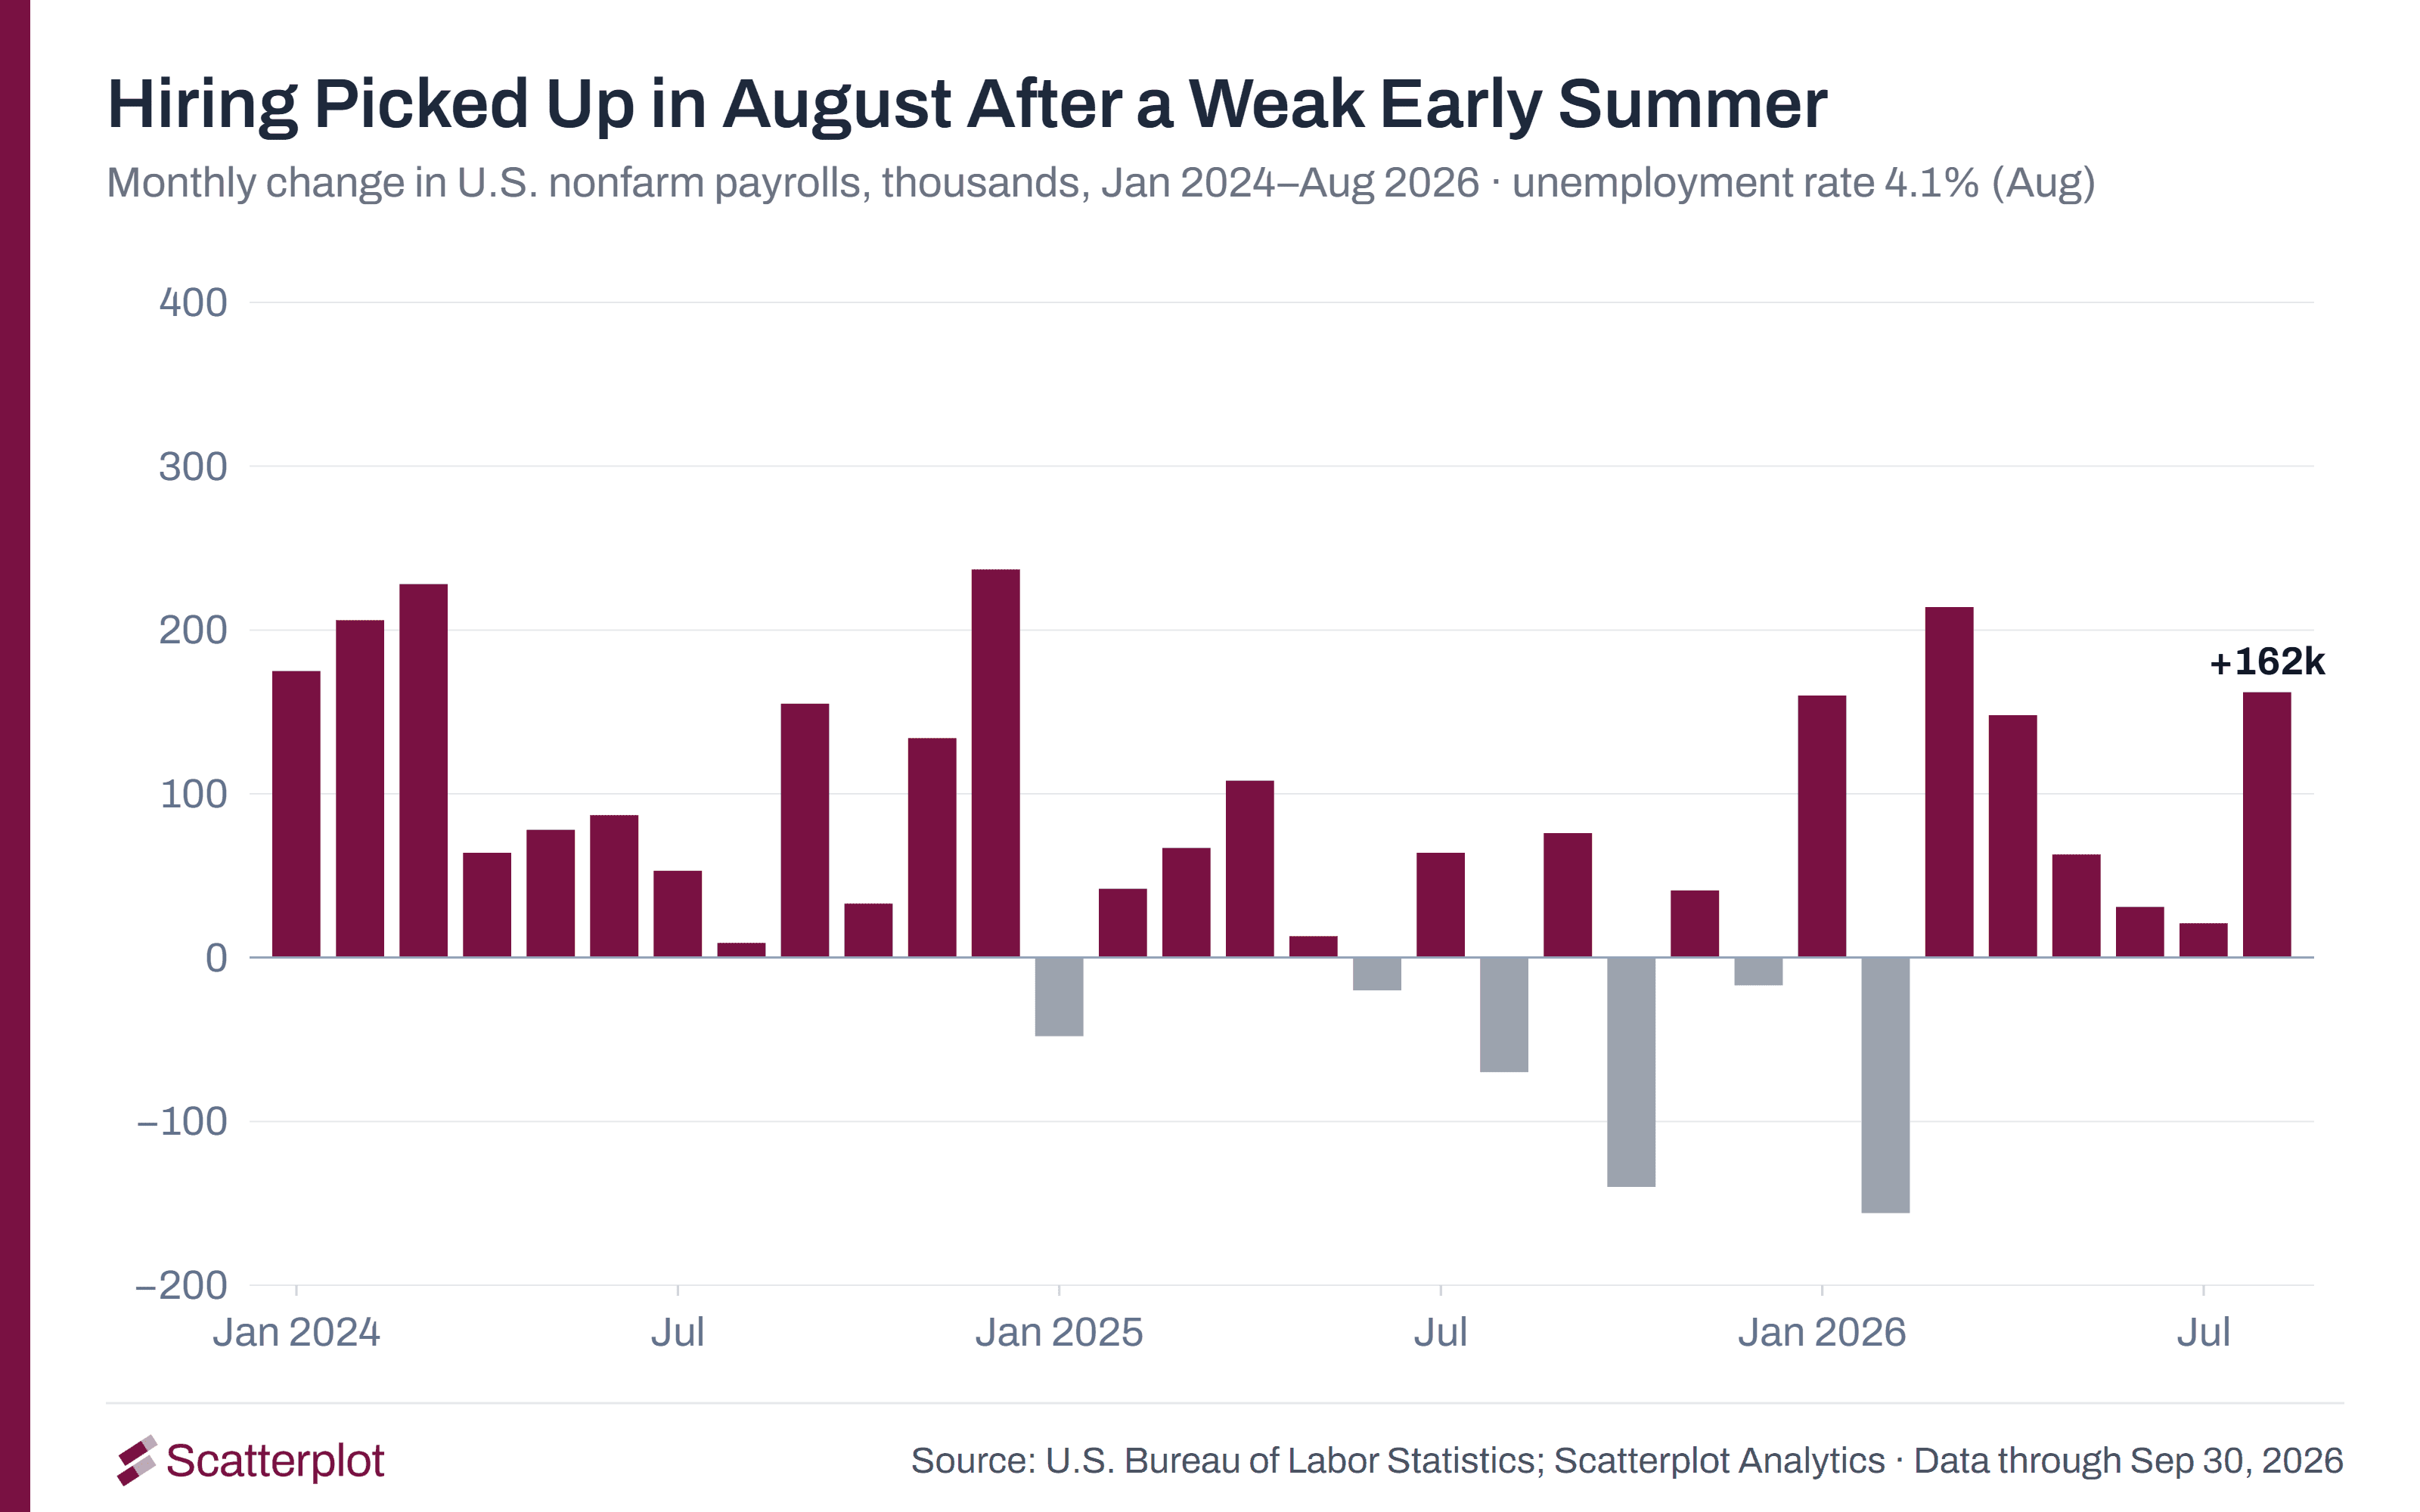
Chart notes
Periods. "September" means from the August 31 close to the September 30 close. "Year to date" means from the December 31, 2025 close to September 30, 2026. The third quarter runs from the June 30 close.
Returns. Stock, ETF and sector figures are total returns in U.S. dollars, with dividends reinvested on the ex-dividend date. Commodity, currency and Bitcoin figures are price changes.
Treasury yields. Daily par yield curve rates from the U.S. Department of the Treasury. "Highest close since May 2002" compares the September 30 close with every earlier daily close. The Treasury did not issue 30-year bonds from February 2002 to February 2006, so the 30-year series has a gap.
Federal funds rate. The upper bound of the Federal Reserve's target range. The 5.4% average is measured from 1971.
Inflation. Consumer price index (CPI), year-over-year change, not seasonally adjusted. Core CPI excludes food and energy. The 2% line is shown for reference. The Federal Reserve's 2% inflation goal is defined on a different measure, the personal consumption expenditures (PCE) price index.
Jobs. Monthly change in nonfarm payrolls, as revised to date.
Oil and diesel. Brent crude and NY Harbor ultra-low-sulfur diesel, continuous futures series. A continuous series moves to the next contract a few days before the current one expires. On September 30 the Brent series reflected the December contract, which was priced below the expiring November contract, so the September and since-February changes include the effect of that switch. For that reason the Iran-conflict chart does not compare oil with our earlier September 2026 Market Update.
Sectors. SPDR sector ETFs: XLK, XLC, XLV, XLE, XLI, XLP, XLU, XLY, XLRE, XLF and XLB.
Regions. VT (world), SPY (U.S.), ACWX (world ex-U.S.), EFA (developed markets ex-U.S.), IEMG (emerging markets) and EZU (Eurozone).
U.S. equities are represented by the SPY ETF. Semiconductor stocks are represented by the SOXX ETF.
Magnificent Seven average. An equal-weighted average of the total returns of Apple, Microsoft, Nvidia, Amazon, Alphabet, Meta and Tesla over each period, with equal amounts in each stock at the start and no rebalancing. It is an illustration, not an investable product, and does not reflect fees, taxes or trading costs.
Distance from record. Each day's SPY total-return level compared with its highest earlier level since 1993. The latest record close was on August 13, 2026.
Iran conflict returns. From the February 27, 2026 close, the last close before February 28, to September 30. Assets: SPY, EEM, EFA, SHY (1–3 year Treasuries), TLT (20+ year Treasuries), Brent crude, spot gold and the U.S. Dollar Index. The open circles use the figures published in our earlier September 2026 Market Update, with data to September 10.
U.S. dollar. The U.S. Dollar Index, which measures the dollar against the euro, yen, pound, Canadian dollar, Swiss franc and Swedish krona.
Sources
U.S. Department of the Treasury: daily Treasury par yield curve rates
Federal Reserve: federal funds target range
U.S. Bureau of Labor Statistics: consumer price index, nonfarm payrolls, unemployment rate
Finnhub: stock and ETF prices and dividends
Scatterplot Analytics: calculations and charts.
Important disclosures
This article is for informational and educational purposes only. It is not personalized investment advice or a recommendation to buy, sell or hold any security. References to specific securities, sectors and funds are provided to illustrate general market concepts. All investments involve risk, including the loss of principal. Past performance is no guarantee of future results.
Returns shown are based on ETFs, stocks, futures and spot prices and do not represent any specific account. Total returns assume dividends are reinvested and do not reflect taxes or transaction costs. ETF performance may differ from the underlying index because of fees and expenses. Futures prices are wholesale benchmarks and do not reflect the performance of any investment product.
Returns across different asset classes are not directly comparable, because they differ in risk, volatility and market dynamics. Commodity, currency and digital asset investments are volatile and subject to significant risk. Digital assets, including Bitcoin, may involve additional risks such as regulatory, technological and liquidity risks. Sector-concentrated investments may involve greater risk than diversified investments.
Data from third-party sources is believed to be reliable, but its accuracy, completeness and reliability cannot be guaranteed. Figures in this article are as of September 30, 2026. The live charts on scatterplot.co update as new data arrives and may show different figures.
Preparing your Q3 client update?
Every chart in this recap was built in-house by Scatterplot's research team, using data from the U.S. Treasury, the Bureau of Labor Statistics, the Federal Reserve and market data providers. Live versions of most of them are in the Scatterplot portal, updated daily and branded with your firm's logo and colors, ready to drop into a client presentation or quarterly letter.
Start a 7-day free trial, or get in touch if you need custom charts, and we'll help you put your Q3 update together.


Enjoyed this? Get more in your inbox.
Weekly insights for advisors
— charts, research, and practical tools. No fluff.
Market Insights
Why $100 Oil Hurts the U.S. Economy Less Than It Used To
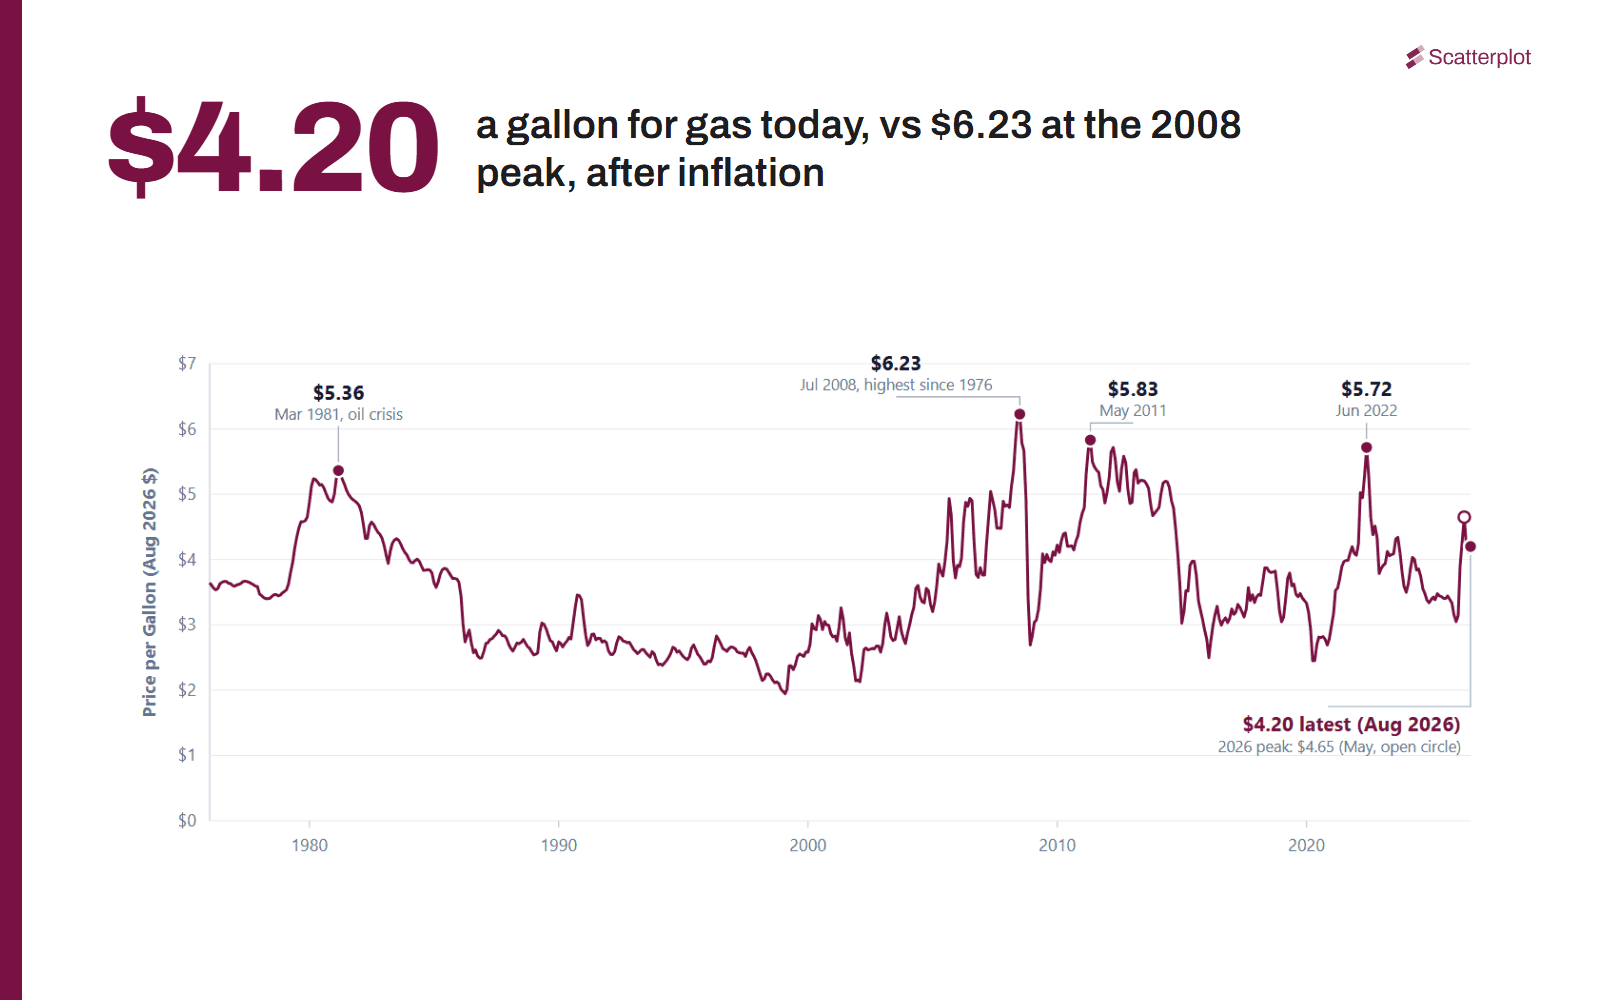
Brent crude has traded above $100 a barrel repeatedly this year. That still stings. But the U.S. economy is less exposed to high oil prices than it was in the past, for three reasons.
Read moreSanjeev Pati, CFA
September 28, 2026 · 5 min read
Investment Foundations
Fed Rate Hikes Since 1994: What Happened in Each Cycle
Inflation, unemployment and equity returns across seven Fed rate-hike episodes since 1994, each with its start, end and accompanying FOMC statement.
Read moreSeptember 21, 2026 · 10 min read