

Why $100 Oil Hurts the U.S. Economy Less Than It Used To
Brent crude has traded above $100 a barrel repeatedly this year. That still stings. But the U.S. economy is less exposed to high oil prices than it was in the past, for three reasons.


Sanjeev Pati, CFA
Founder, Scatterplot
Key takeaways
- Gas costs less than at past peaks, after inflation. In August 2026, regular gas averaged $4.20 a gallon, 22% to 33% below the 1981, 2008, 2011 and 2022 peaks in today's dollars [2].
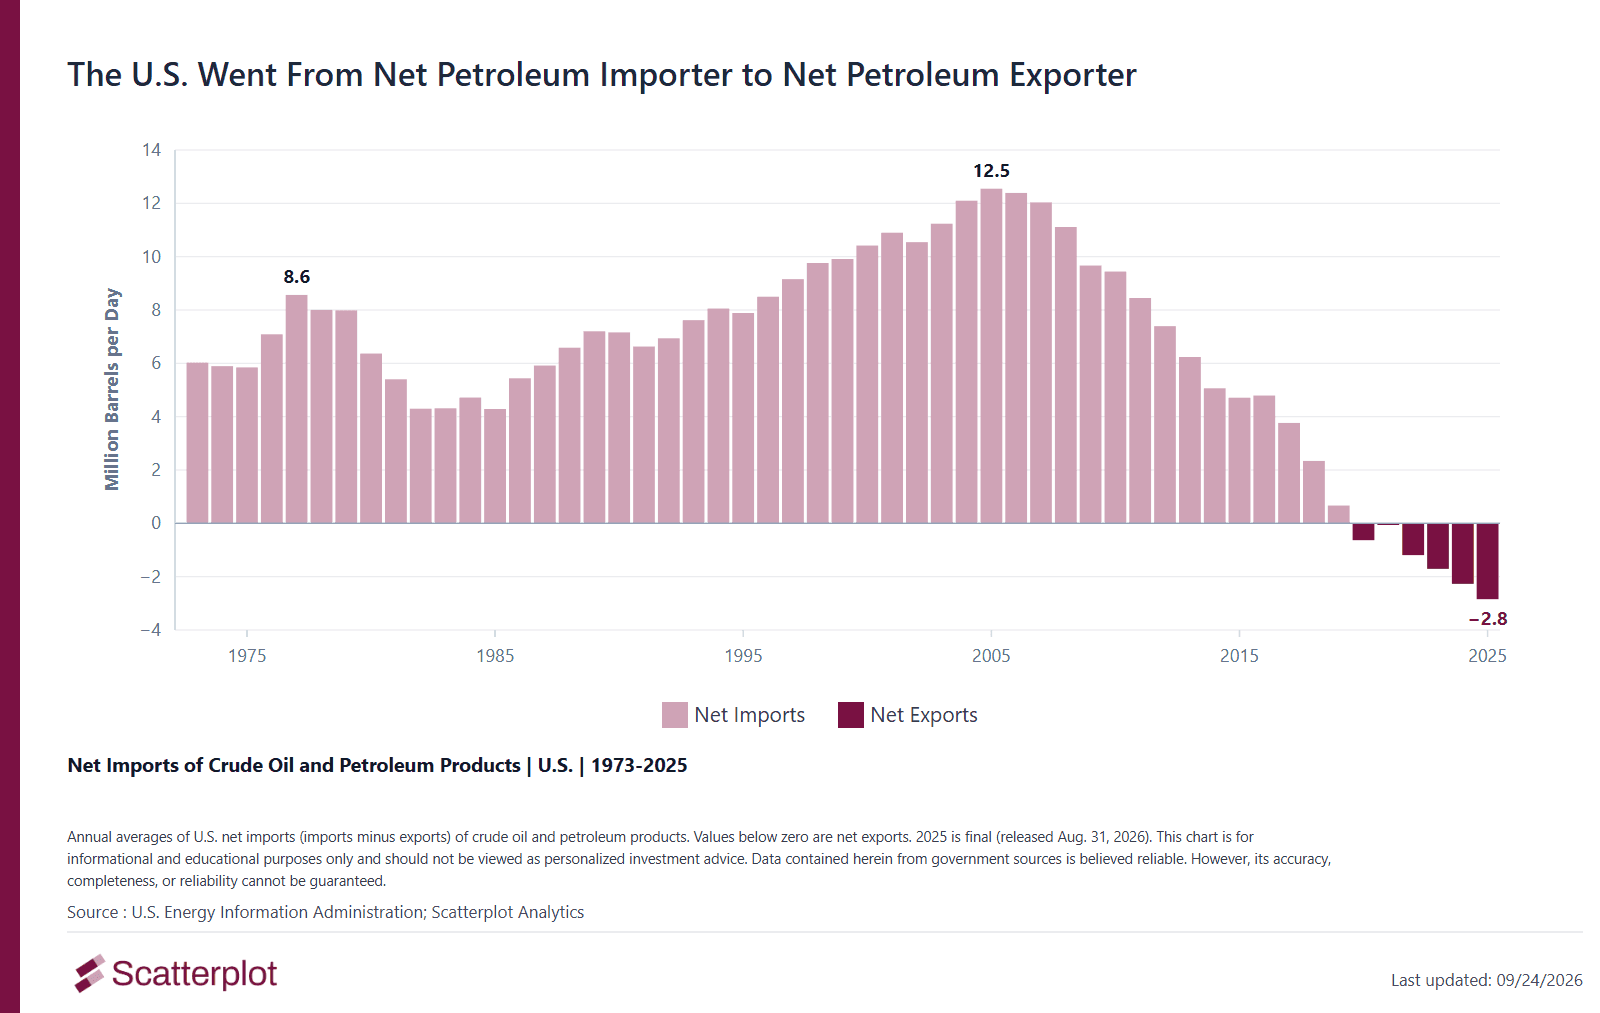
- The U.S. now exports more petroleum than it imports. It has been a net exporter of crude oil and petroleum products combined every year since 2020 [3].
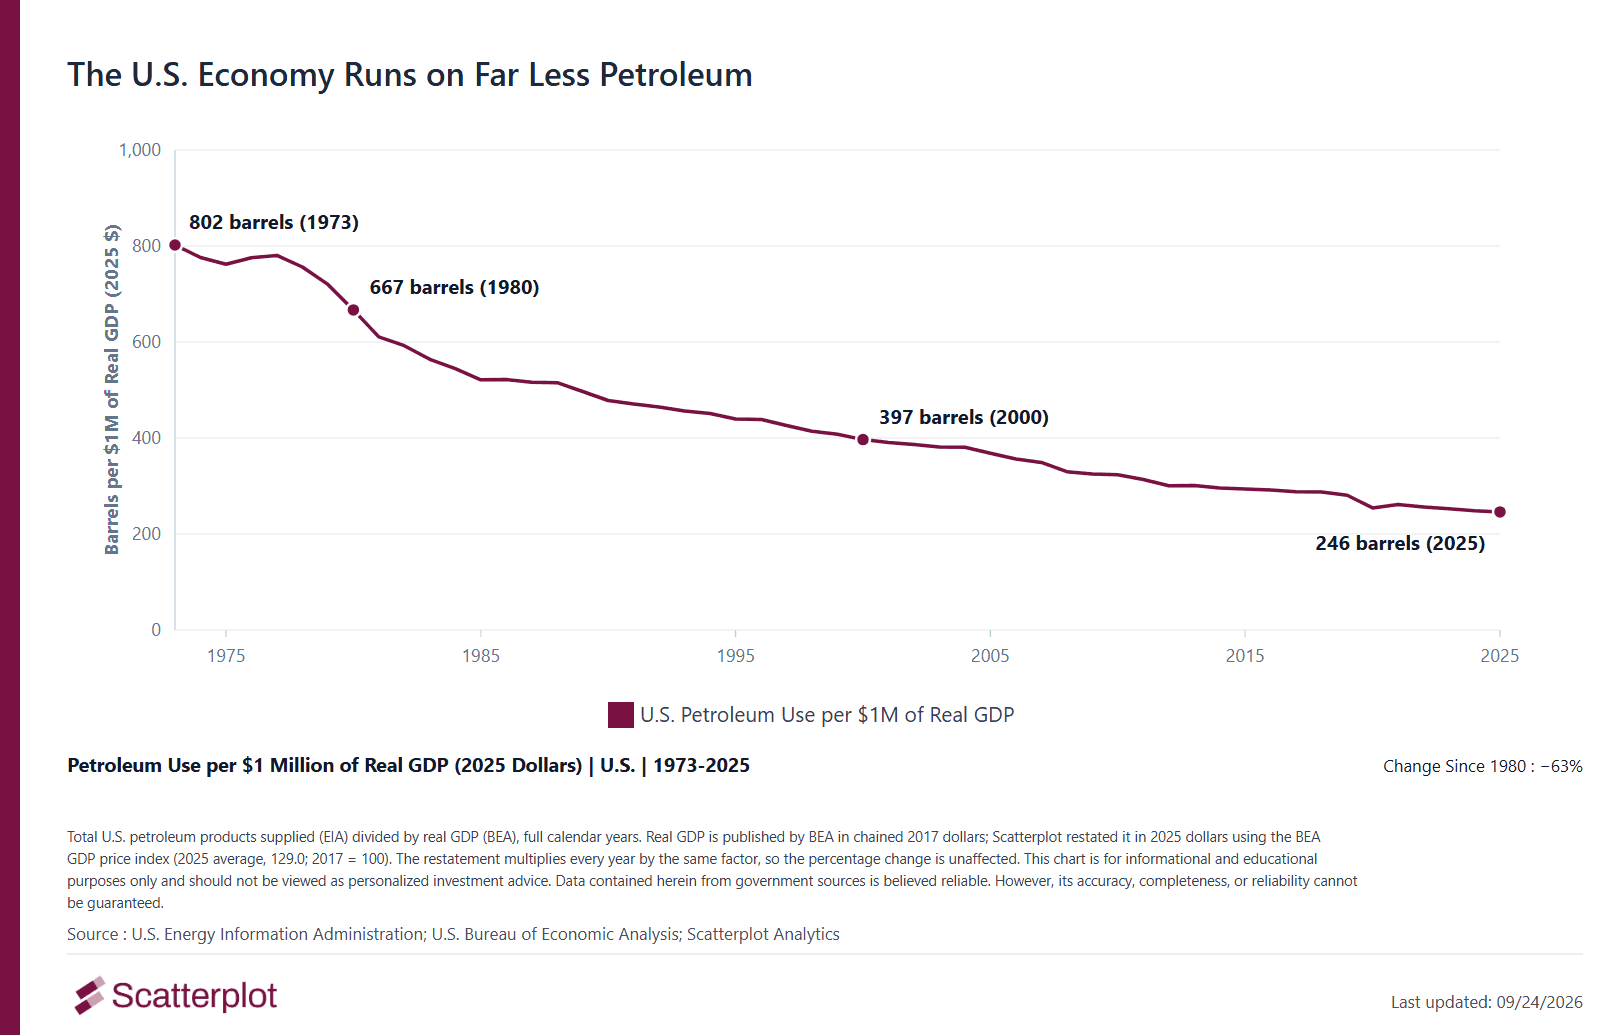
- The economy uses far less petroleum. The U.S. uses 63% less petroleum per $1 million of real GDP than it did in 1980 [3][4].
Is gas more expensive than at past price spikes?
No. After inflation, the latest price of $4.20 a gallon is below every major spike of the past 45 years. The graph below shows the monthly U.S. average price of regular gasoline since 1976, adjusted for inflation to August 2026 dollars.
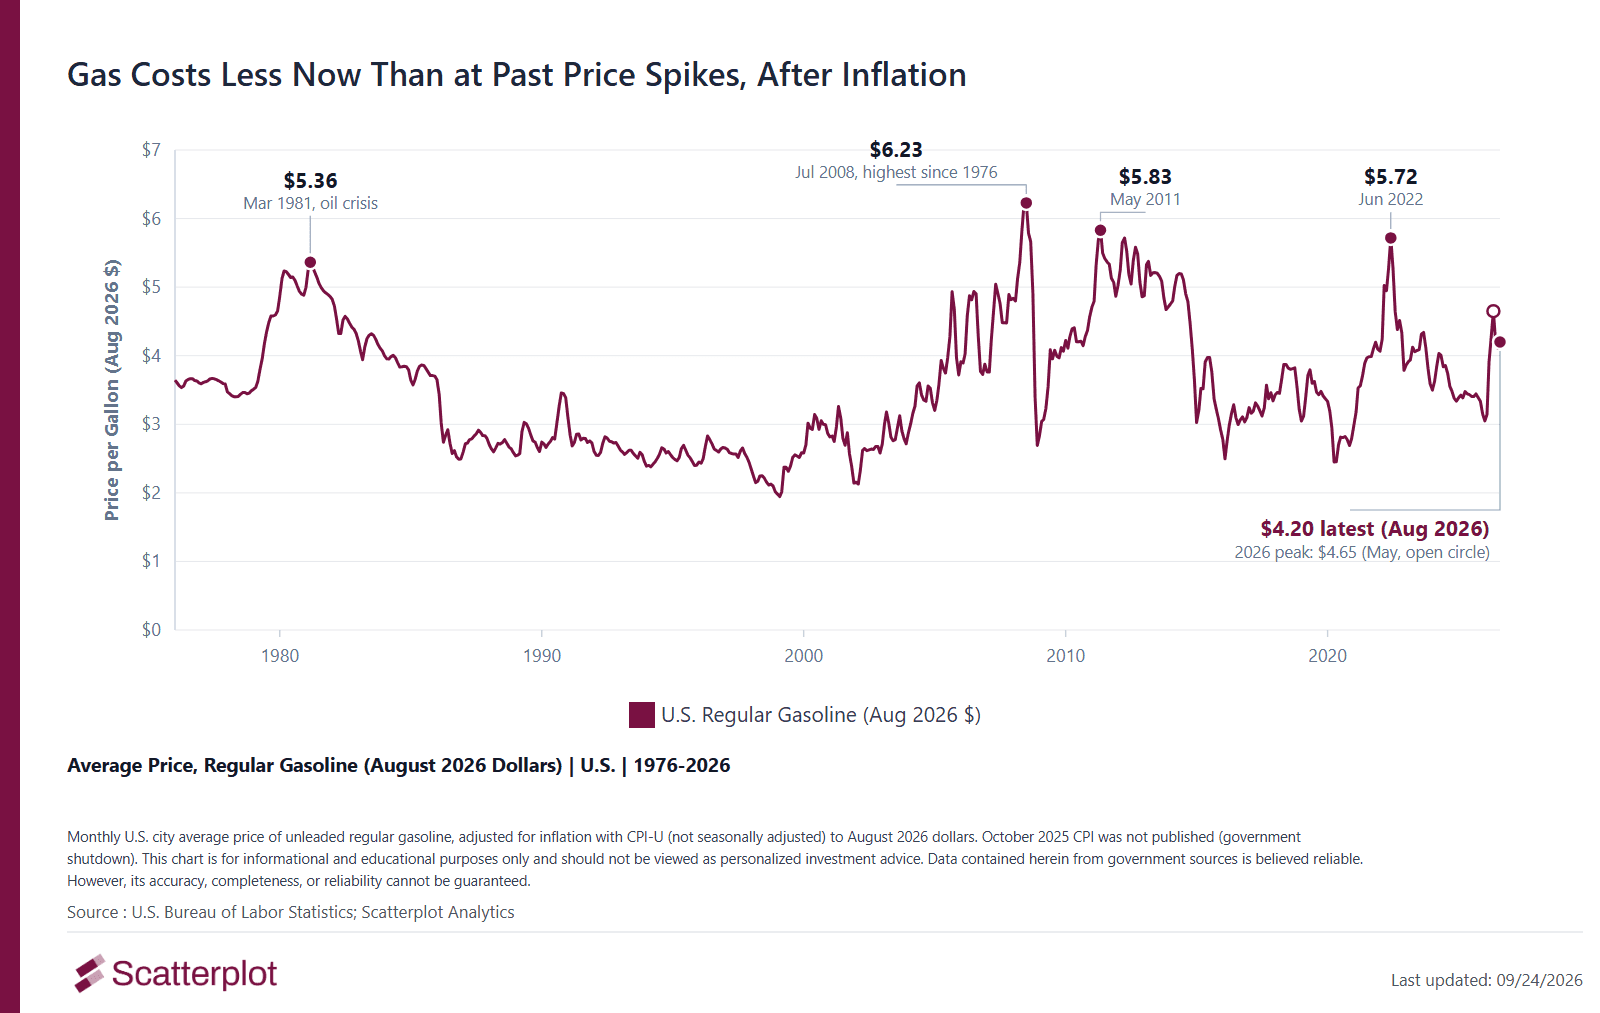
In today's dollars, gas hit $6.23 in July 2008 and $5.72 in June 2022. This year's high so far was $4.65, in May [2].
The U.S. used to be a net petroleum importer. Now it's a net exporter.
For decades, the U.S. bought more crude oil and petroleum products than it sold. In 2005, it imported a net 12.5 million barrels a day. Since 2020, counting crude oil and petroleum products together, it has exported more than it imports. In 2025, it exported a net 2.8 million barrels a day. It still imports more crude oil alone than it exports, about 2.2 million barrels a day on net in 2025 [3]. As a net exporter, the U.S. also earns "higher net oil income" when prices rise, which partly offsets the hit, the Dallas Fed notes [5].
The graph below shows U.S. net imports of crude oil and petroleum products each year since 1973. Bars below zero are net exports.
How much petroleum does the economy need?
Far less than before. In 1980, the U.S. used 667 barrels of petroleum for every $1 million of real GDP (in 2025 dollars). In 2025, it used 246 [3][4]. The graph below shows how many barrels of petroleum the U.S. used for each $1 million of real GDP, in 2025 dollars, since 1973.
What does the research say?
The Federal Reserve Bank of Dallas estimates that losing 15% of the world's oil supply, as happened after the 2026 Iran war began, would have cut annualized U.S. real GDP growth by 5.6 percentage points in 1980. Using a model calibrated to the U.S. economy in 2024, the same shock reduces annualized growth by 0.3 percentage points, "one-twentieth of the 1980 decline." These are model estimates [5].
Household budgets tell a similar story. Spending on gasoline and other energy goods rose to 2.24% of disposable income in the second quarter of 2026, the highest since the third quarter of 2023. That is below the 3.02% of mid-2022 and less than half the roughly 5% of 1980 [6].
Where it still hurts
Some costs are high. The average price of diesel reached $6.53 a gallon in the week of September 21, 2026, a record in EIA's weekly series, which begins in 1994, and up from $3.75 a year earlier [7]. Energy prices in the consumer price index were 16.3% higher in August than a year earlier [8].
The bottom line
High oil prices still matter. But compared with past oil shocks, gasoline remains below prior major price spikes after inflation, the U.S. exports more petroleum than it imports, on net, and the economy needs much less petroleum to grow.
FAQ
Why does $100 oil hurt the U.S. economy less than it used to?
The U.S. uses 63% less petroleum per $1 million of real GDP than in 1980, has been a net exporter of crude oil and petroleum products combined since 2020, and gasoline remains below past peaks after inflation [2][3][4].
Is gas more expensive now than in 2008?
Not after inflation. Regular gas averaged $4.20 a gallon in August 2026, compared with $6.23 in July 2008 in today's dollars [2].
Is the U.S. a net petroleum exporter?
Yes, counting crude oil and petroleum products together. It has exported more than it imported every year from 2020 through 2025. It still imports more crude oil alone than it exports [3].
Sources
- U.S. Energy Information Administration, Brent crude oil spot price, daily (FRED series DCOILBRENTEU), through Sept. 22, 2026
- U.S. Bureau of Labor Statistics, average price of regular gasoline, U.S. city average, and CPI-U, not seasonally adjusted, through August 2026; inflation adjustment by Scatterplot
- U.S. Energy Information Administration, net imports of crude oil and petroleum products and product supplied of crude oil and petroleum products, annual (released Aug. 31, 2026); crude oil net imports (MCRNTUS2)
- U.S. Bureau of Economic Analysis, real GDP and GDP price index (FRED series GDPC1, GDP, GDPDEF); restated in 2025 dollars by Scatterplot
- Federal Reserve Bank of Dallas, U.S. economy less vulnerable to geopolitical oil price shocks than in the past (June 23, 2026)
- U.S. Bureau of Economic Analysis, personal consumption expenditures on gasoline and other energy goods, and disposable personal income (FRED series DGOERC1Q027SBEA and DPI); calculations by Scatterplot
- U.S. Energy Information Administration, U.S. diesel retail price, weekly (FRED series GASDESW)
- U.S. Bureau of Labor Statistics, CPI-U energy index, not seasonally adjusted (CUUR0000SA0E), 12-month change
Important disclosures
This article is for informational and educational purposes only and should not be viewed as personalized investment advice. It uses U.S. government data; inflation adjustments and ratios are Scatterplot calculations. The Dallas Fed figures are model estimates, not observed results. Data is believed reliable, but its accuracy, completeness or reliability cannot be guaranteed. Please talk with a financial professional about your own situation.


Enjoyed this? Get more in your inbox.
Weekly insights for advisors
— charts, research, and practical tools. No fluff.
Investment Foundations
Fed Rate Hikes Since 1994: What Happened in Each Cycle
Inflation, unemployment and equity returns across seven Fed rate-hike episodes since 1994, each with its start, end and accompanying FOMC statement.
Read moreSeptember 21, 2026 · 10 min read
Market Insights
September 2026 Market Update: Oil Up, Gold and Long-Term Treasuries Down Since the Iran Conflict
September 2026 market update: U.S. stocks sit 2.6% below their August high, and gold and long-term Treasuries are down since the Iran conflict. 10 charts.
Read moreSanjeev Pati, CFA
September 11, 2026 · 10 min read