
The K-Shaped Economy: Consumer Confidence and Equity Markets Have Never Disagreed This Much
Consumer confidence is at an all-time low. The stock market is at an all-time high. The gap between them has never been wider.

Sanjeev Pati, CFA
Founder, Scatterplot
Key takeaways
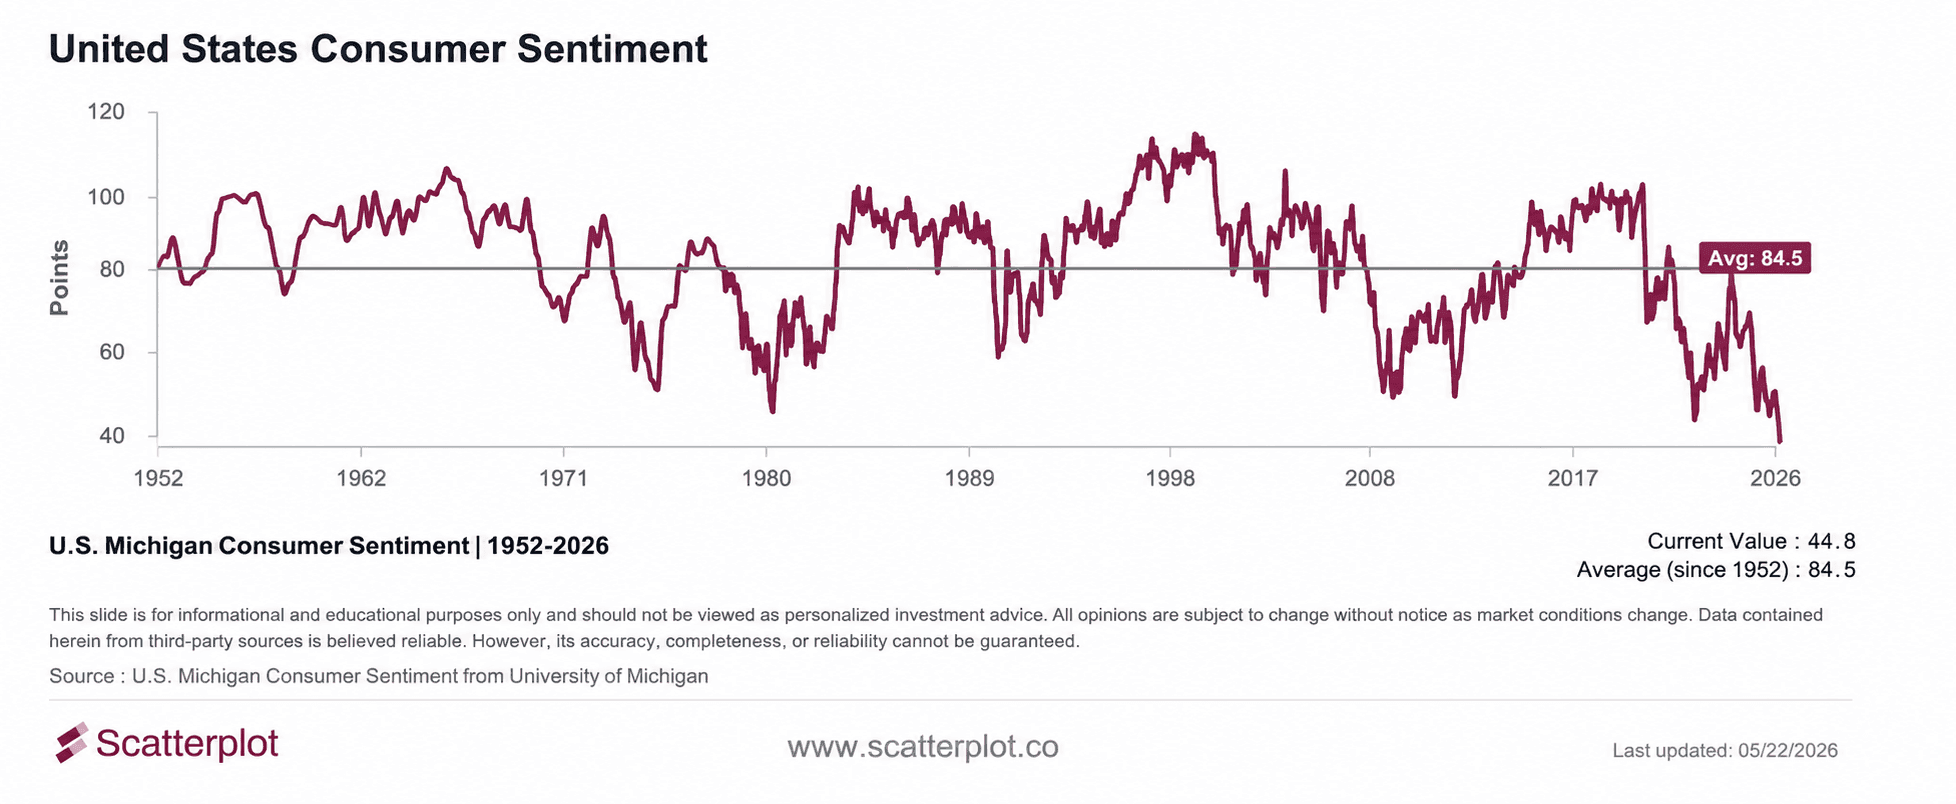
- The U.S. Michigan Consumer Sentiment Index – a monthly survey of how Americans feel about the economy – came in at 44.8 in May 2026, the lowest reading ever recorded in its 70-year history. Since March 2025, confidence has been below 60 in 13 of the last 15 months, the most sustained period of low confidence ever recorded.
- Every time in the past 30 years that consumer confidence fell this low, the stock market fell too. This time, with confidence at an all-time low, the S&P 500 is up over 35%.
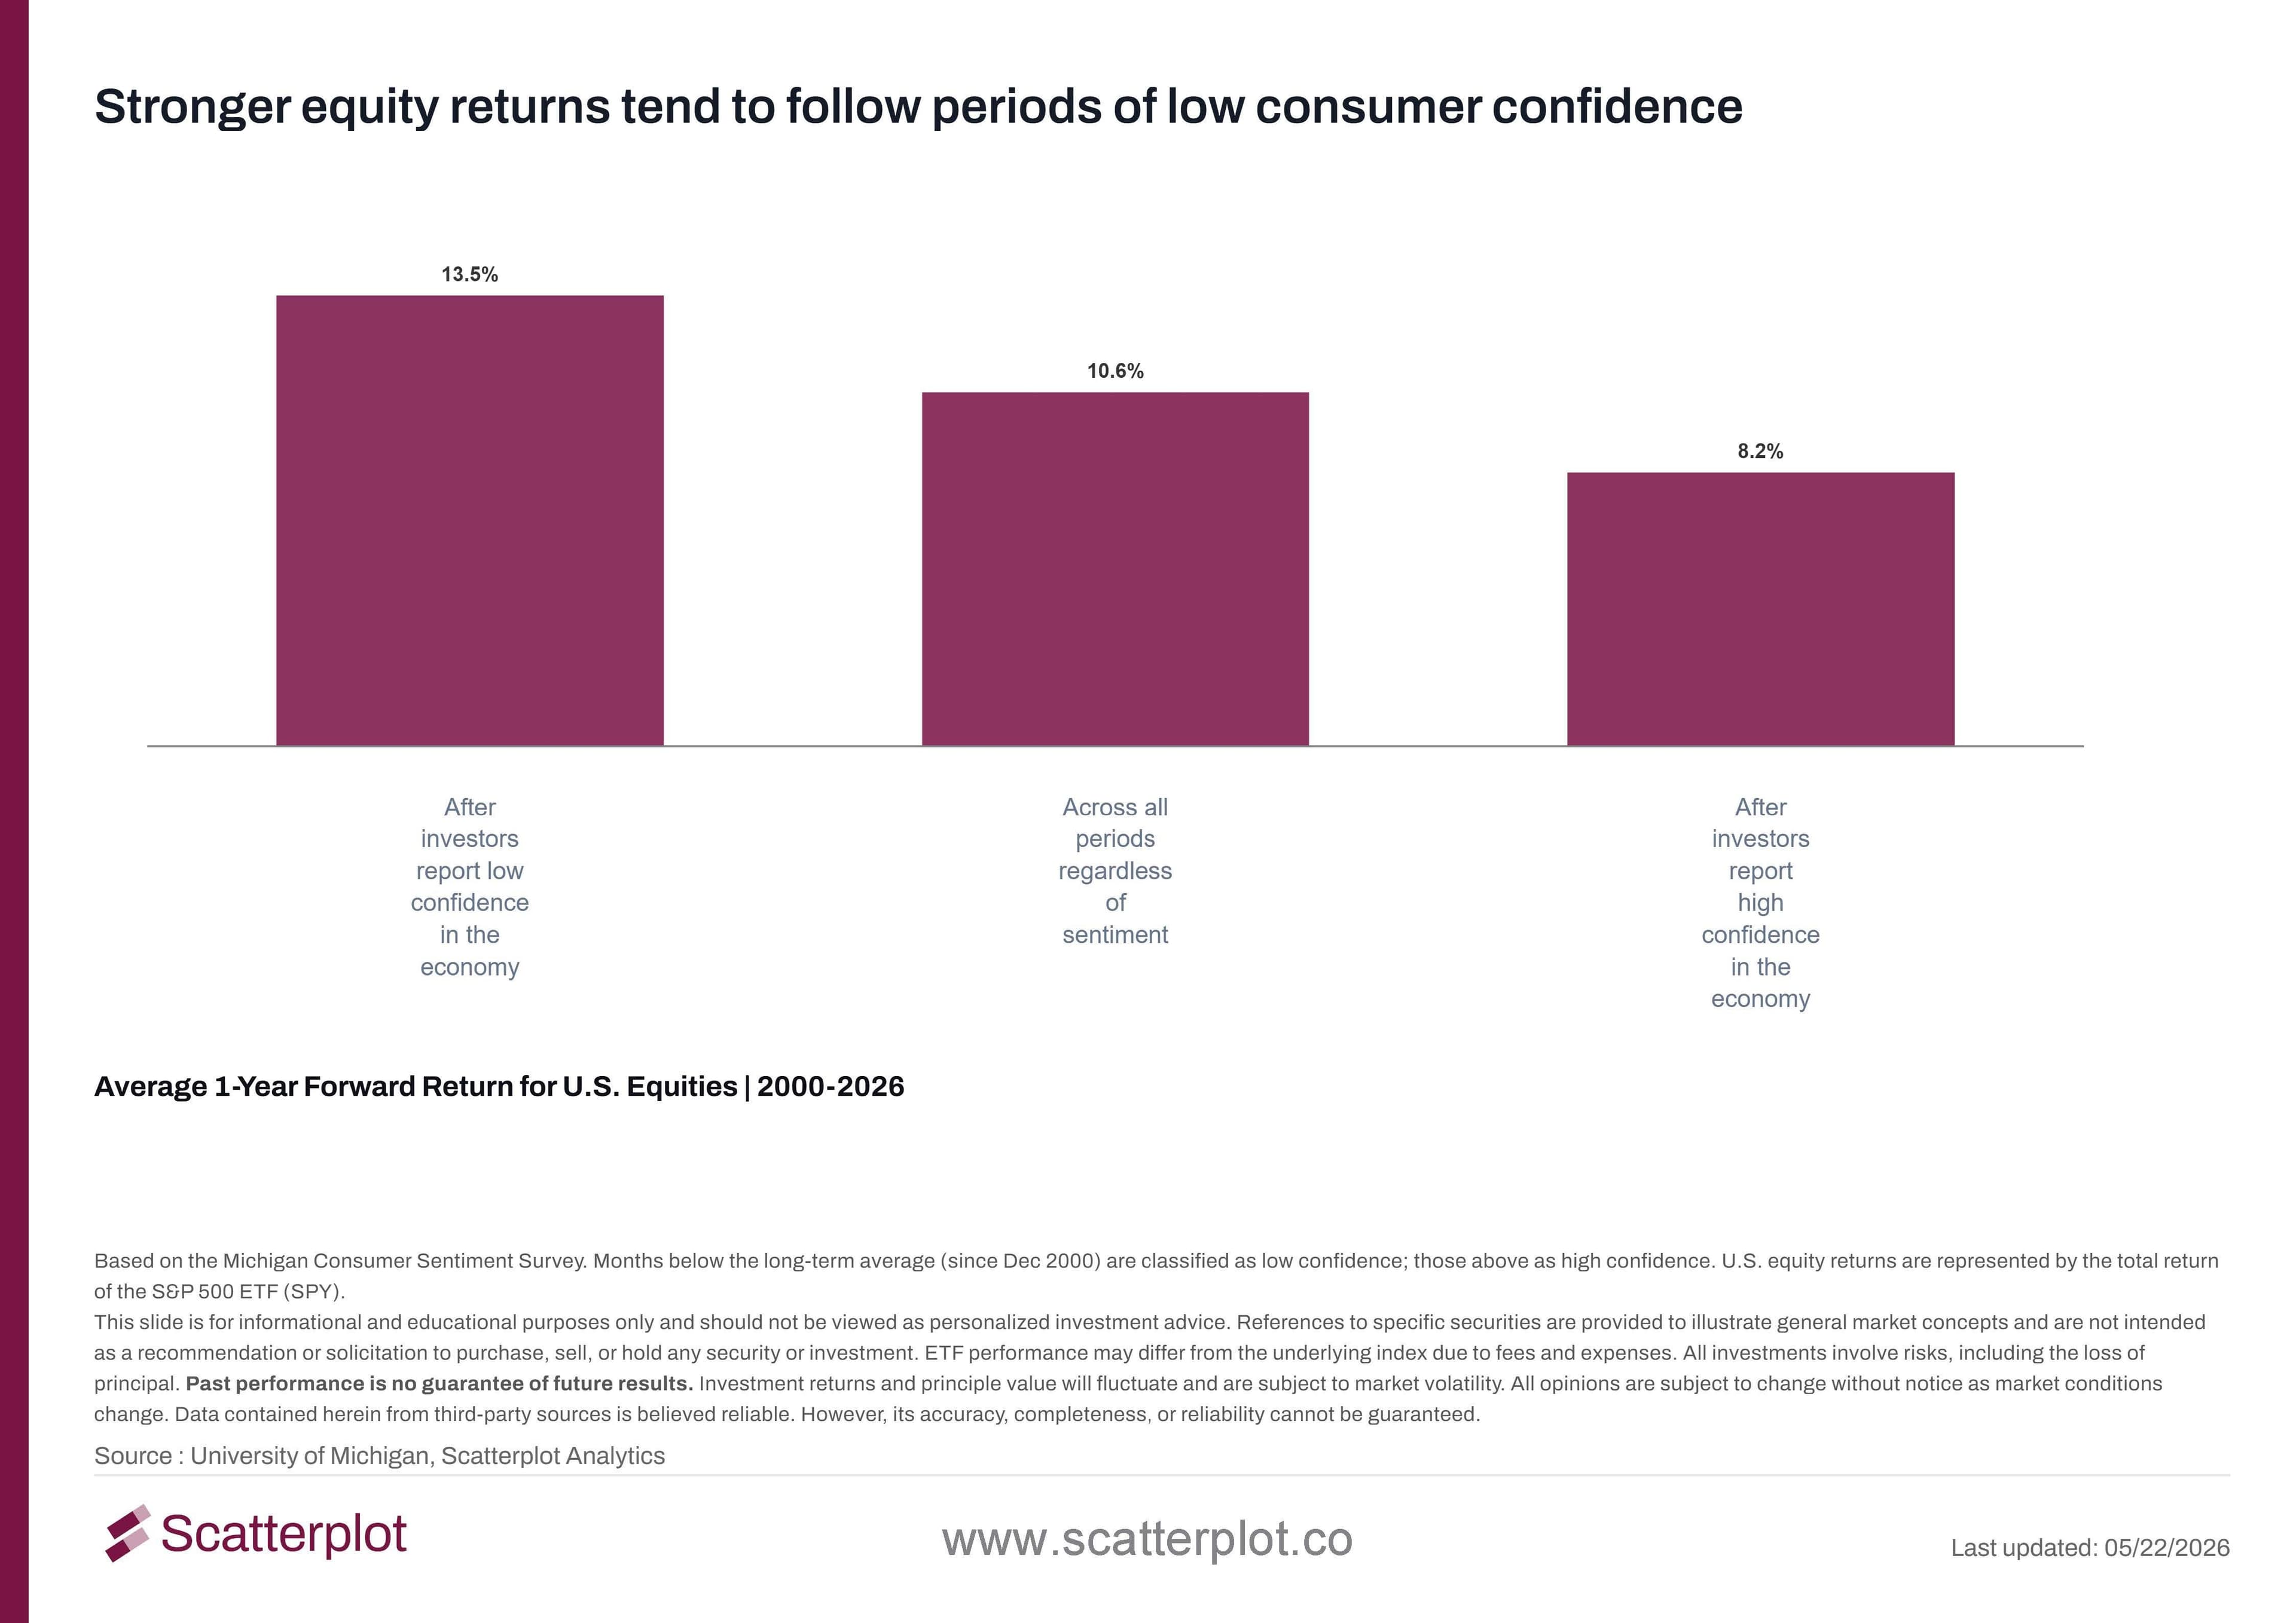
- Studying the 12-month forward returns of U.S. equities after periods of low confidence shows stocks have historically averaged 13.5% in the year after investors reported low confidence in the economy, compared to 10.6% across all periods and just 8.2% after periods of high confidence. Historically, the pessimism has gotten priced in and the market has moved on.
- The current episode is different from any prior one: confidence is falling while markets hit all-time highs. This raises a genuine question about whether consumer confidence and stock market performance have any connection at all.
Introduction
The current consumer confidence is at an all-time low and has been for over a year now. The stock market is at an all-time high. Both of those things are true at the same time and the gap between them is wider than at any point in recorded history.
The Michigan Consumer Sentiment Index has a long-run average of 84.5 going back to 1952. A reading below 60 represents a level of pessimism that is roughly 30% below that average, historically rare and associated with periods of genuine economic stress. To understand what this means, we went back through 30 years of data where consumer confidence fell below 60. We looked at what was happening at the time, how long the episode lasted, and what the stock market did while it was going on.
We also looked at forward equity returns across low, high, and all confidence levels to see how markets performed in the 12 months that followed. The results are striking.
Confidence vs Equity Markets
The University of Michigan Consumer Sentiment Survey has tracked U.S. consumer confidence since 1952. Each month, hundreds of U.S. households are asked how they feel about their own finances, the economy right now, and where things are headed over the next year. The answers are combined into a single number.
The higher the number, the more confident consumers feel. The long-run average since 1952 is 84.5. The current reading of 44.8 is nearly half that average and the lowest ever recorded in the survey's 70-year history.
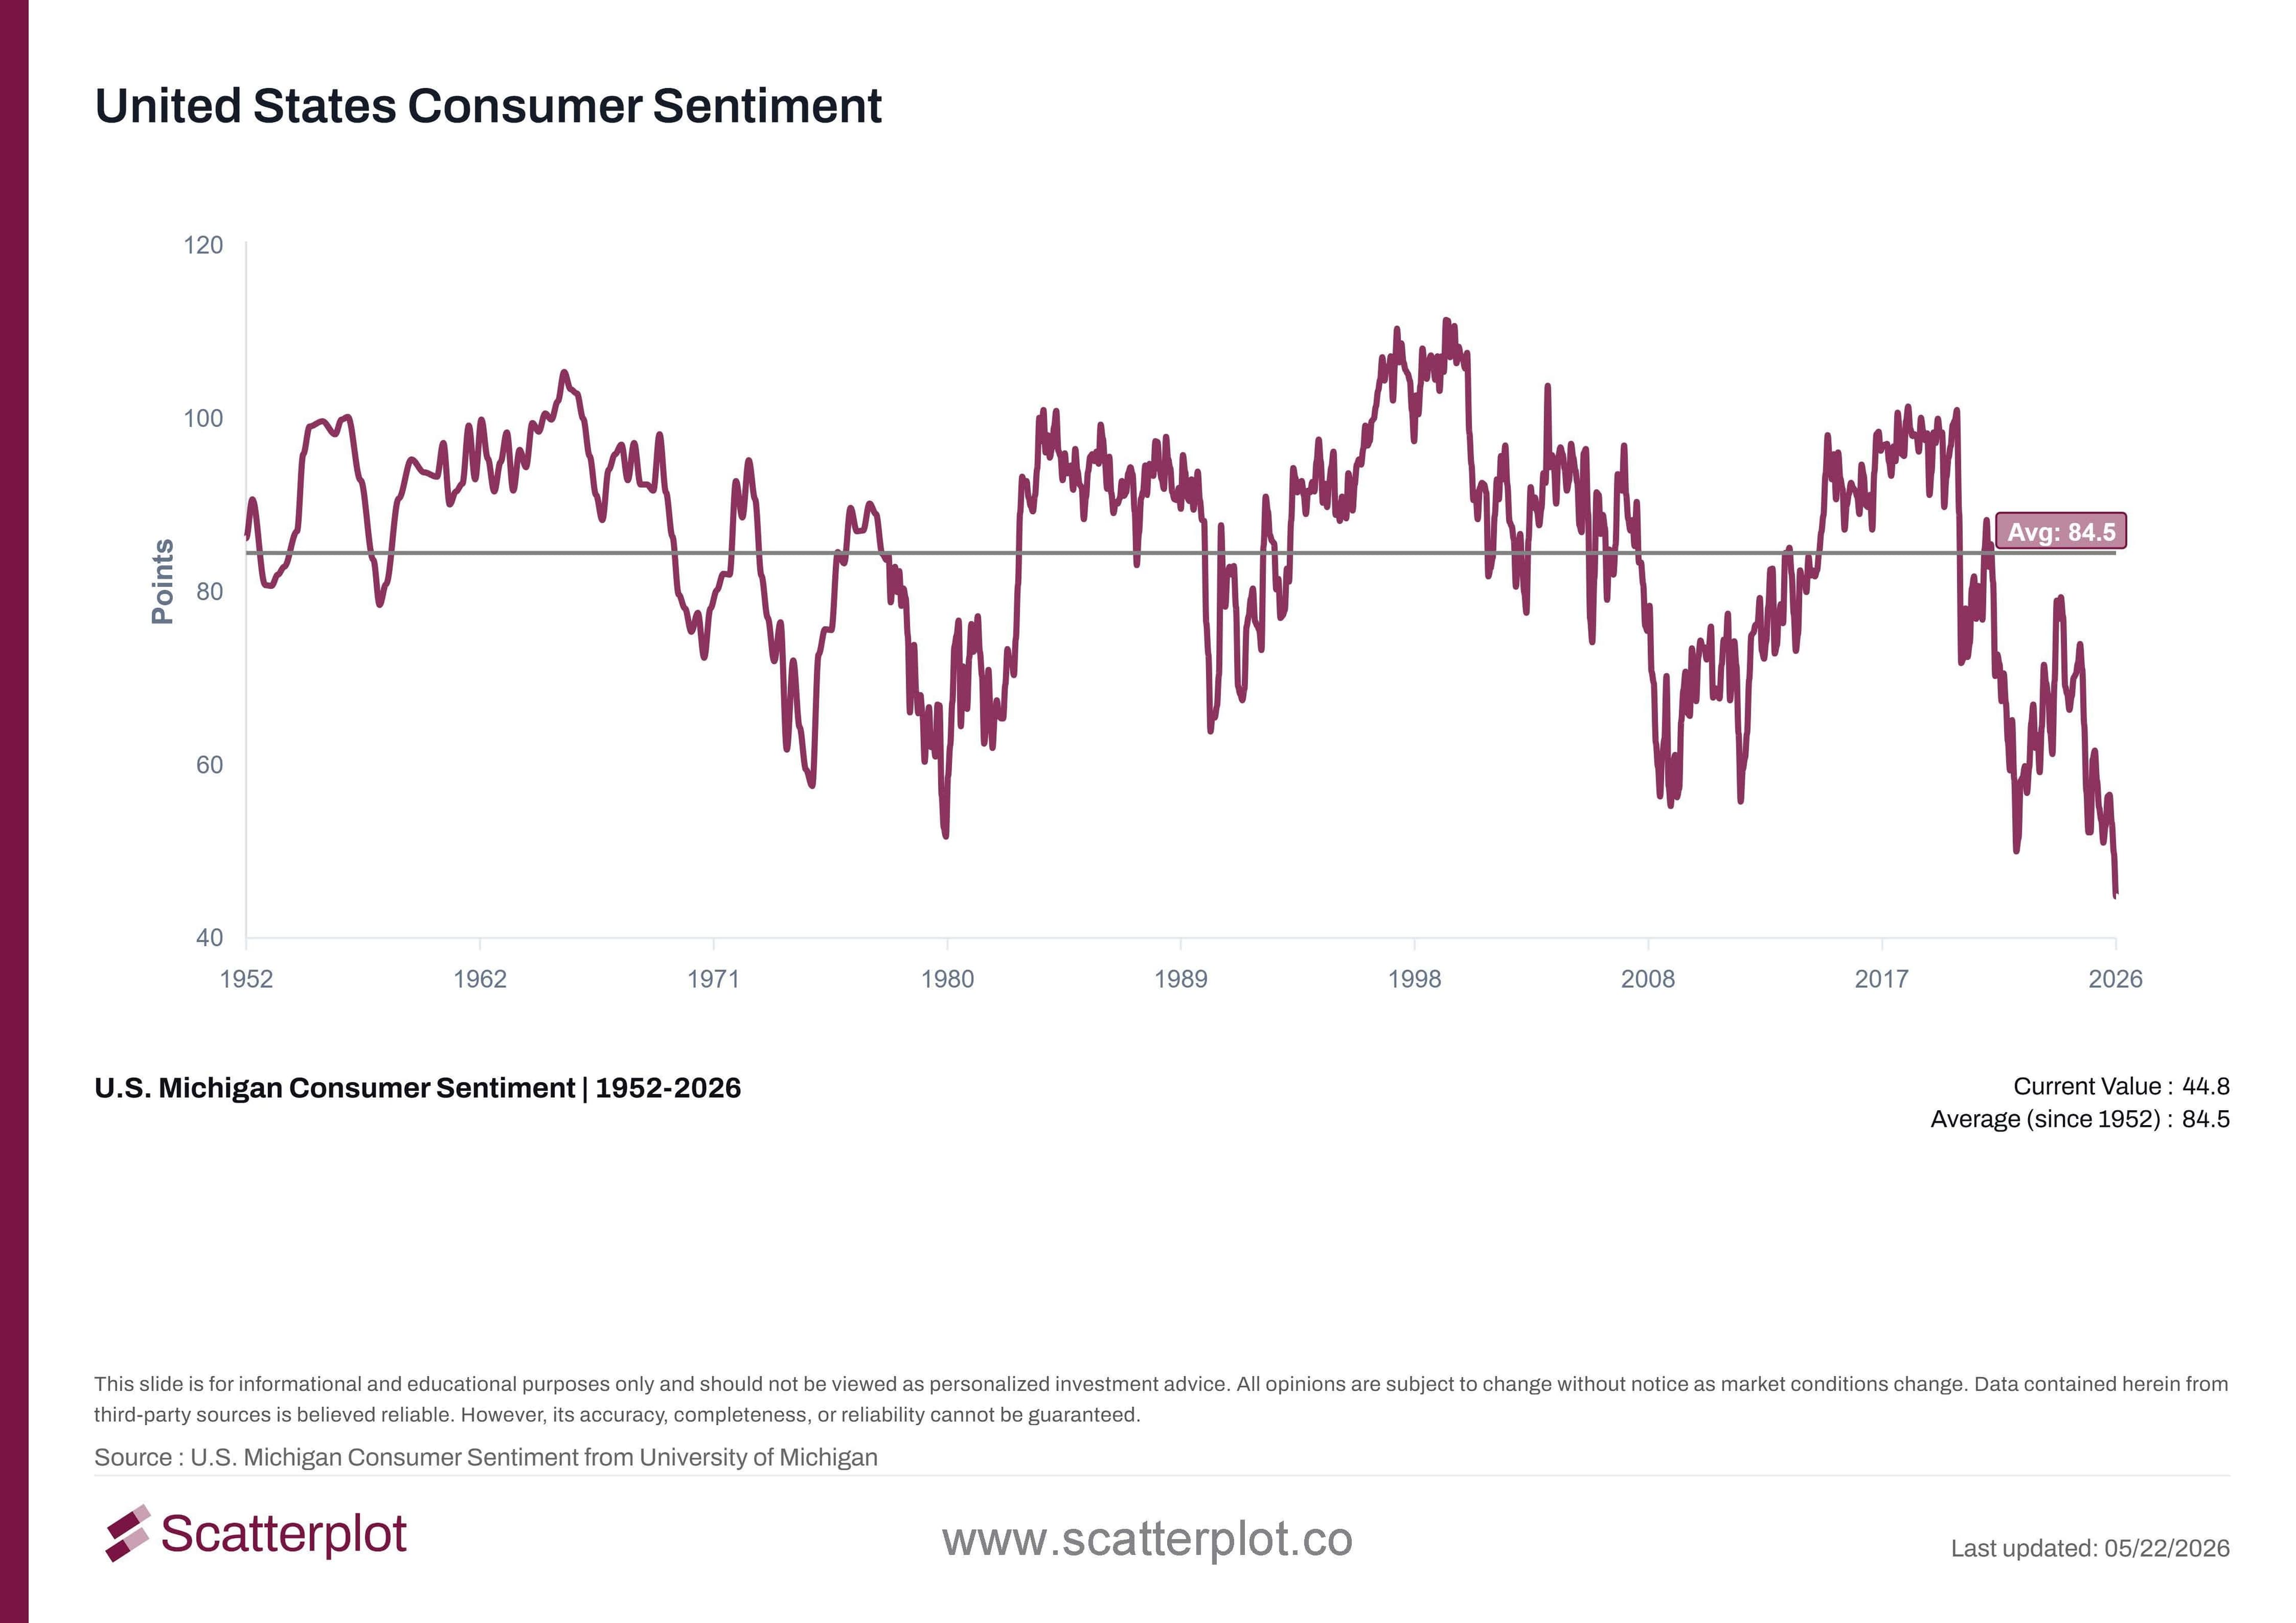
This chart updates daily. Track it live at scatterplot.co
Since March 2025, confidence has been below 60 in 13 of the last 15 months. The longest unbroken stretch is the current run of 10 consecutive months from August 2025, which is itself a record. Prior to this episode, the longest single stretch below 60 was 8 months, during the 2022 rate hike cycle. The trough keeps moving lower.
Meanwhile, the U.S. equity market tells a very different story. Whether you look at the market-cap weighted S&P 500 or the equal-weighted version, both are near all-time highs. The chart below shows year-to-date performance.
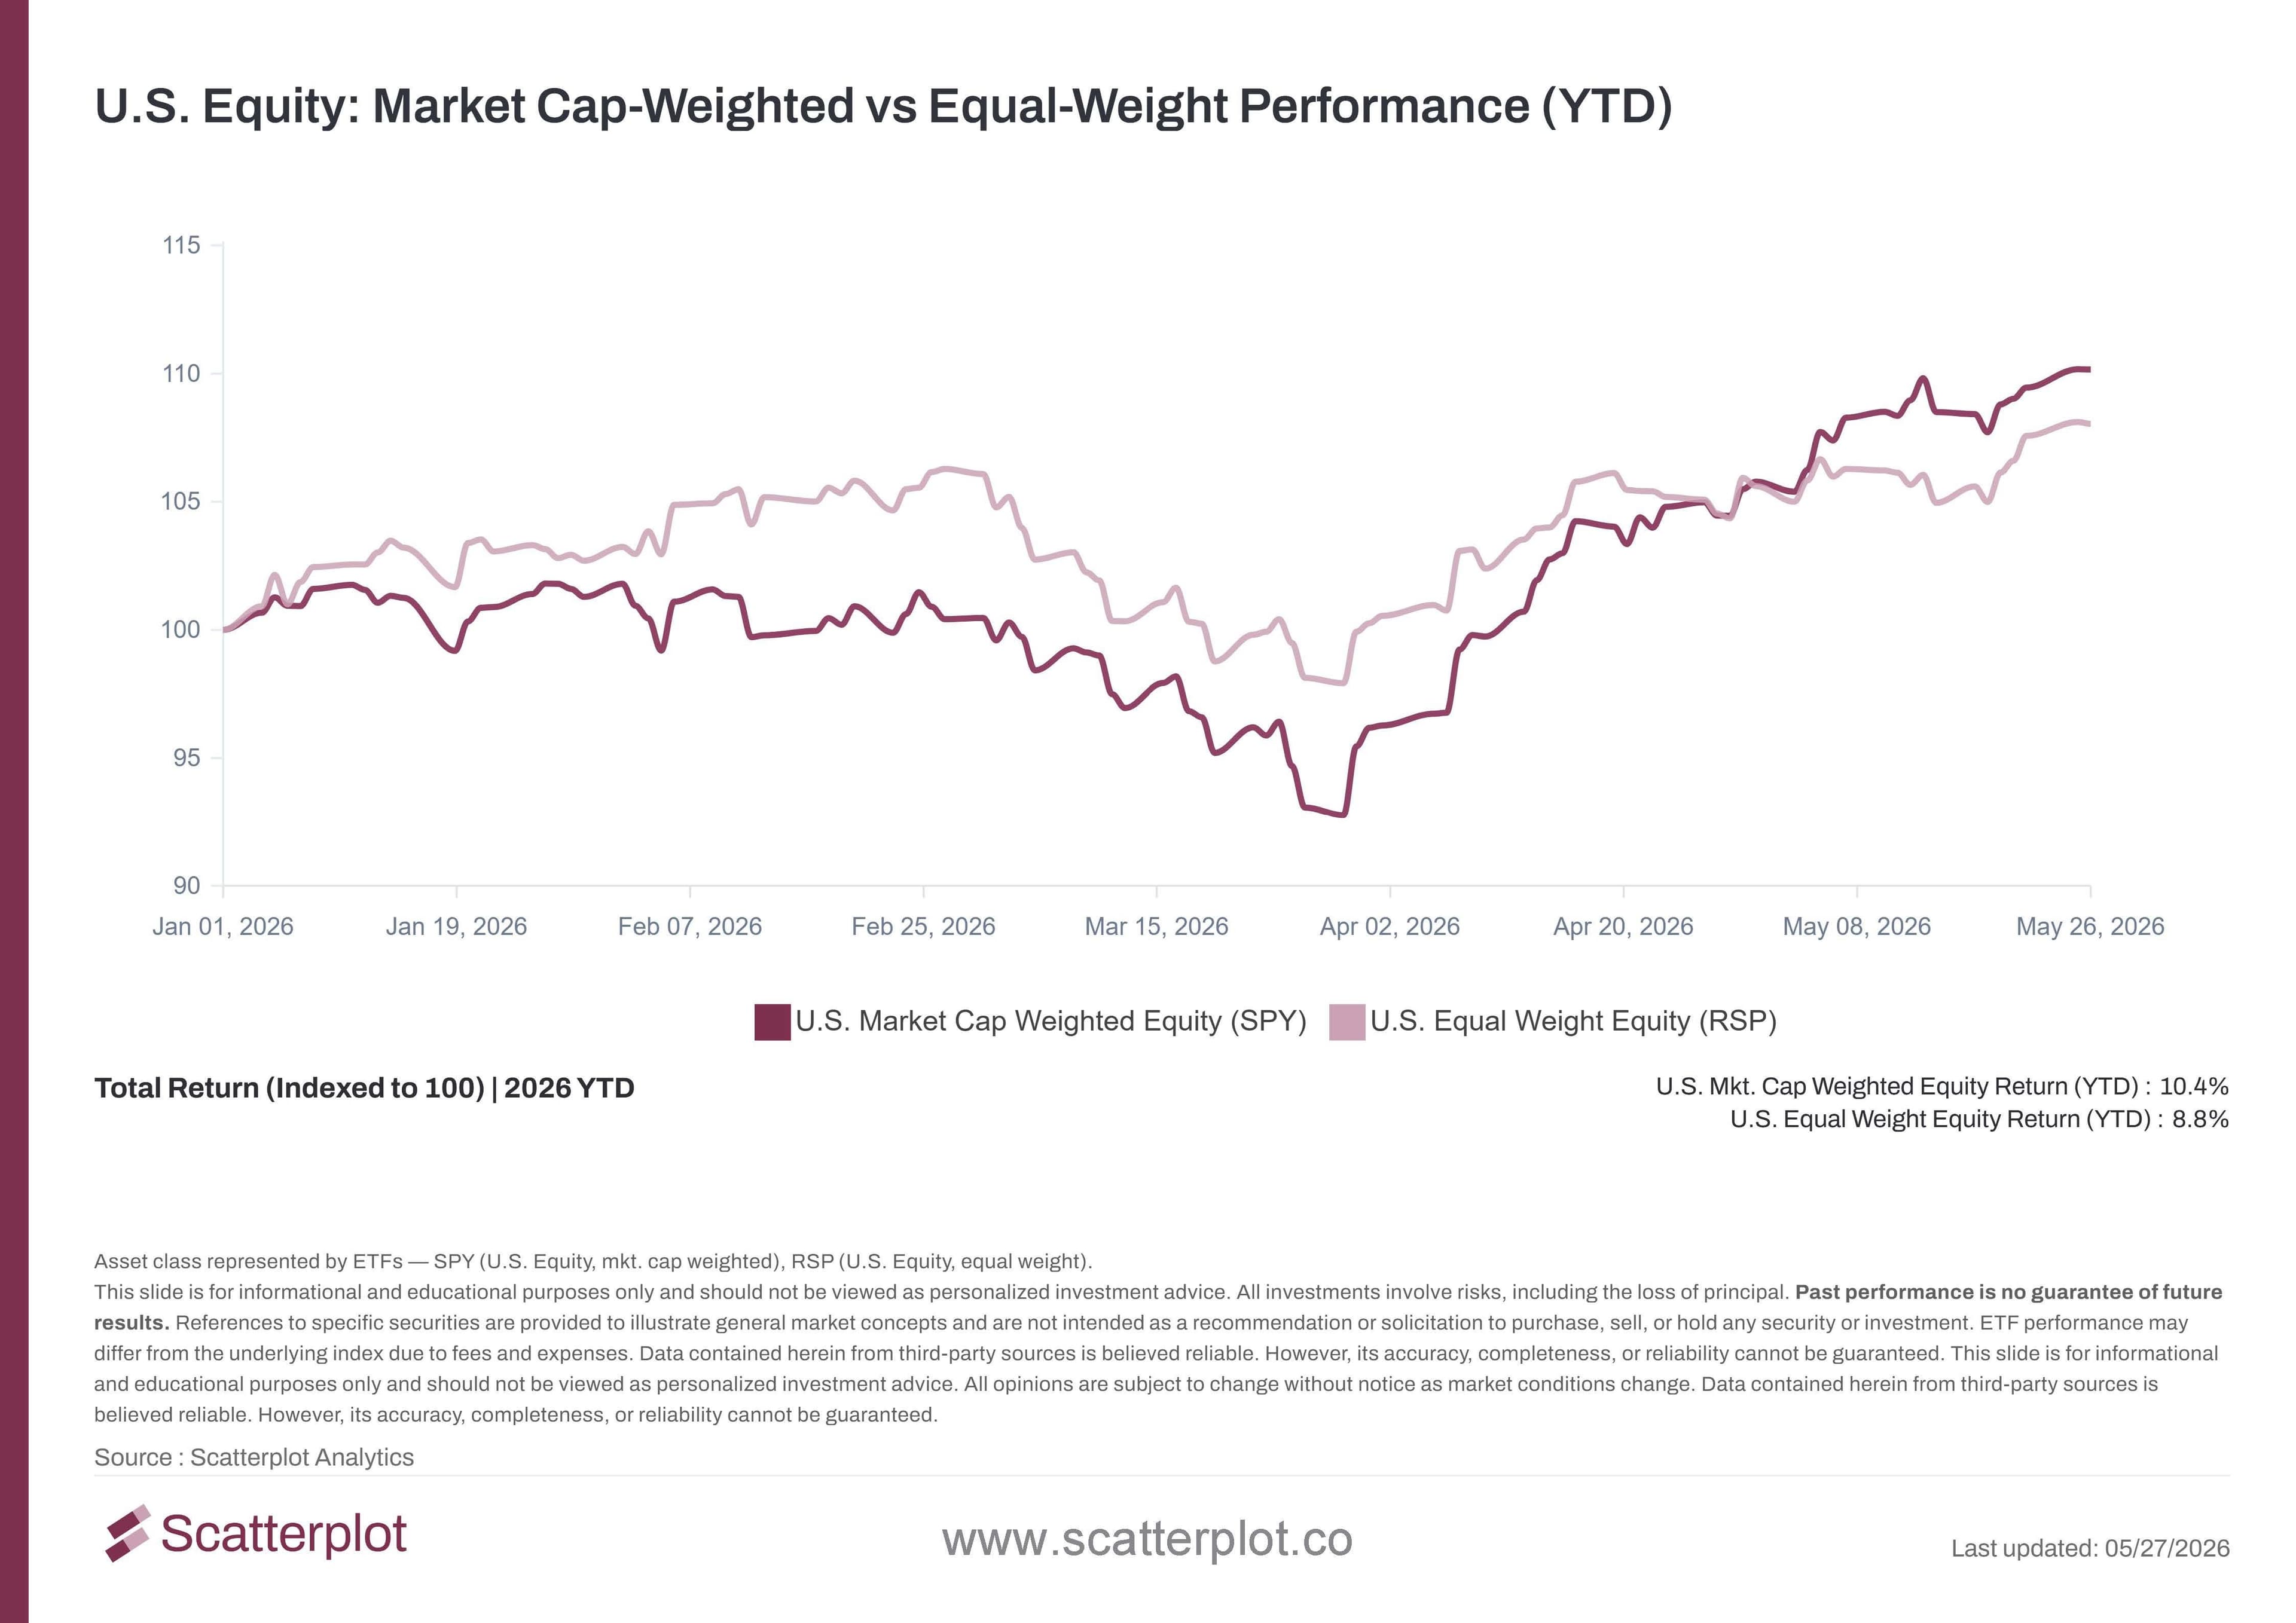
This chart updates daily. Track it live at scatterplot.co
This is the core tension. The people who make up the economy feel terrible. The market, which many believe reflects the value of that economy, is at a record high.
Every time confidence fell below 60
To put the current episode in context, we looked at every period over the last 30 years where the Michigan Sentiment Index fell below 60. We applied two simple rules:
Rule 1: An episode starts on the first month sentiment falls below 60.
Rule 2: An episode ends when sentiment closes above 60 for three or more consecutive months. If it dips below 60 again before that, it is still the same episode.
This gave us six episodes. Here they are, along with the US Equity return during each one:
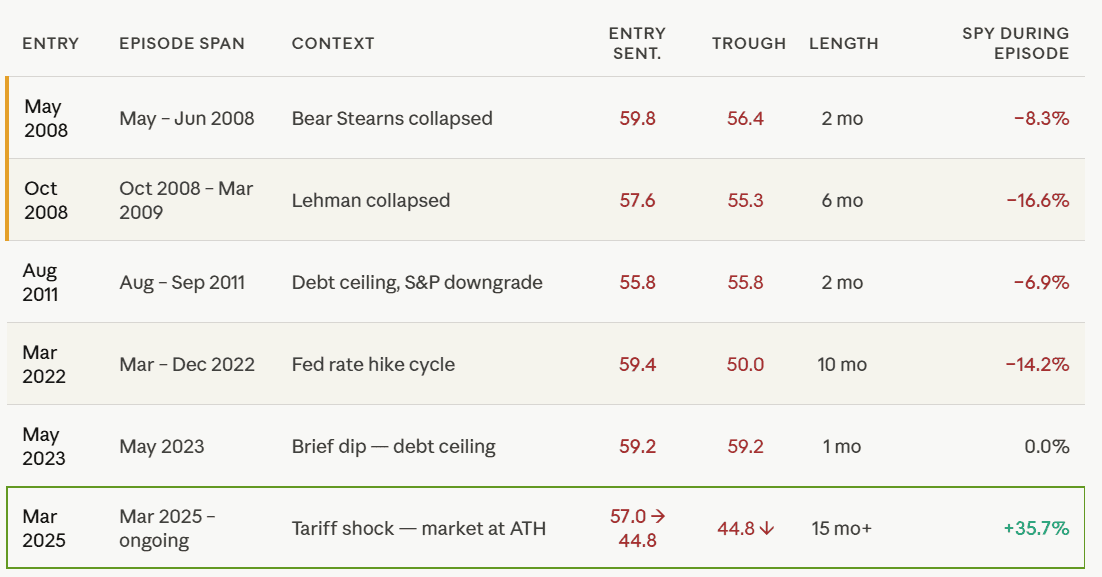
As of May 22nd, 2026. Source: University of Michigan and SPDR S&P 500 ETF total return, Scatterplot Analytics
In each of the five completed episodes, the S&P 500 fell while consumer confidence was below 60. Sometimes a lot, sometimes briefly, but always down. The only exception is the episode we are in right now – where confidence is at an all-time low and the market is at an all-time high.
What is also clear is that this episode looks nothing like the previous cases. In each prior instance, there was an identifiable cause already visible in the market: a financial crisis, a debt ceiling standoff, or an aggressive rate hike cycle. Confidence fell because something bad was already happening and the stock market reflected that.
What forward returns look like after low confidence
If the relationship between confidence and markets has weakened, does it still tell us anything useful about what comes next? We looked at the 12-month forward return of SPY after every month since 2000, split into two groups: months where confidence was below its long-term average, and months where it was above. Here is what we found.
Based on the Michigan Consumer Sentiment Survey. Months below the long-term average since December 2000 are classified as low confidence; those above as high confidence.
This chart updates daily. Track it live at scatterplot.co
The chart tells a clear story. Investors who put money to work during periods of below-average confidence earned an average return of 13.5% over the next 12 months. Those who invested during periods of above-average confidence earned 8.2%. The all-period average across both groups was 10.6%.
Conclusion
The current consumer confidence is at an all-time low and has been for over a year now. The stock market is at an all-time high. Across 30 years of data, that combination has never occurred before.
In every prior episode, confidence fell because something bad was already happening in the economy or the market. This time the cause is less clear. The concerns are real – tariffs, inflation expectations, energy prices – but there is no systemic crisis underway. That makes this episode genuinely different from anything in the historical record.
What history does suggest is this: investors who put money to work when confidence was low have historically done better, on average based on data since 2000, than those who waited for confidence to recover. The forward return data supports that, with below-average confidence periods producing an average 12-month return of 13.5% versus 8.2% after high confidence periods.
Frequently asked questions
What is the Michigan Consumer Sentiment Index?
It is a monthly survey run by the University of Michigan since 1952. Hundreds of U.S. households are asked how they feel about their personal finances, the economy today, and where they think things are headed. The answers are combined into a single score. The long-run average is 84.5. The current reading is 44.8 – the lowest ever recorded.
How many times has consumer confidence been this low and why is it different this time?
Over the past 30 years, there have been six episodes where the Michigan Consumer Sentiment Index fell below 60. In each of the five completed episodes, there was a clear and identifiable cause already visible in the market — a financial crisis, a debt ceiling standoff, or an aggressive rate hike cycle. Confidence fell because something bad was already happening. This time is different. The current episode has lasted longer than any prior one, the trough is lower than anything ever recorded, and yet the stock market is at an all-time high.
How have markets done after periods of low and high consumer confidence on average?
Based on data since December 2000, months where confidence was below its long-term average were followed by an average 12-month return of 13.5% for U.S. equities, as measured by SPY. Months of above-average confidence were followed by an average return of 8.2%. The all-period average was 10.6%. Past performance is not indicative of future results.
What does the K-shaped economy mean?
A K-shaped economy is one where different groups experience very different economic conditions at the same time. One group – typically asset owners and higher earners – sees rising wealth as equity markets climb. Another group – those without significant savings or investments – feels the squeeze of higher prices and economic uncertainty. The current divergence between consumer confidence and stock market performance is a clear example of this dynamic.
Where can I find these charts in the portal?
You can search for "consumer confidence" in the Scatterplot portal search bar to find these charts and more on this topic.
Disclosure
This content is provided for informational and educational purposes only and should not be relied upon as investment advice. No representation is made that any investment strategy or market view will be successful. Past performance is not indicative of future results. All investing involves risk, including the loss of principal. Please refer to our Terms and Conditions for more information.


Enjoyed this? Get more in your inbox.
Weekly insights for advisors
— charts, research, and practical tools. No fluff.
Investment Foundations
Understanding Recency Bias: What U.S. Equity Returns Reveal About Investor Expectations
Exploring Recency Bias in Investors Using Recent and Long-Term U.S. Equity Data.
Read moreSanjeev Pati, CFA
July 6, 2026 · 4 min read
Investment Foundations
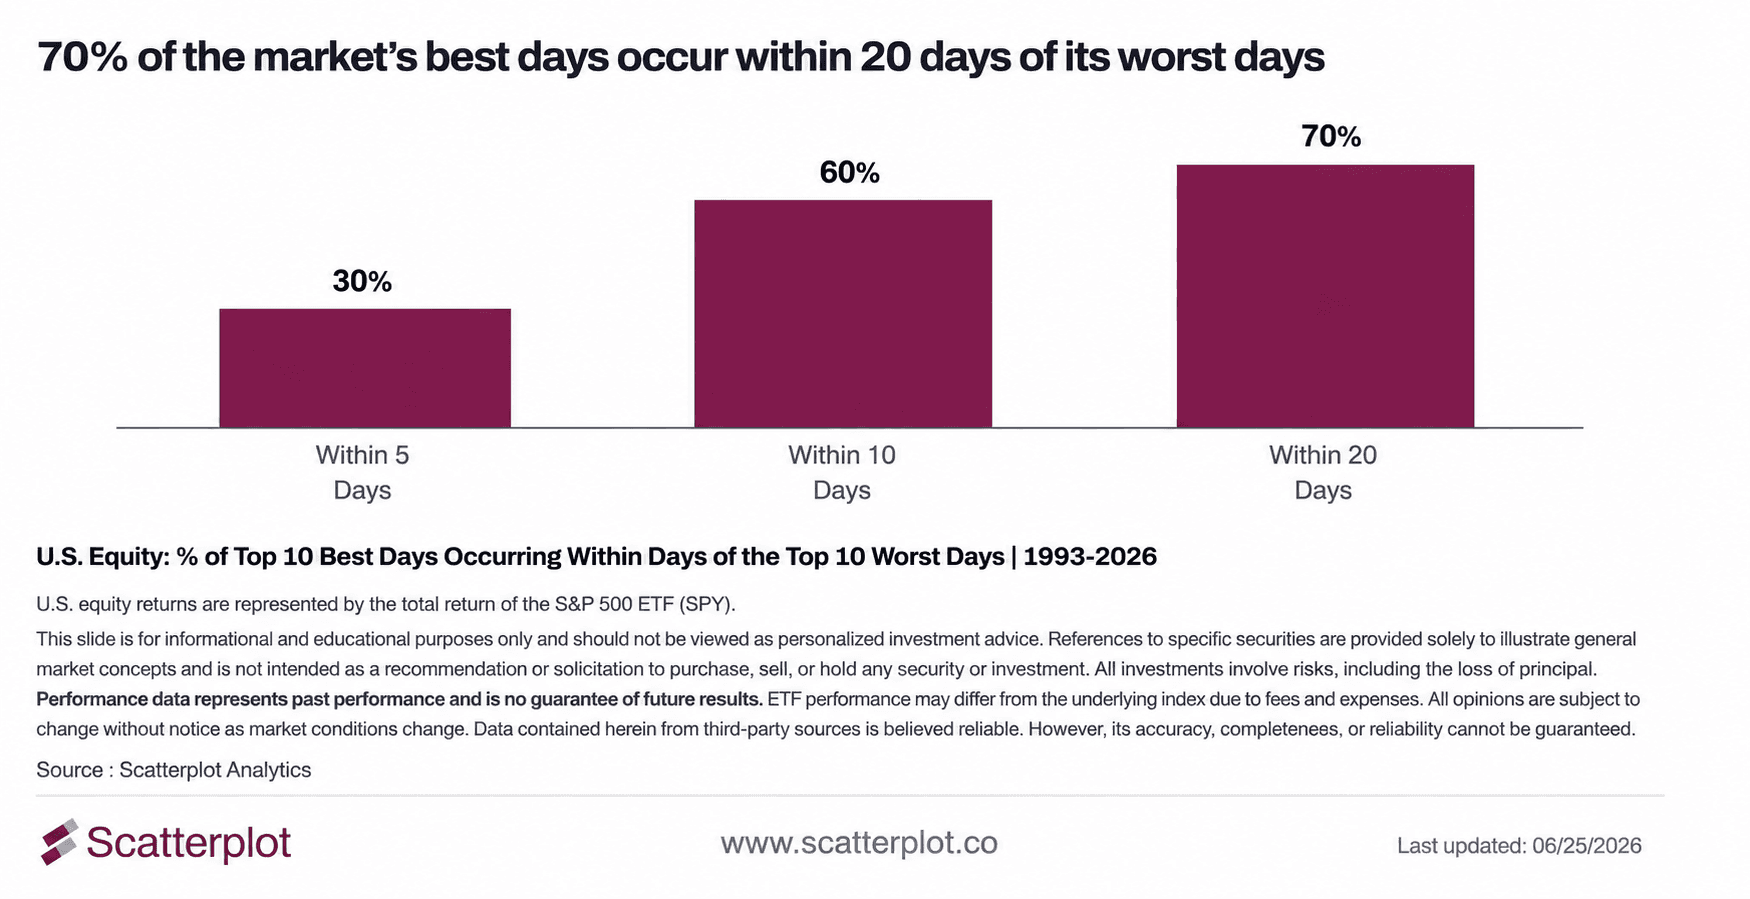
Why Market Timing Is So Hard: 70% of the best days in the market land near the worst ones
Market timing is hard. Since 1993, 70% of the S&P 500's ten best trading days occurred within 20 days of one of its ten worst trading days, making it difficult to capture one without being exposed to the other.
Read moreSanjeev Pati, CFA
June 26, 2026 · 5 min read