

U.S., International, and Emerging Market Returns Are Converging
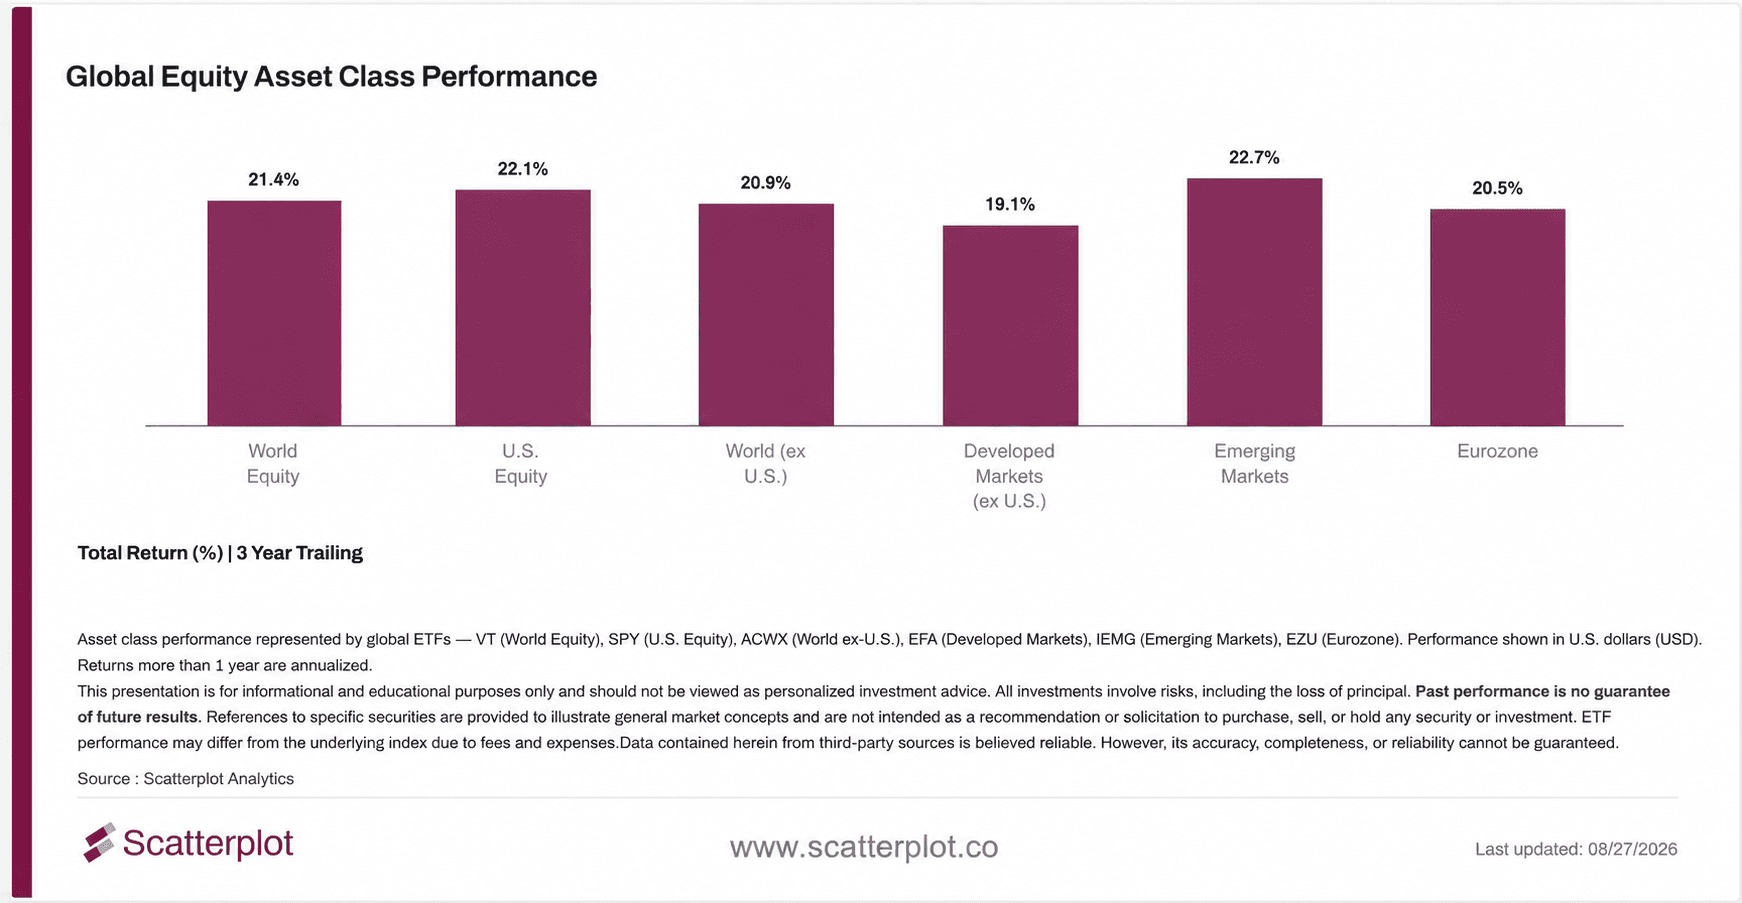
U.S., Developed International, and Emerging-Market equities have taken very different paths. Over the last three years, they have ended up in almost the same place, all delivering annualized returns close to 20%, in USD terms.

Sanjeev Pati, CFA
Founder, Scatterplot
Introduction
Something interesting has happened across global equity markets.
Over the trailing three years, U.S. equities (SPY) have returned 22.1% annualized, developed international equities (EFA) 19.1%, and emerging-market equities (IEMG) 22.7%. The pattern holds across the board: world equity (VT) is at 21.4%, world ex-U.S. (ACWX) at 20.9%, and the Eurozone (EZU) at 20.5%.
Those are strong returns across the board. Despite very different market environments, all of them have delivered returns close to an impressive 20% annualized.
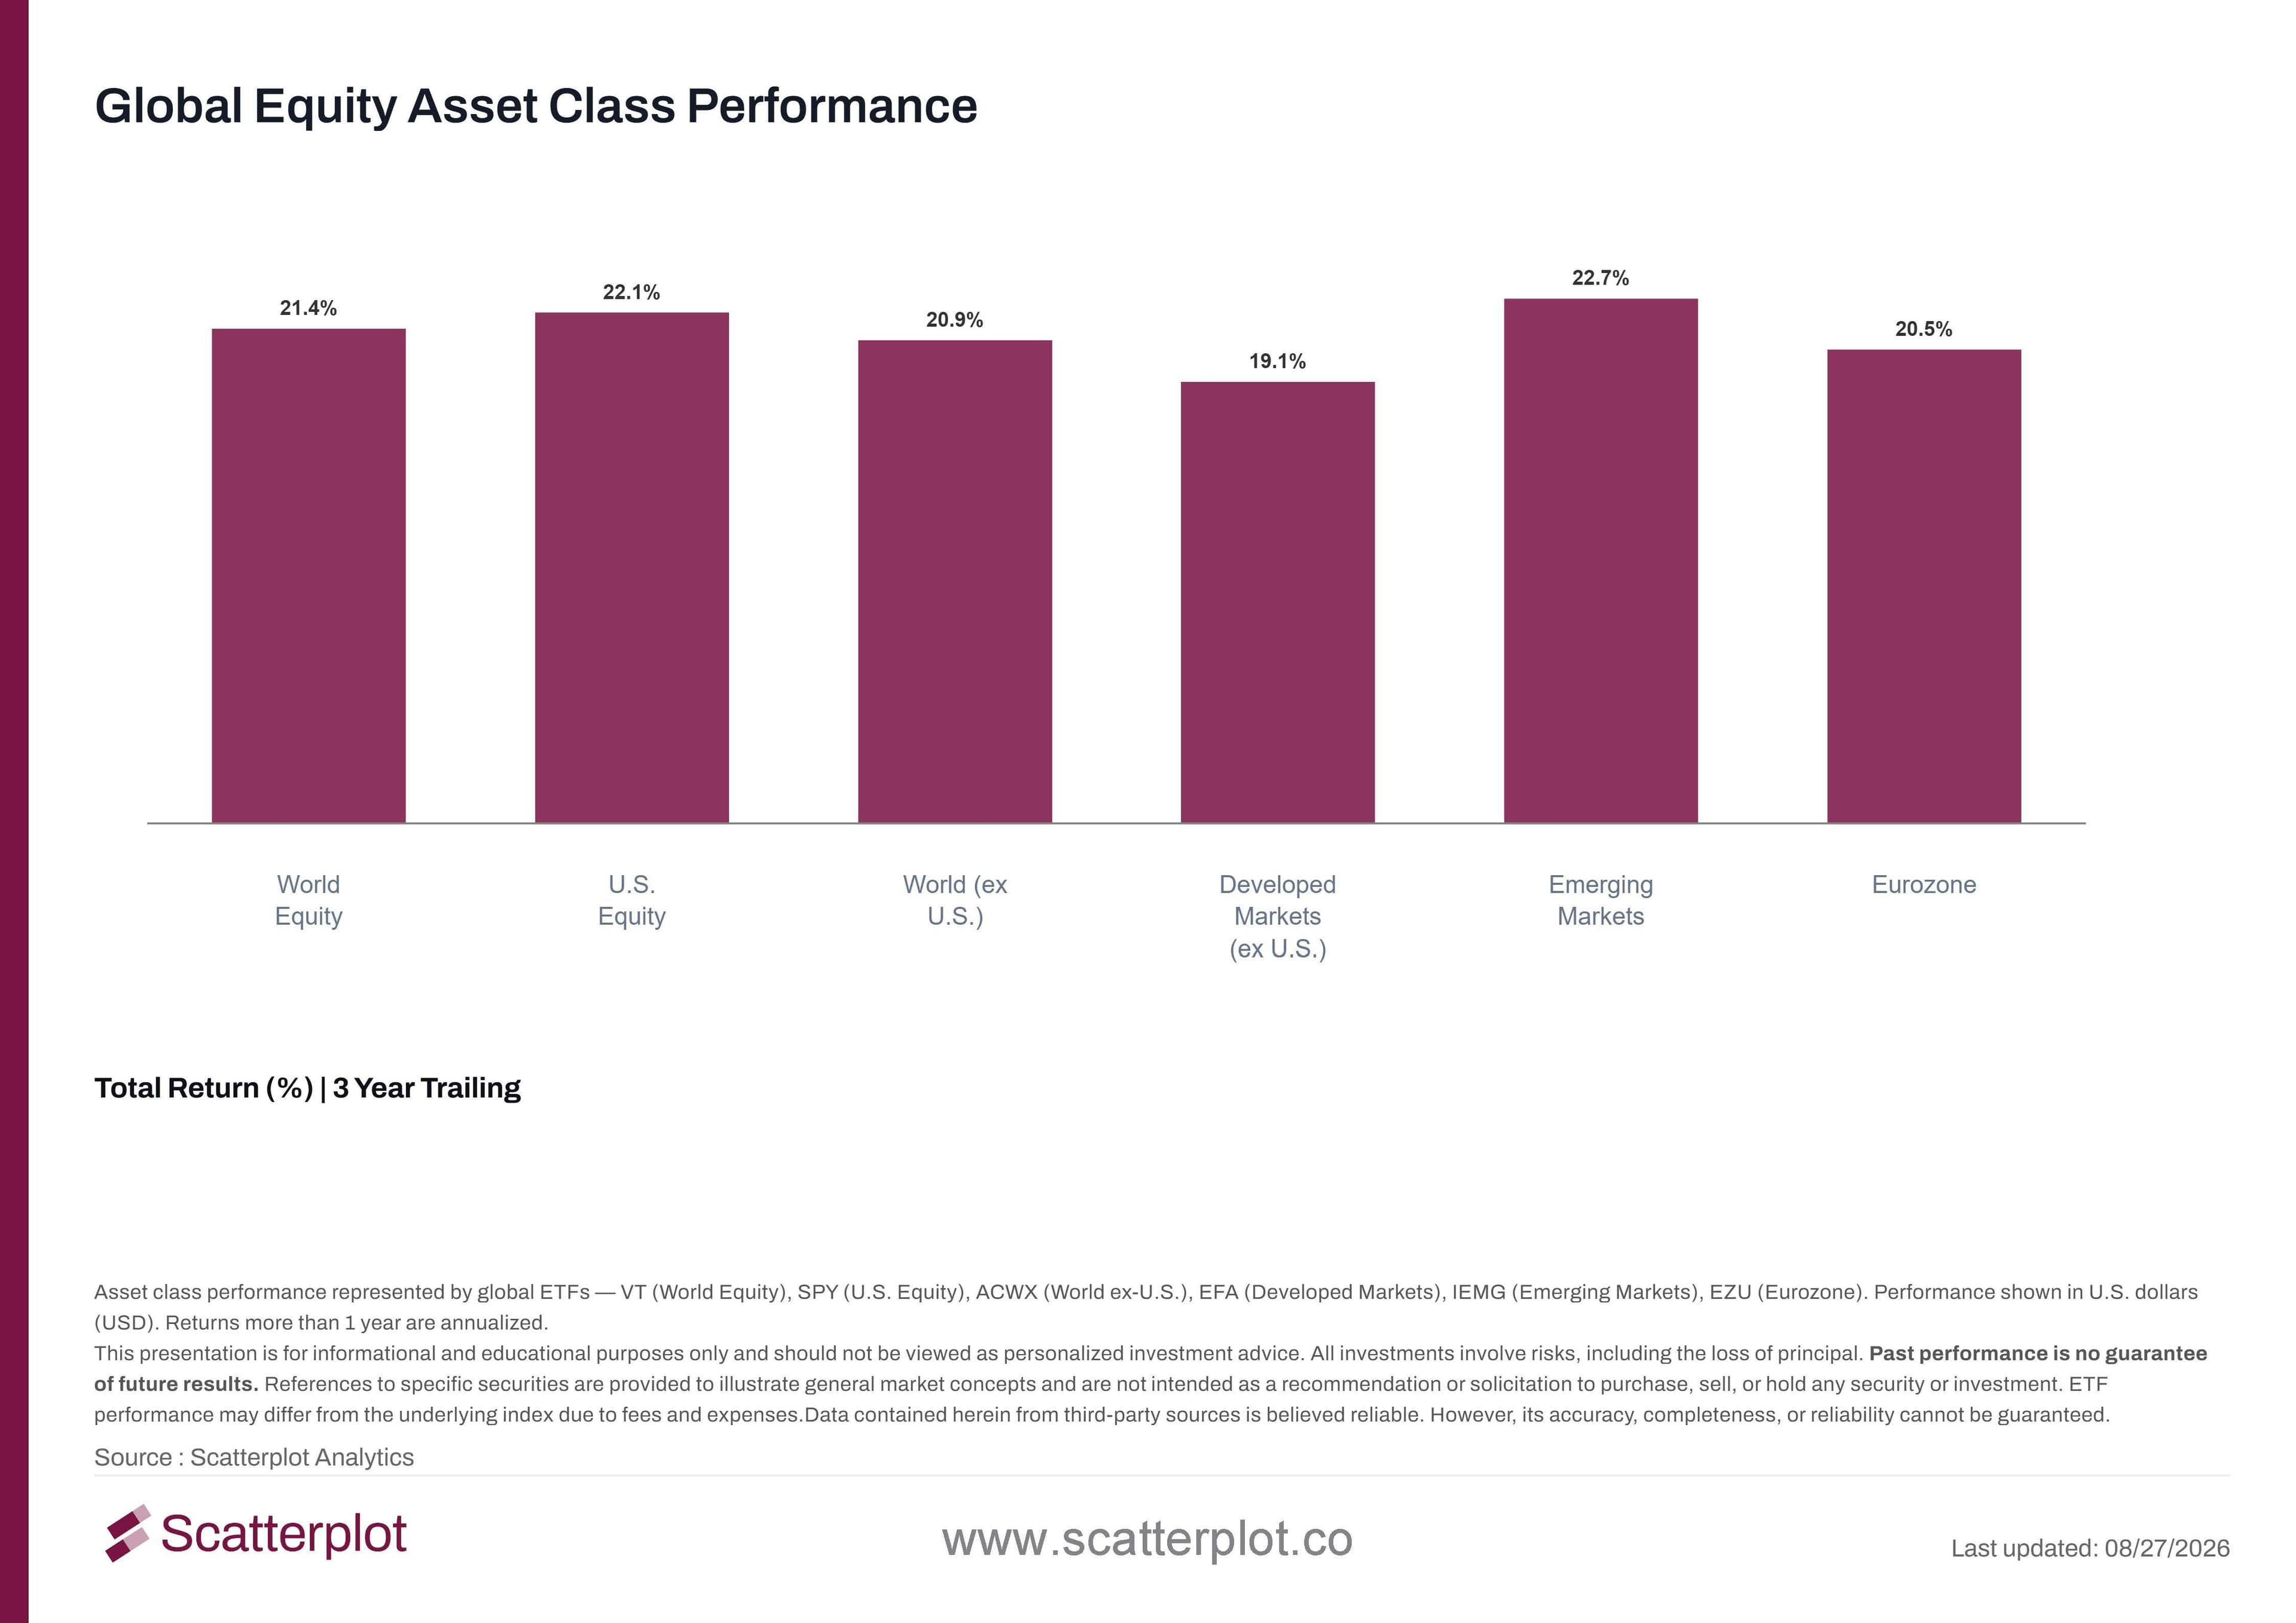
This chart updates daily. Track it live.
Why three years?
A three-year window is long enough to look beyond short-term market moves while still reflecting the current investment cycle. Today's trailing period begins in August 2023, several months after the 2022 market low.
So, how unusual is this?
We focused on these three because they're distinct asset classes, while the other regions in the chart above are combinations of them. Our common history goes back roughly 20 years (2003) and gives us more than 5,000 daily observations to compare with today.
- The returns are unusually close today. Only about 2% of historical observations for SPY, EFA, and EEM had the three ETFs this tightly clustered. Put another way, 98% of the more than 5,000 historical observations had a wider gap than we see today.
- Today's spread is much tighter than normal. Today, the difference between the highest and lowest three-year annualized return for SPY, EFA, and EEM is just 3.6%. Historically, the median spread has been about 11.2%.
- Current returns are well above their historical averages. SPY's current three-year annualized return is 21.8%, compared with a historical rolling three-year average of 10.8%. EFA is 19.2% vs. 6.1%, and EEM is 22.9% vs. 6.9%.
Different views, same destination
Whether your equity view was U.S.-focused, globally diversified, developed international, emerging markets, or European, the three-year outcomes have been remarkably similar.
As we know, past performance or trends is no guarantee of future results or trends, so this is just an interesting point-in-time observation. That is it.
Disclosure
This content is provided for informational and educational purposes only and should not be relied upon as investment advice. No representation is made that any investment strategy or market view will be successful. Past performance is not indicative of future results. All investing involves risk, including the loss of principal. Please refer to our Terms and Conditions for more information.


Enjoyed this? Get more in your inbox.
Weekly insights for advisors
— charts, research, and practical tools. No fluff.

Platform Updates
US Housing Market in October 2026: Introducing the U.S. Housing Daily
In October 2026, the 30-year mortgage rate is 7.40% and the monthly payment on a median-priced home is the highest in ten years. Existing-home sales are near three-decade lows, months of supply is the highest in ten years, and builders are cutting prices.
Read moreSanjeev Pati, CFA
October 16, 2026 · 7 min read
Market Insights
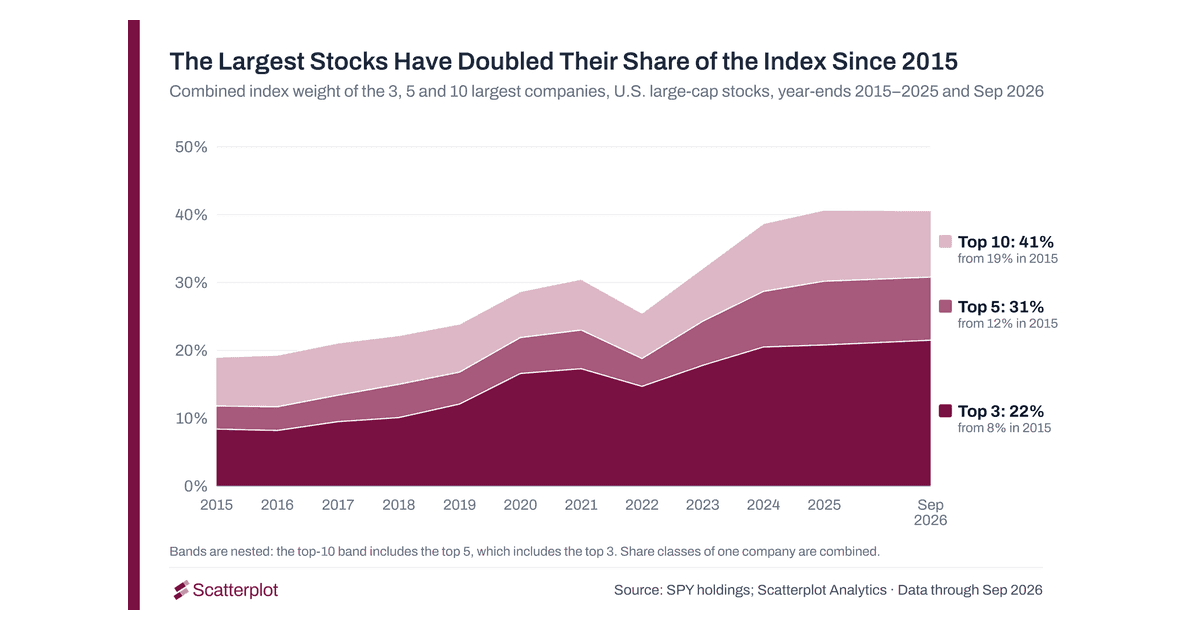
U.S. Market Concentration: The Largest Companies Are Gaining Weight, and a Bigger Share of Profits
Are the companies with the largest index weights also responsible for a substantial share of the index's aggregate financial results ? The data says they are.
Read moreSanjeev Pati, CFA
October 9, 2026 · 10 min read