

The 30-Year Treasury Yield Just Closed at a 19-Year High
The 30-year Treasury yield hit 5.34% this week, the highest it's been since 2007. So what does that mean for the yield curve, mortgage rates, and the government's borrowing costs? Here are the charts that put it in perspective.

Sanjeev Pati, CFA
Founder, Scatterplot
Key Takeaways
- The 30-year Treasury yield reached roughly 5.34% on August 18, its highest level since 2007.
- The average 30-year fixed mortgage rate was 6.65% as of August 20, up from 5.98% in late February.
- Net interest payments on federal debt have climbed from $187 billion in 2009 to over $900 billion this year.
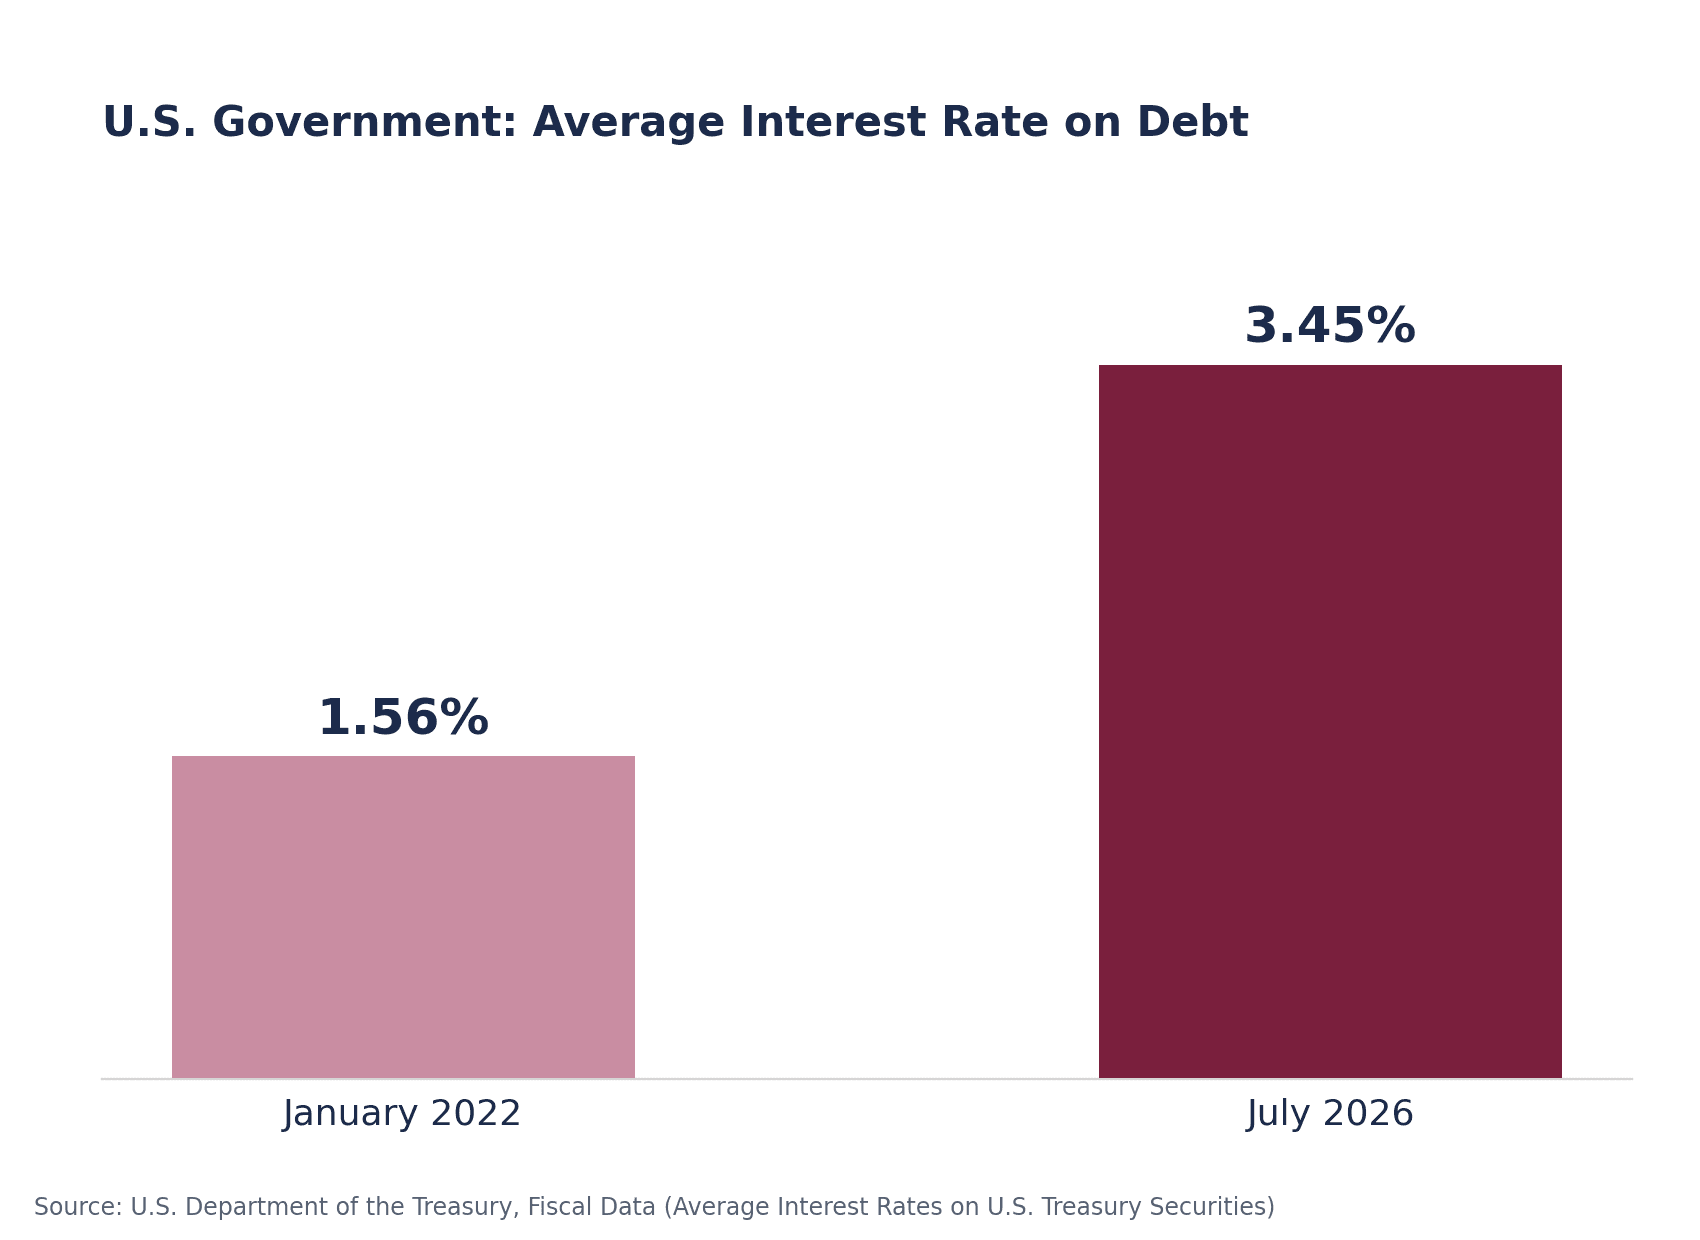
- The average interest rate the government pays on all its debt hit 3.45% in July 2026, up from around 1.6% in late 2021.
How high have Treasury yields climbed?
The 30-year Treasury yield reached roughly 5.34% on August 18, its highest level since 2007. That marked a sharp move higher at the long end of the Treasury market and brought borrowing costs back to levels investors have not seen in nearly two decades.
The important point is not simply that the 30-year yield crossed 5%. Long-term yields incorporate the term premium investors demand for holding longer-duration debt. They also reflect the amount of duration the market is being asked to absorb.
Recent pressure has come against a backdrop of persistent inflation concerns, a large federal borrowing requirement and broader pressure across global bond markets. The result has been a long end that has remained elevated even after the yield curve moved away from the inversion that characterized much of the previous few years.
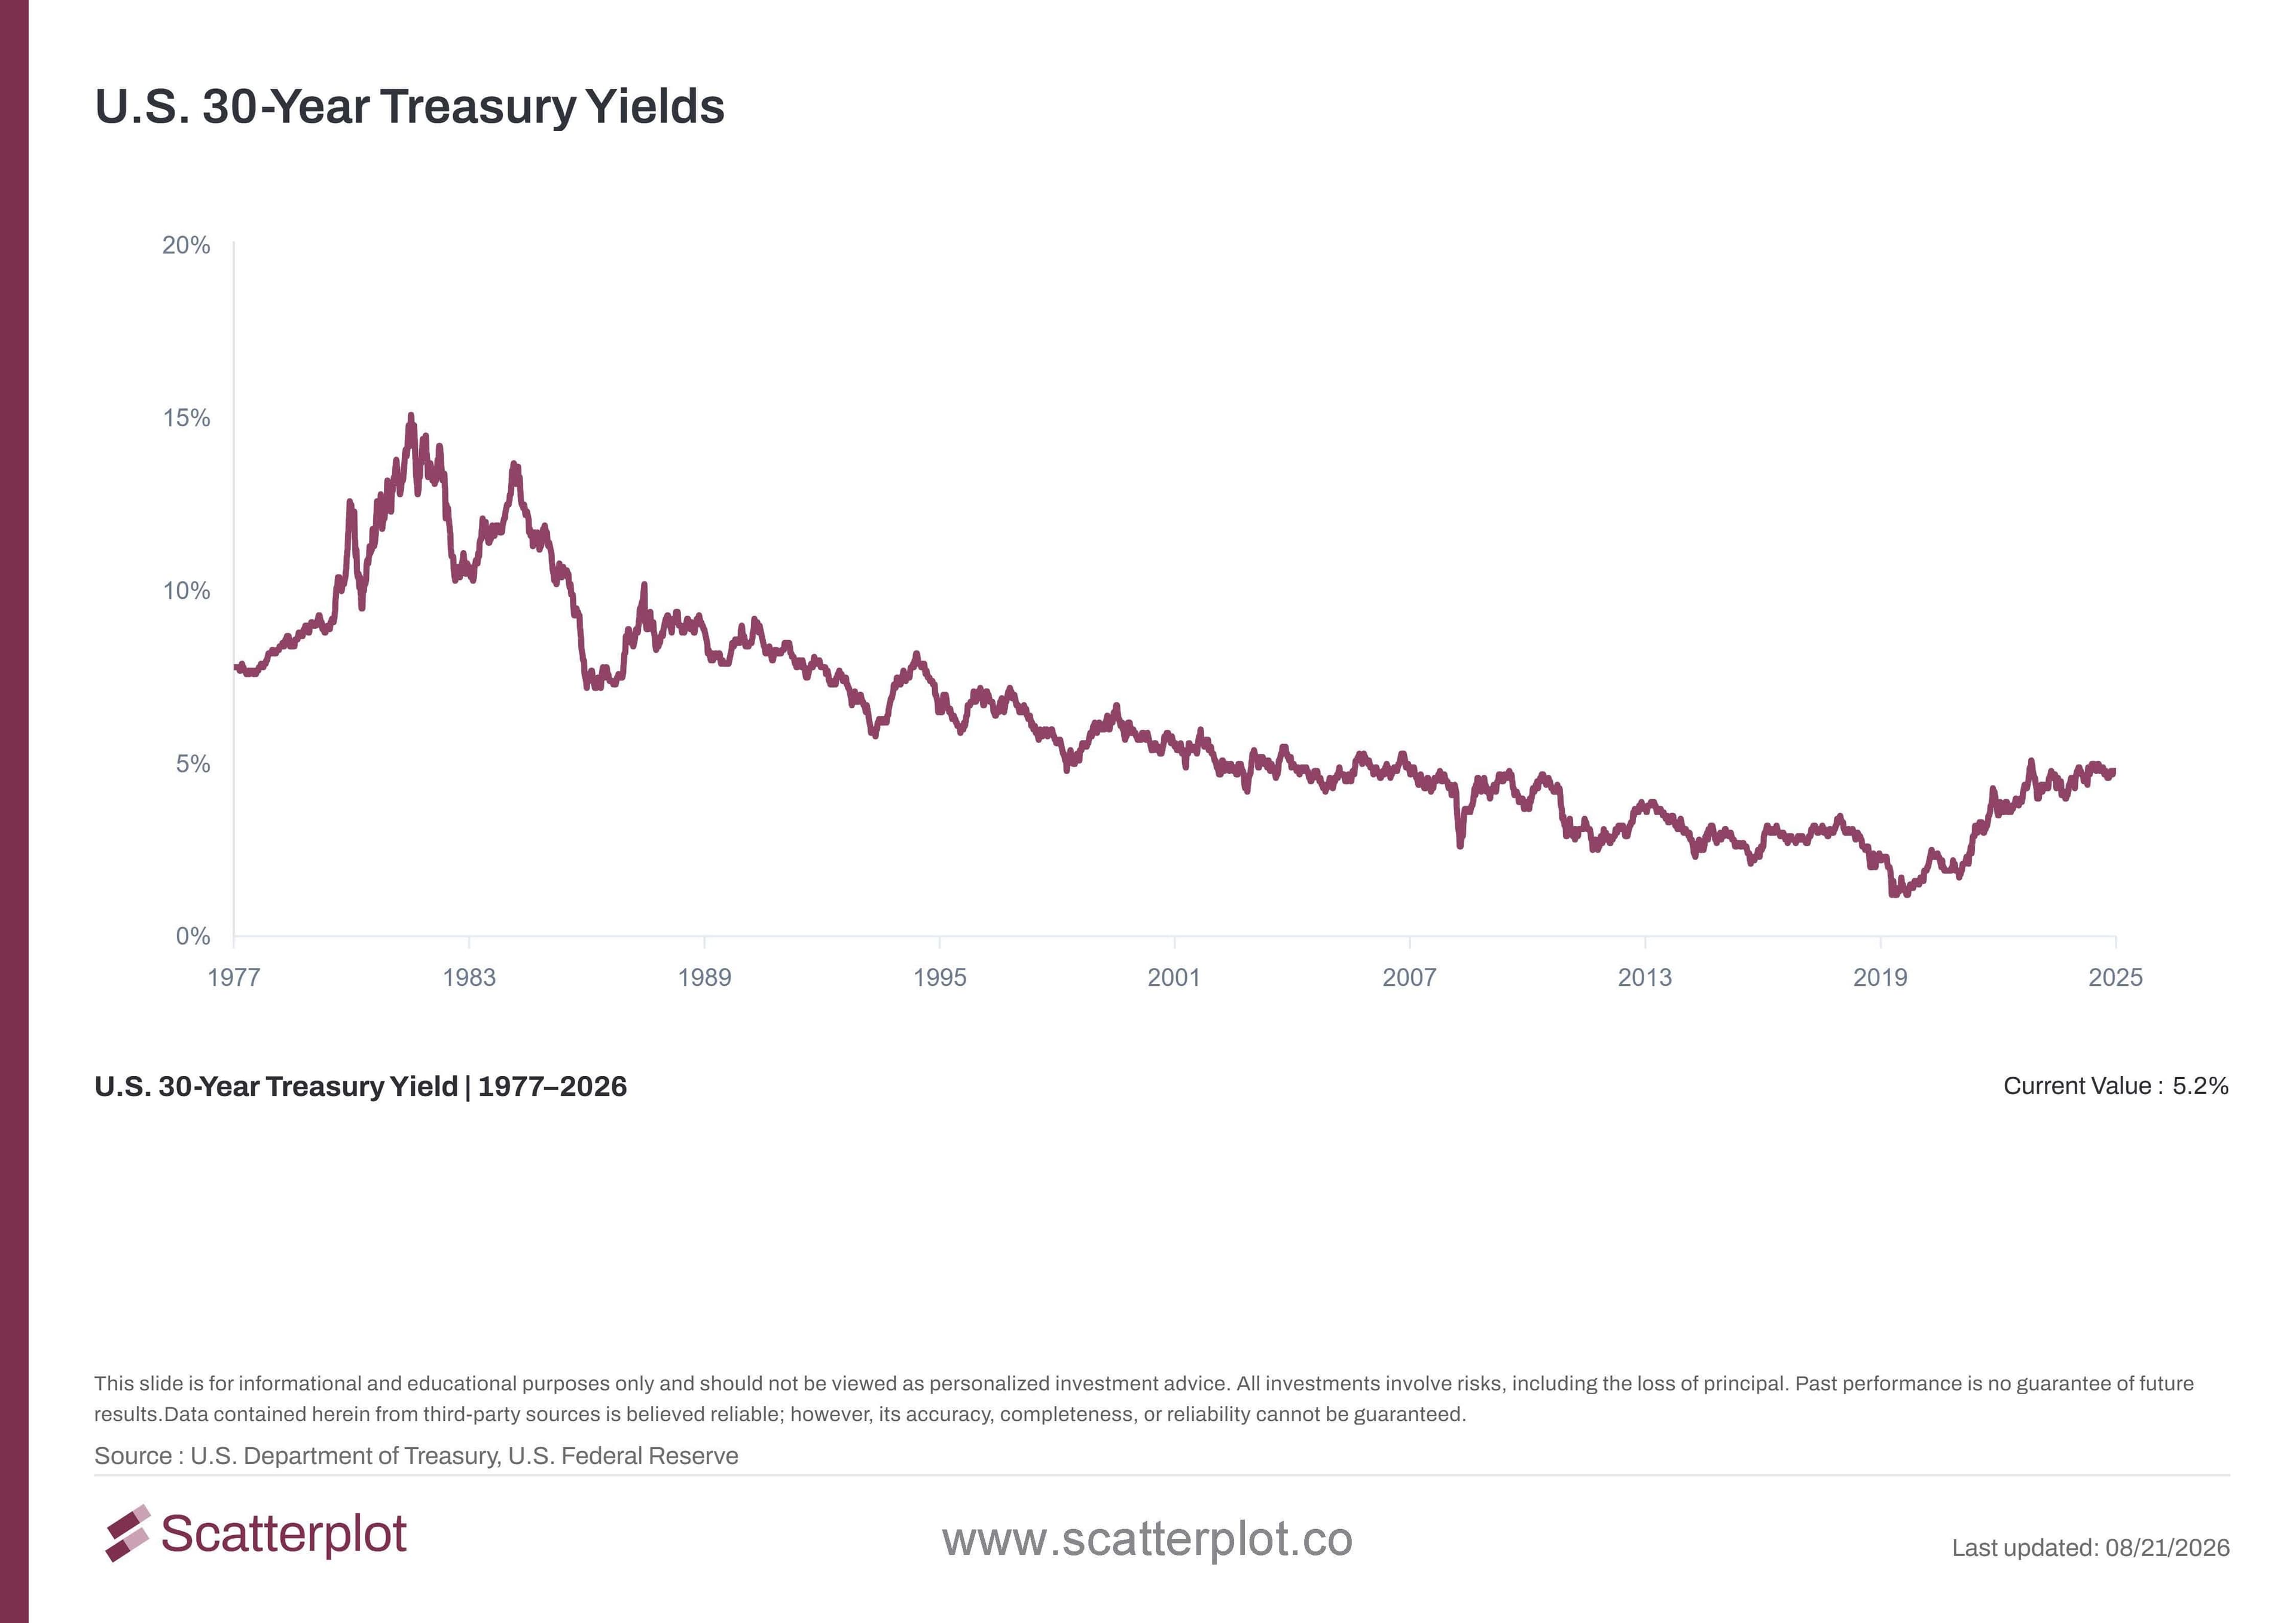
This chart updates daily. Track it live at scatterplot.co
The 10-year tells a similar story, though it remains a bit further from its own historical extremes.
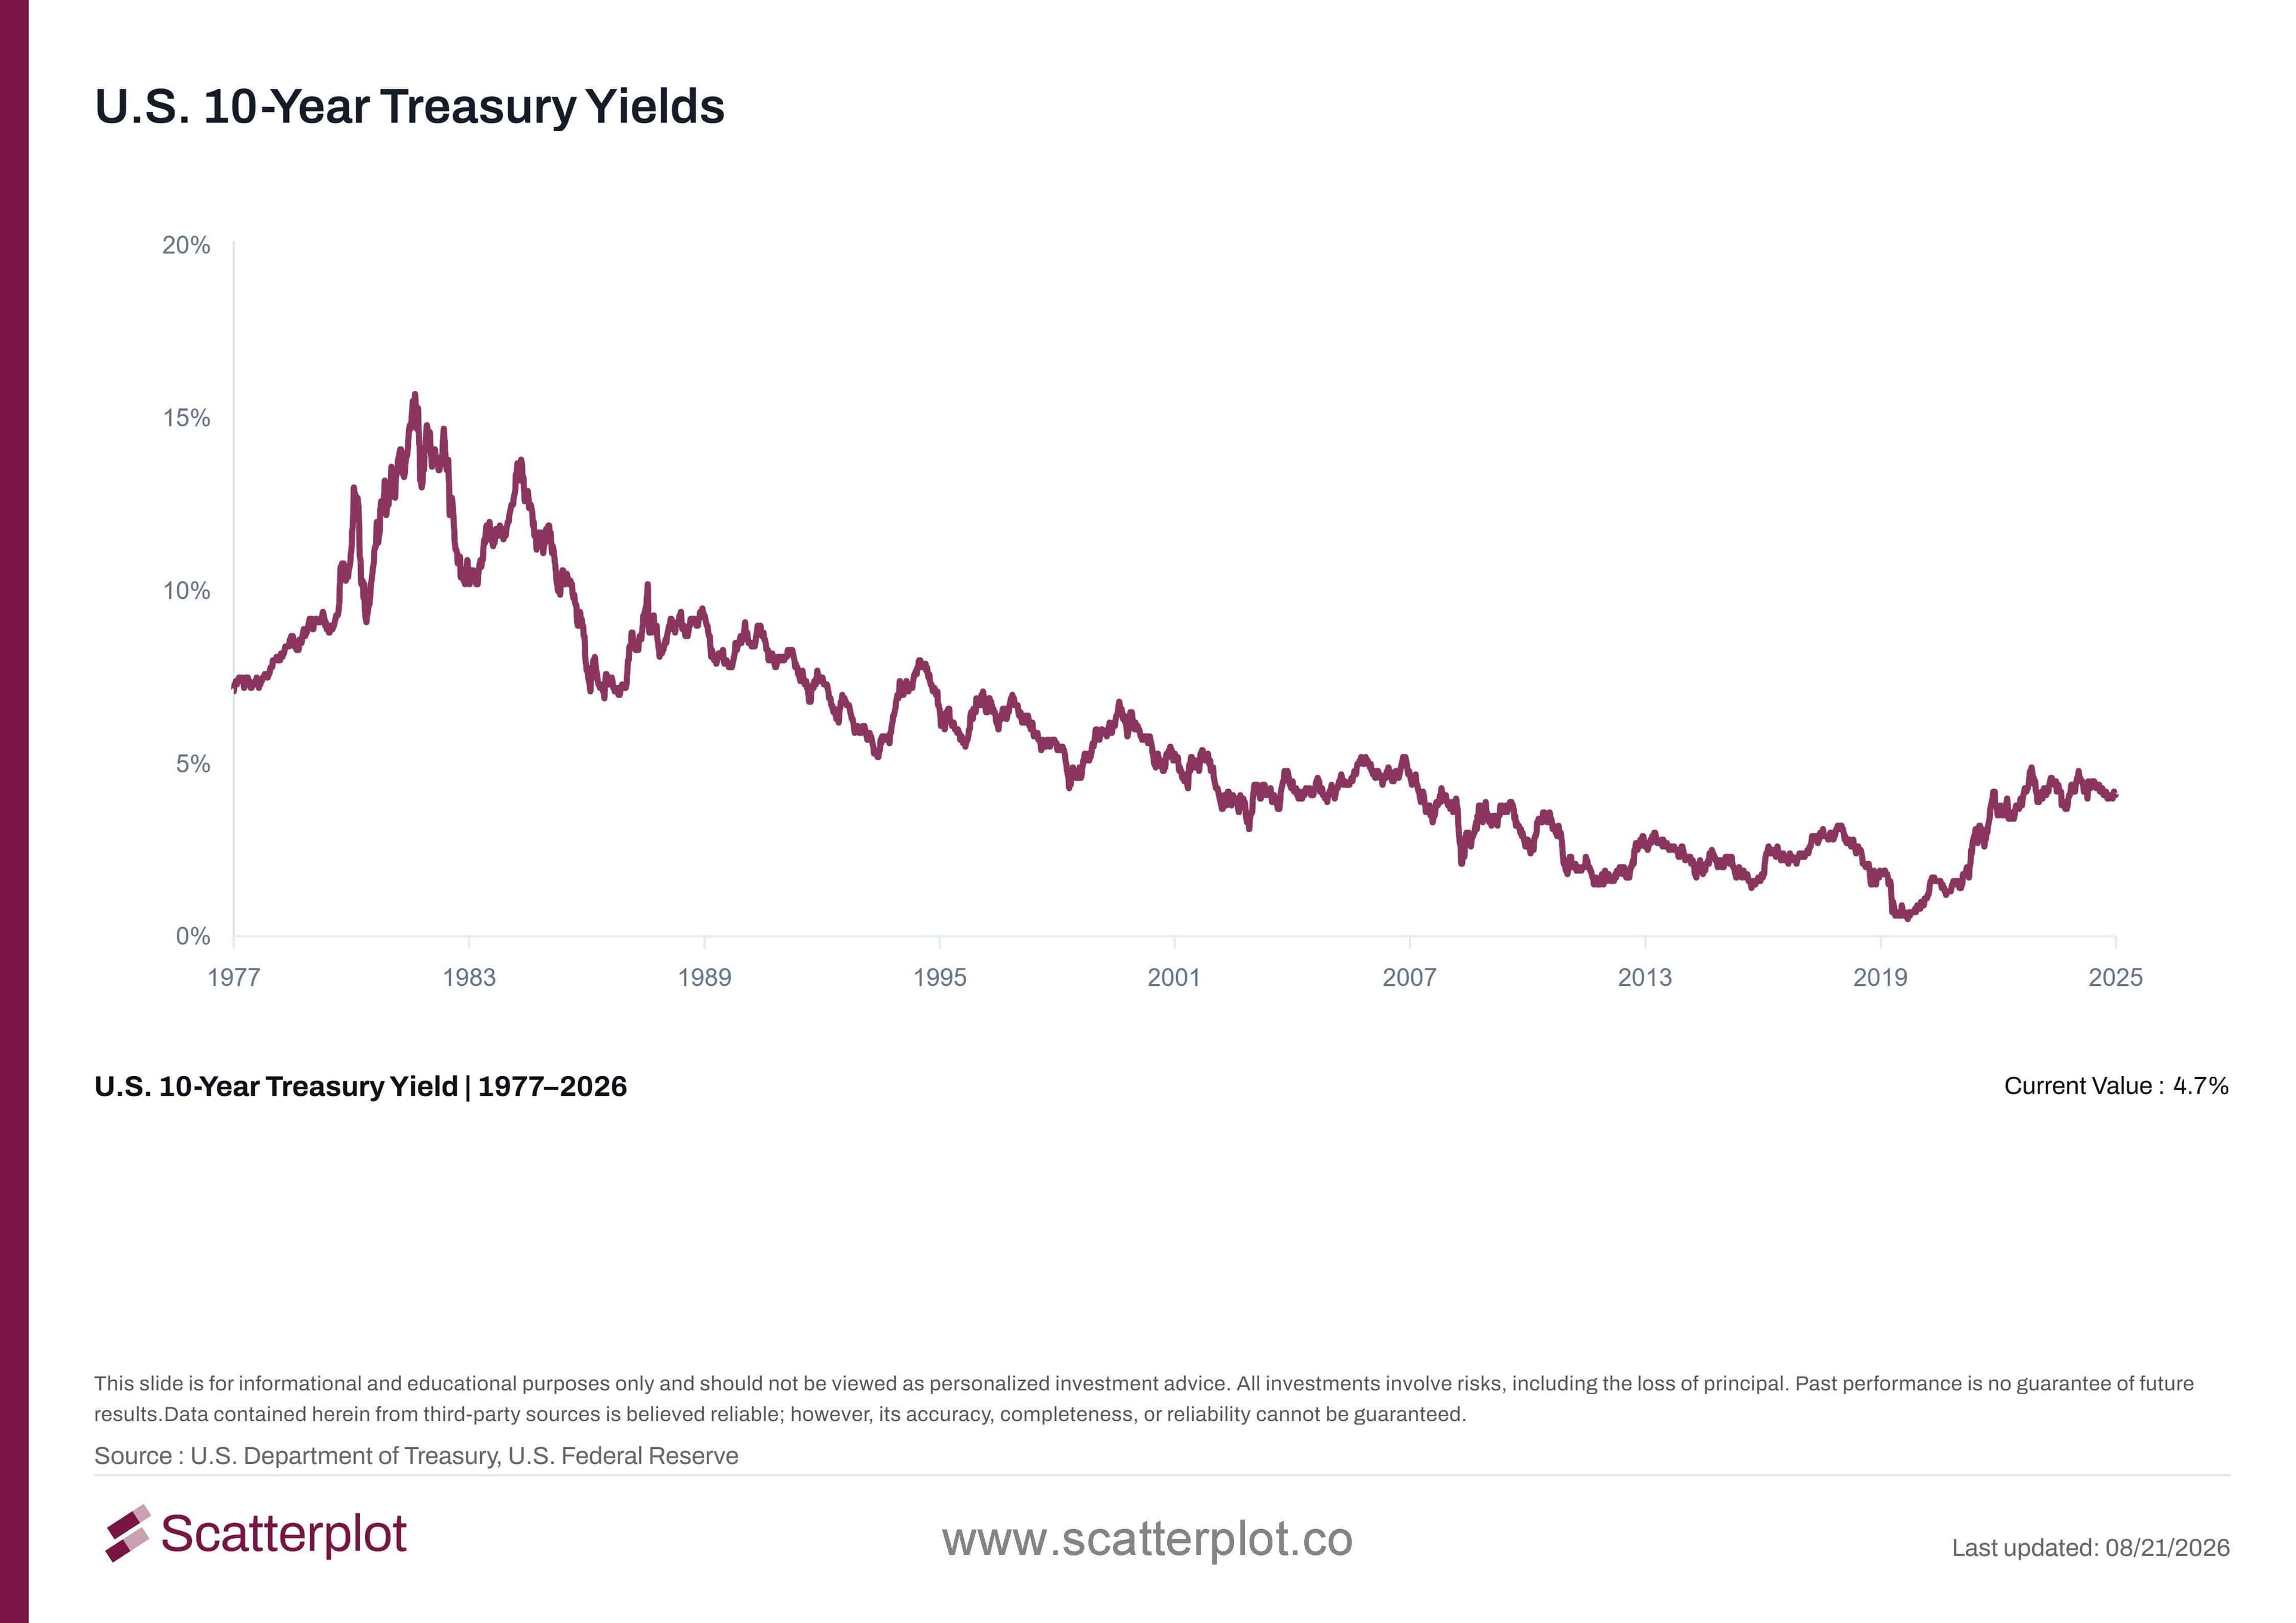
This chart updates daily. Track it live at scatterplot.co
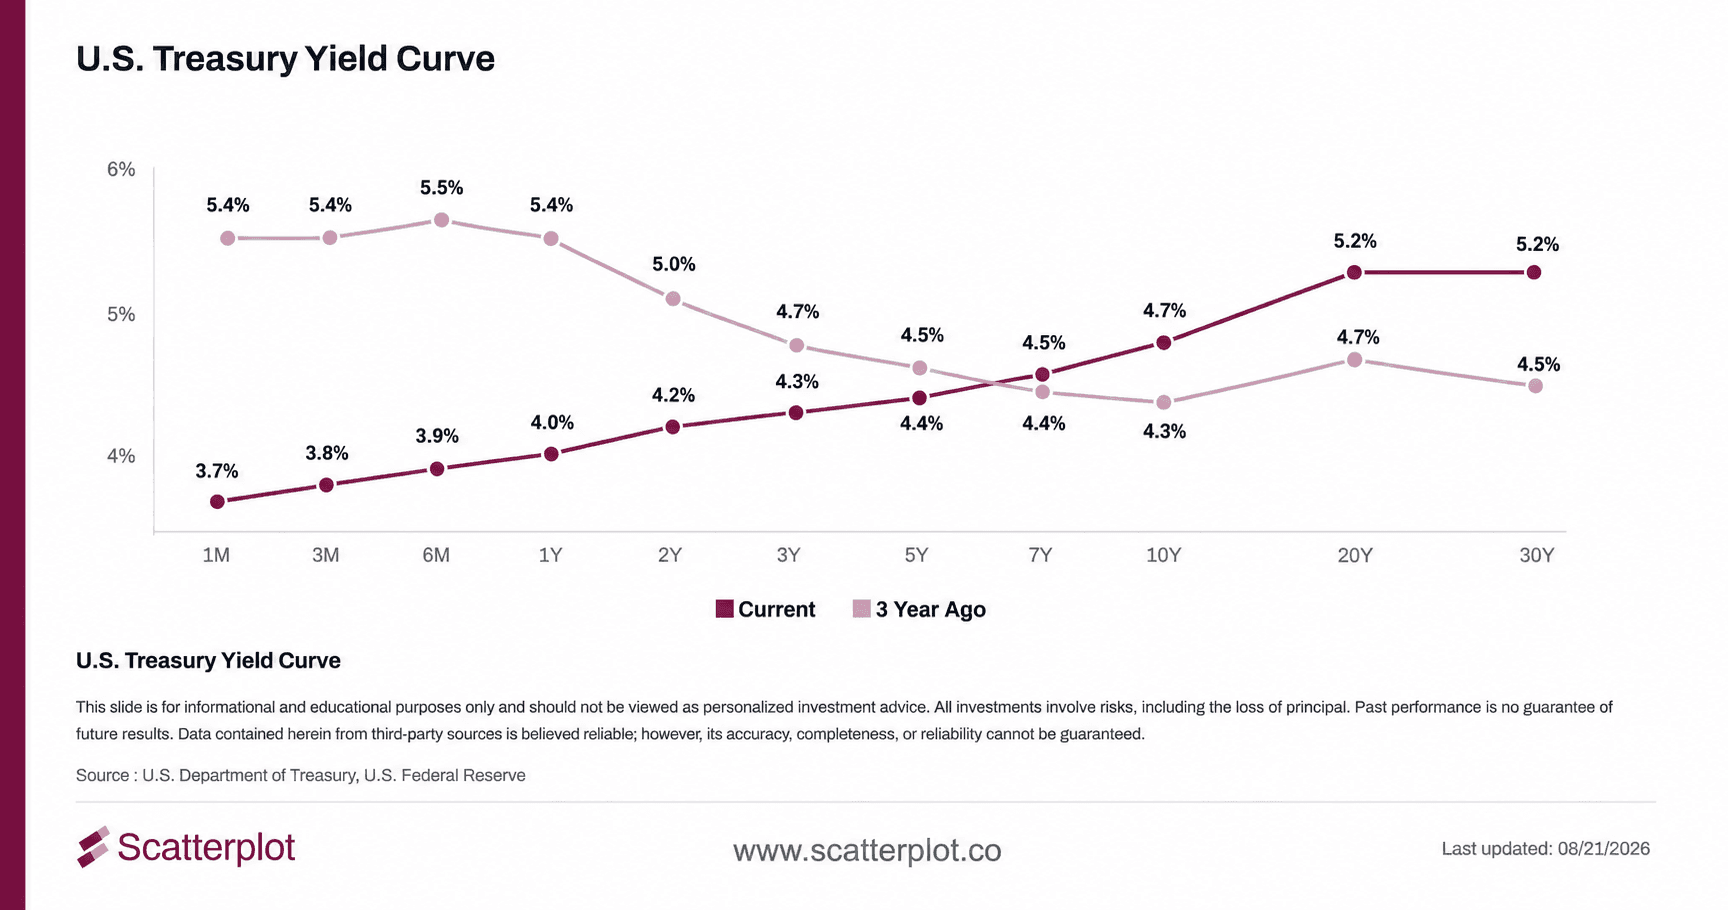
What does the yield curve look like now vs. before?
Now vs. 6 Months Ago
Six months ago the curve was inverted at the short end. Today it slopes upward across every maturity.
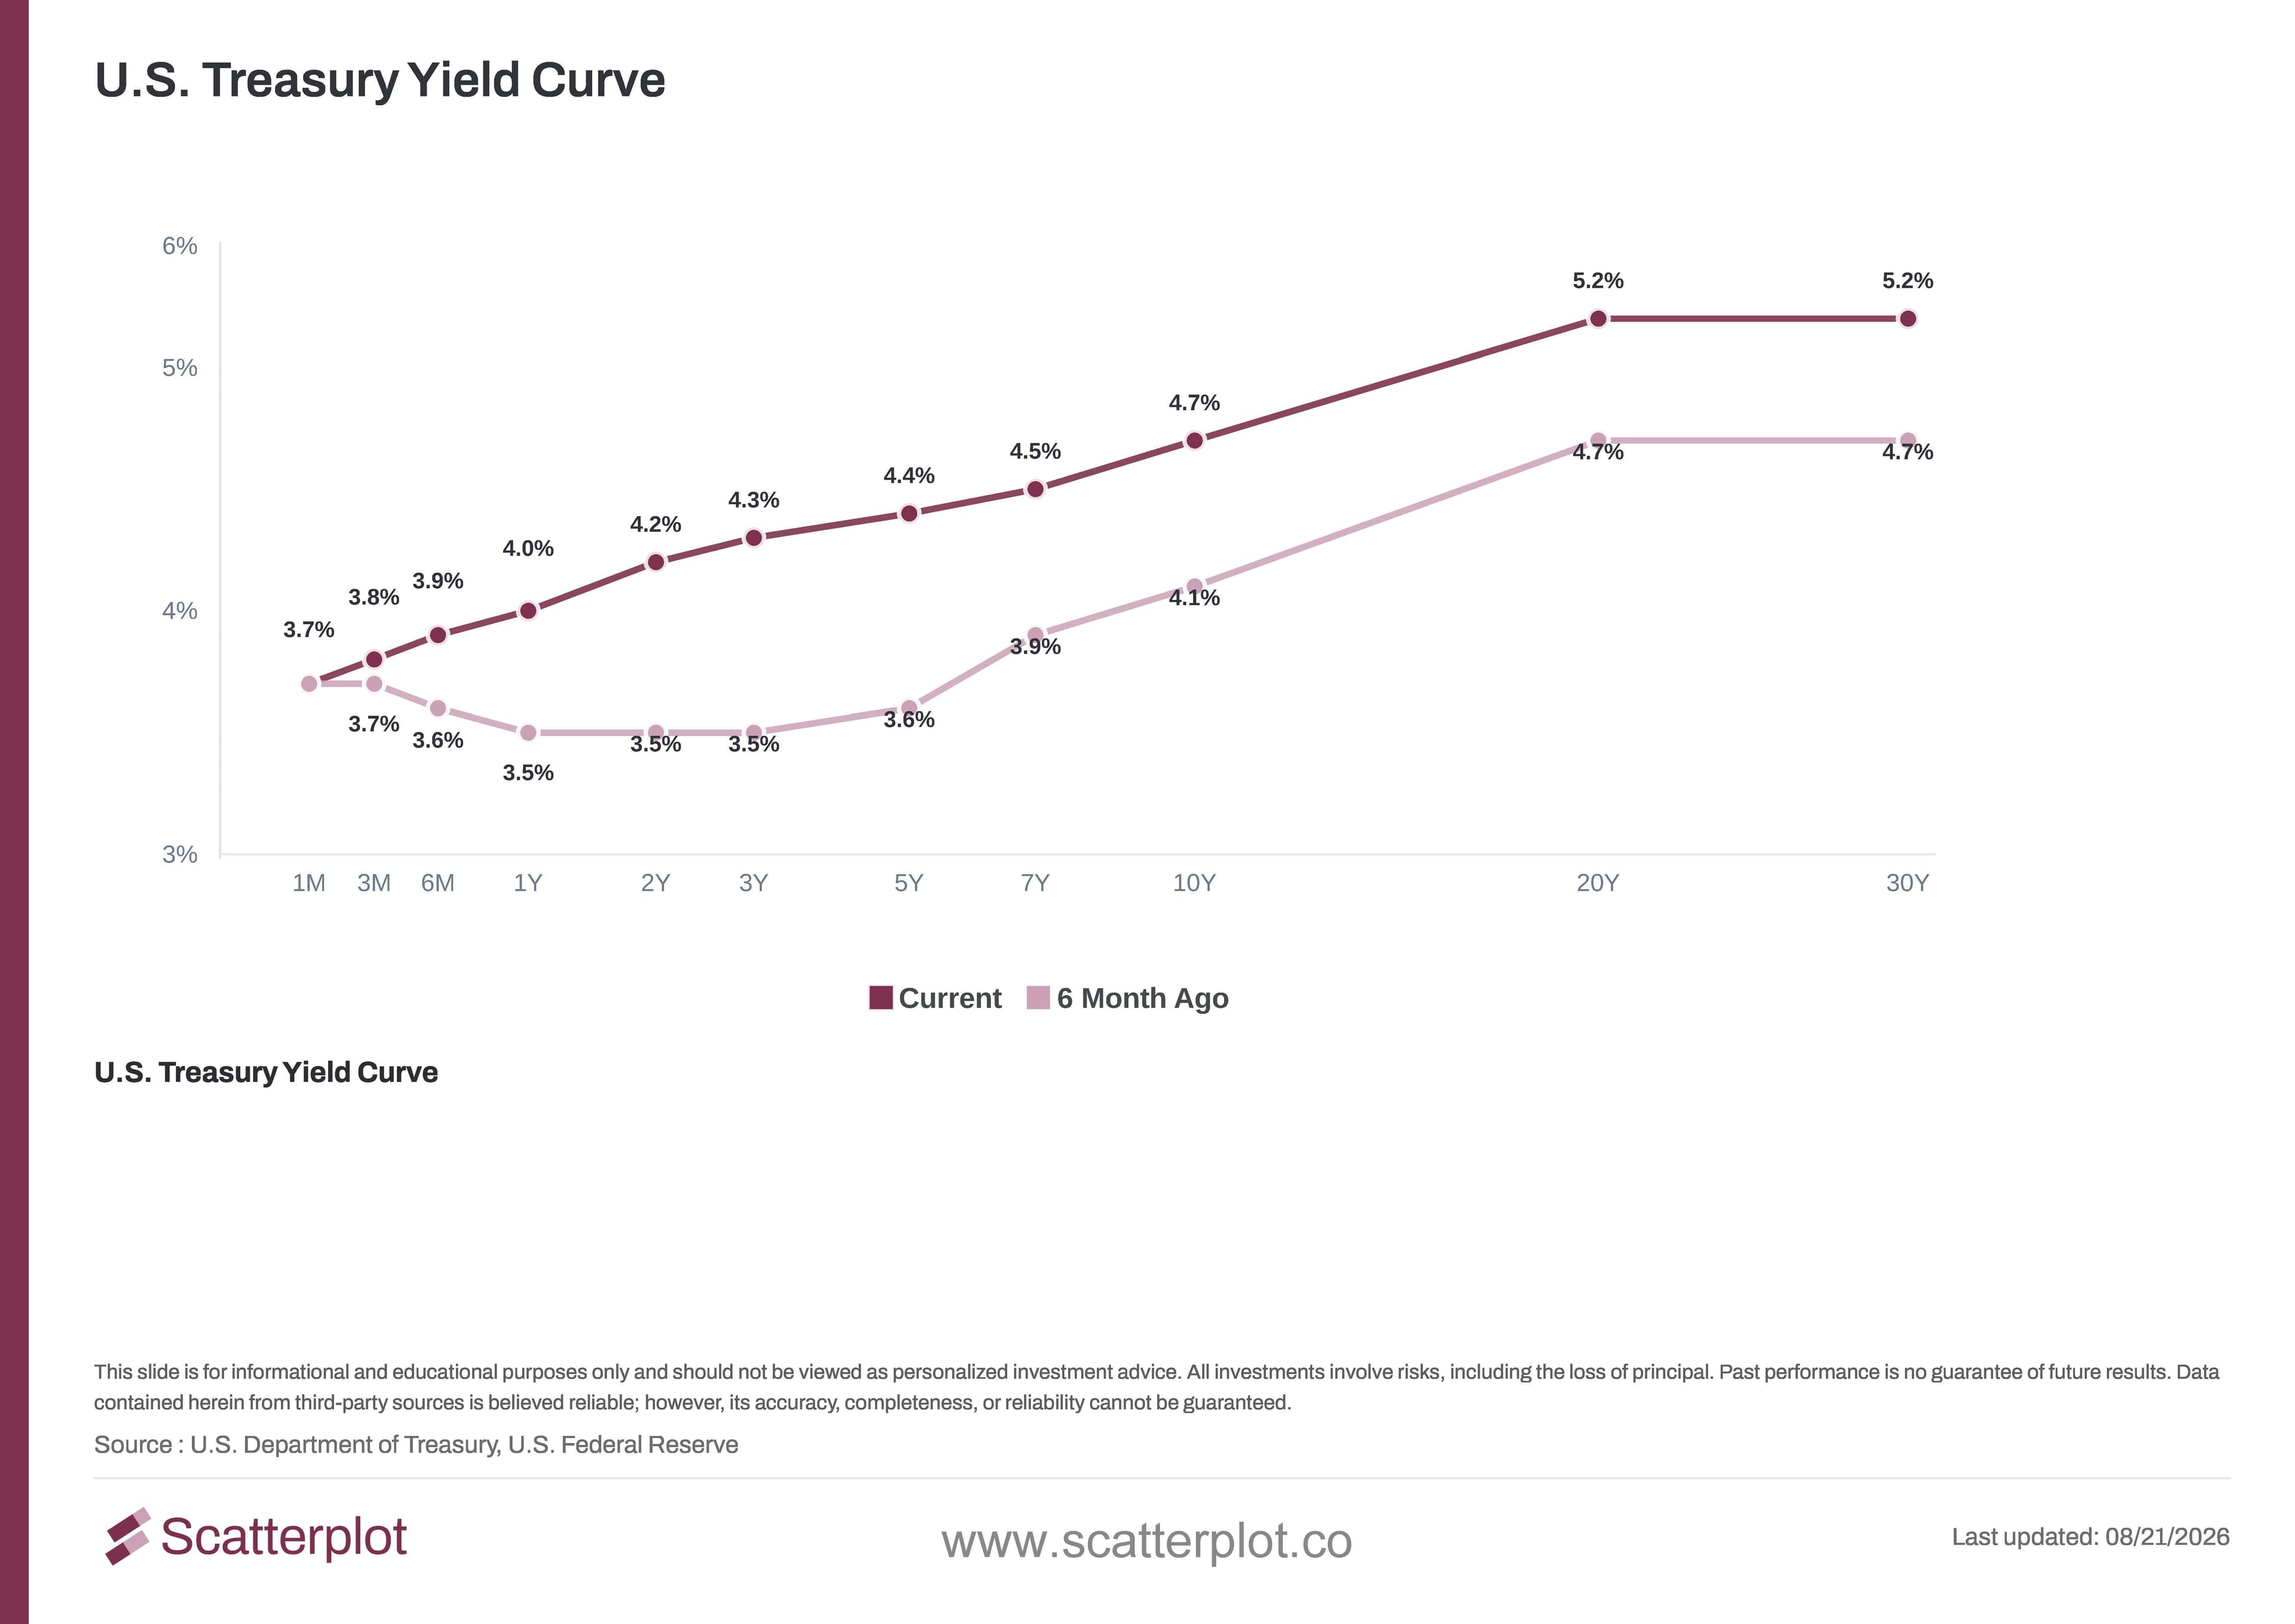
This chart updates daily. Track it live at scatterplot.co
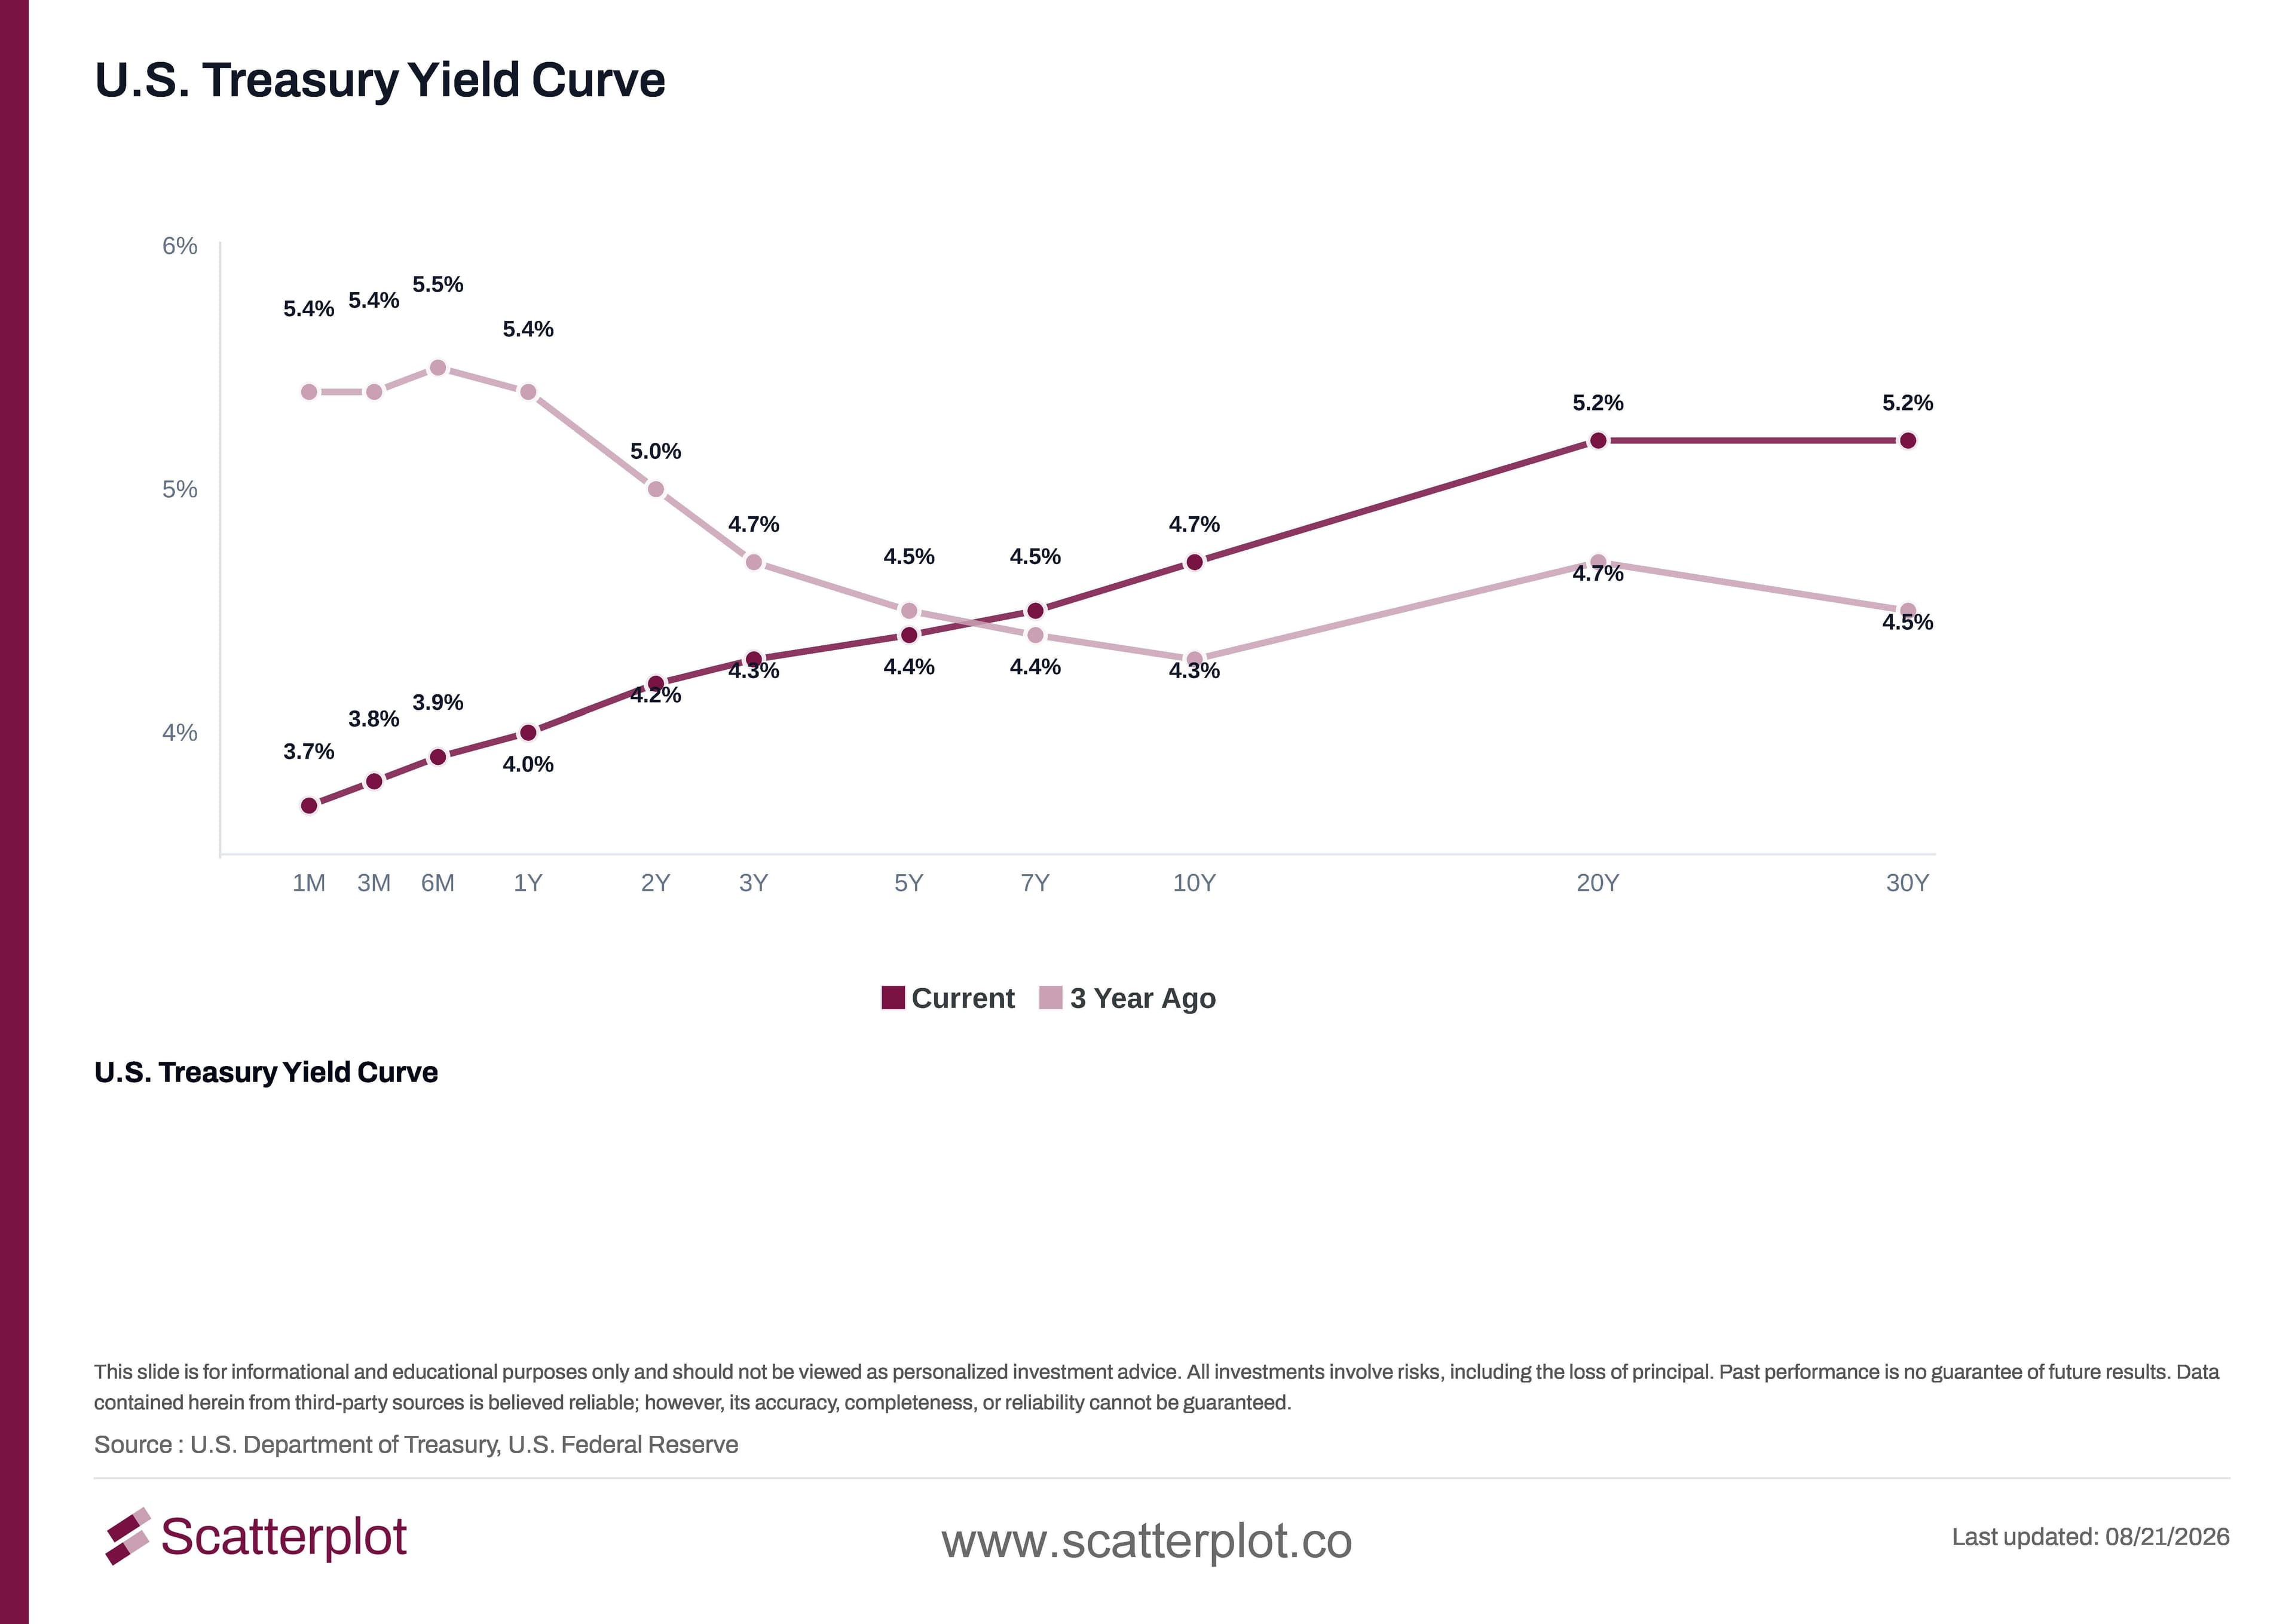
Now vs. 3 Years Ago
Three years ago the curve told almost the opposite story, with short rates sitting above long rates across most maturities.
This chart updates daily. Track it live at scatterplot.co
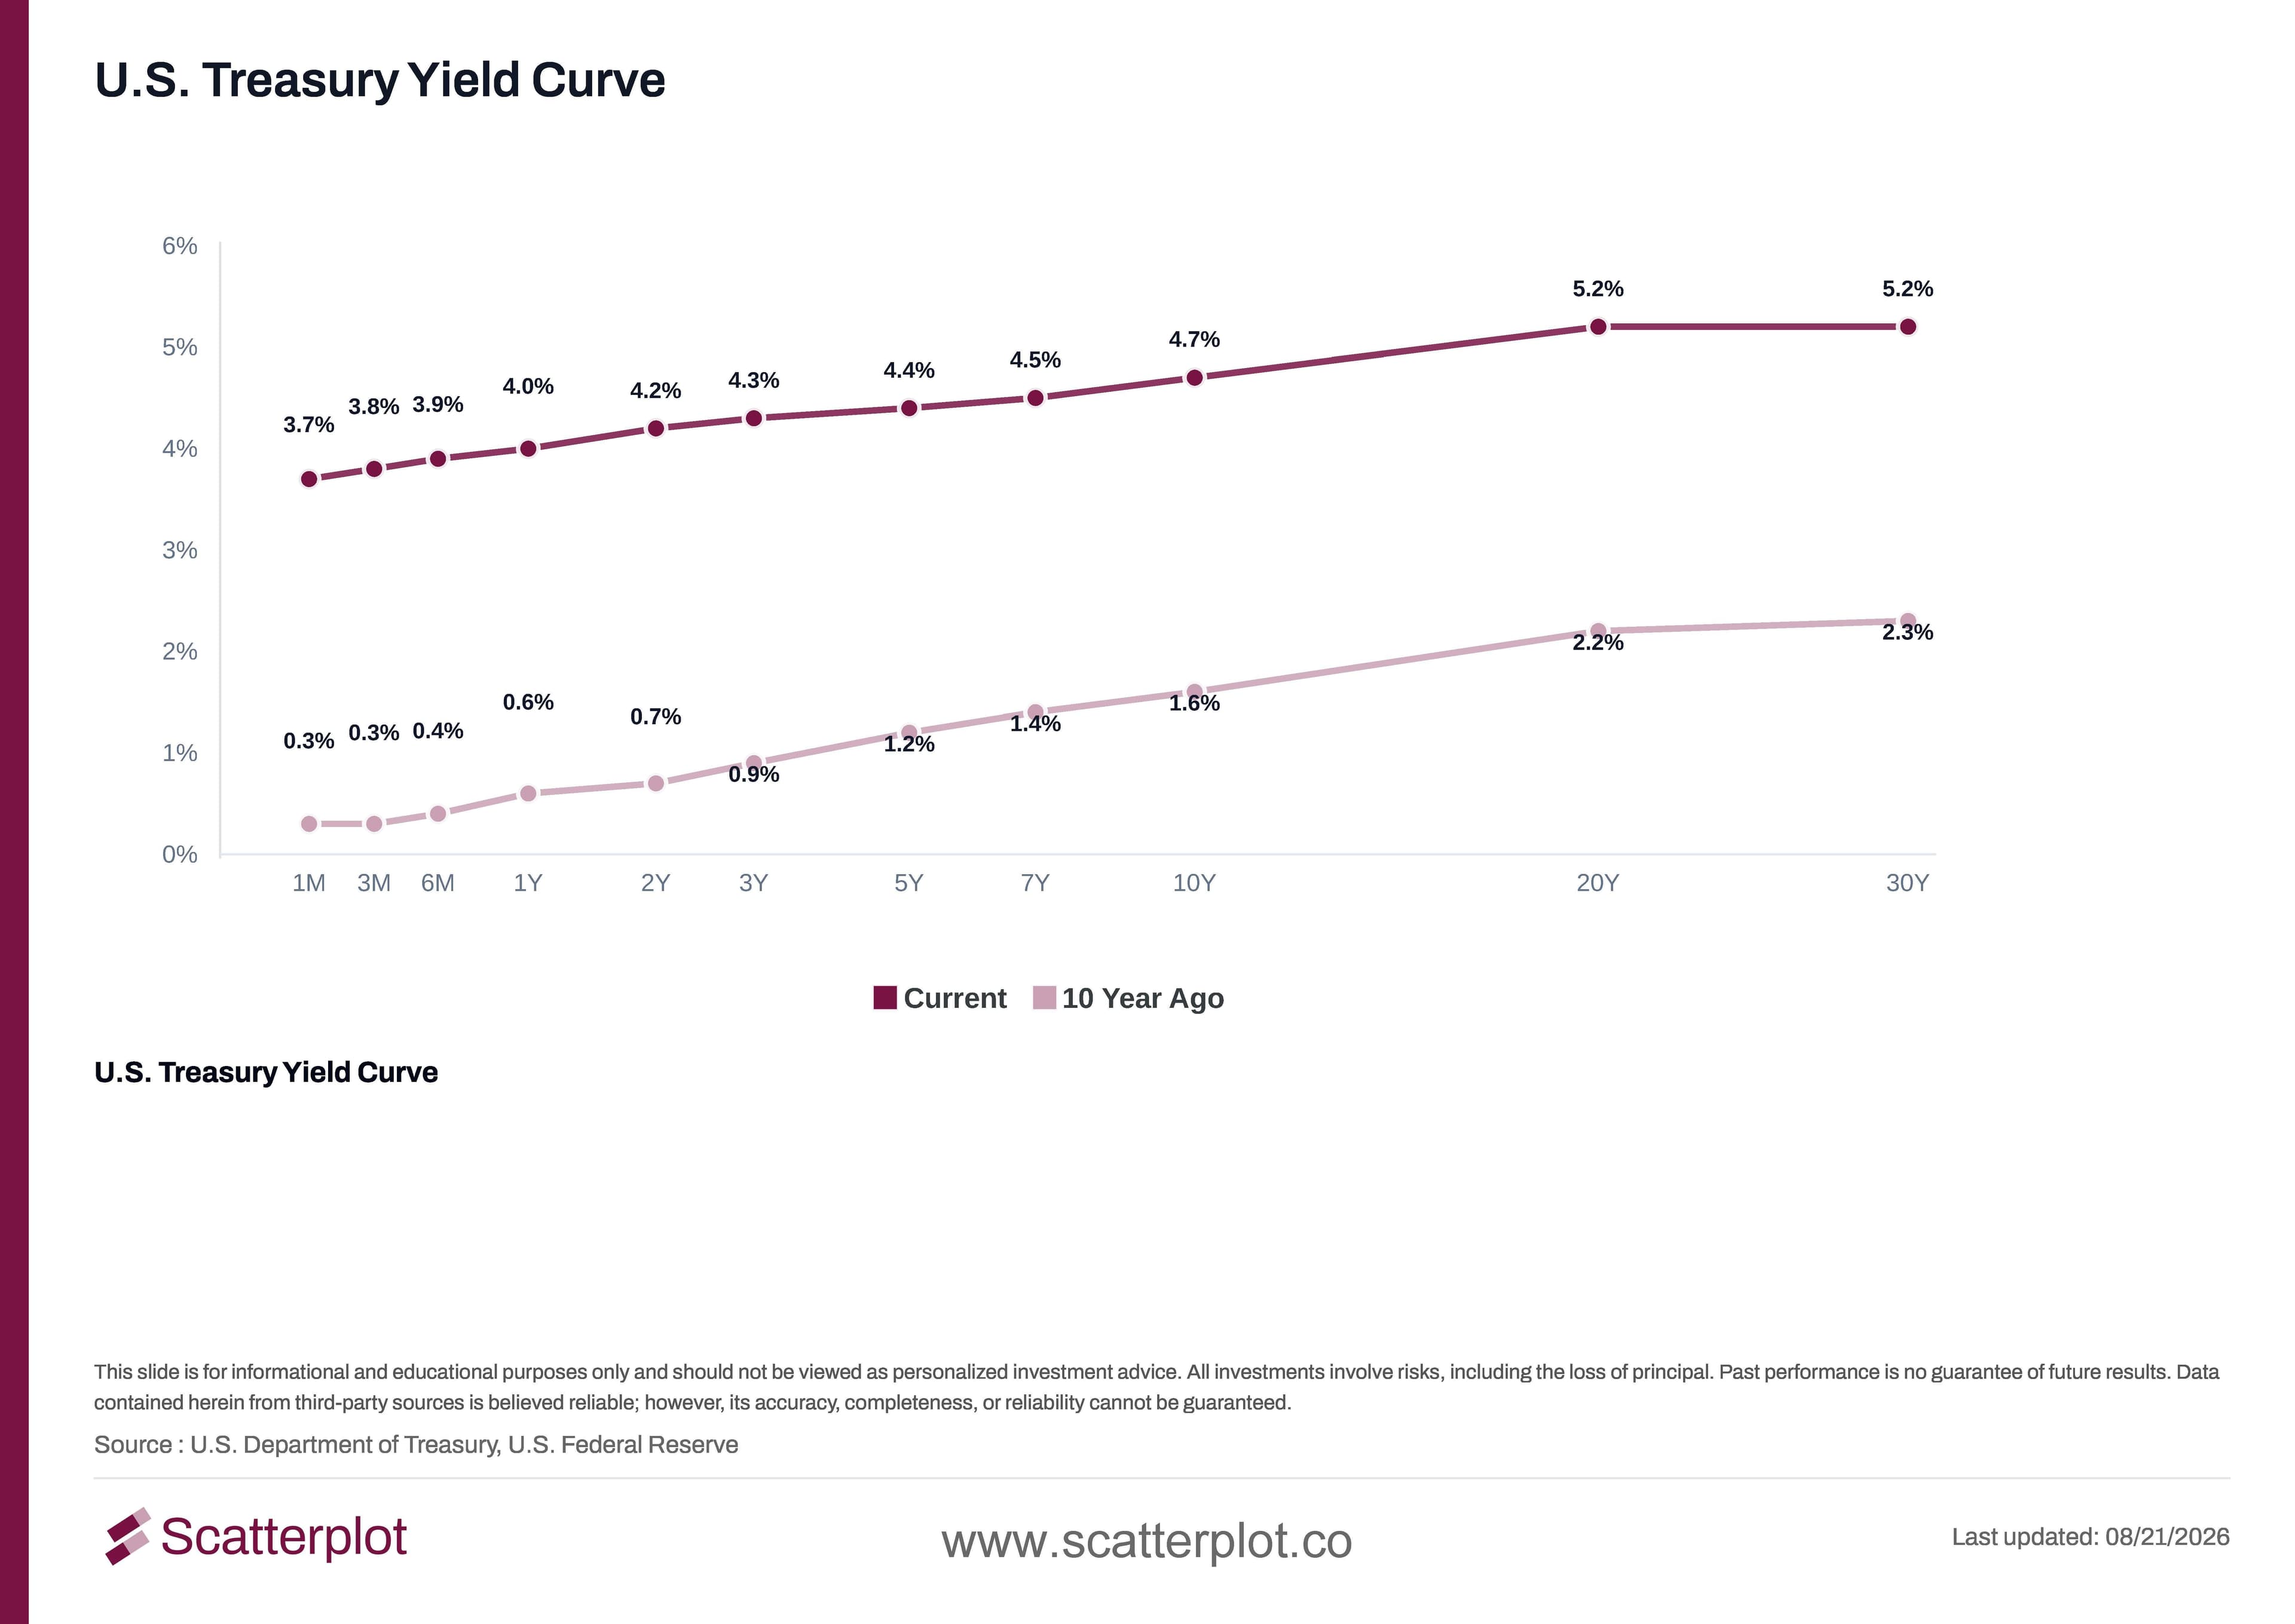
Now vs. 10 Years Ago
Ten years ago, in the era of near-zero short-term rates, the entire curve sat well below where it trades today.
This chart updates daily. Track it live at scatterplot.co
How are mortgage rates responding?
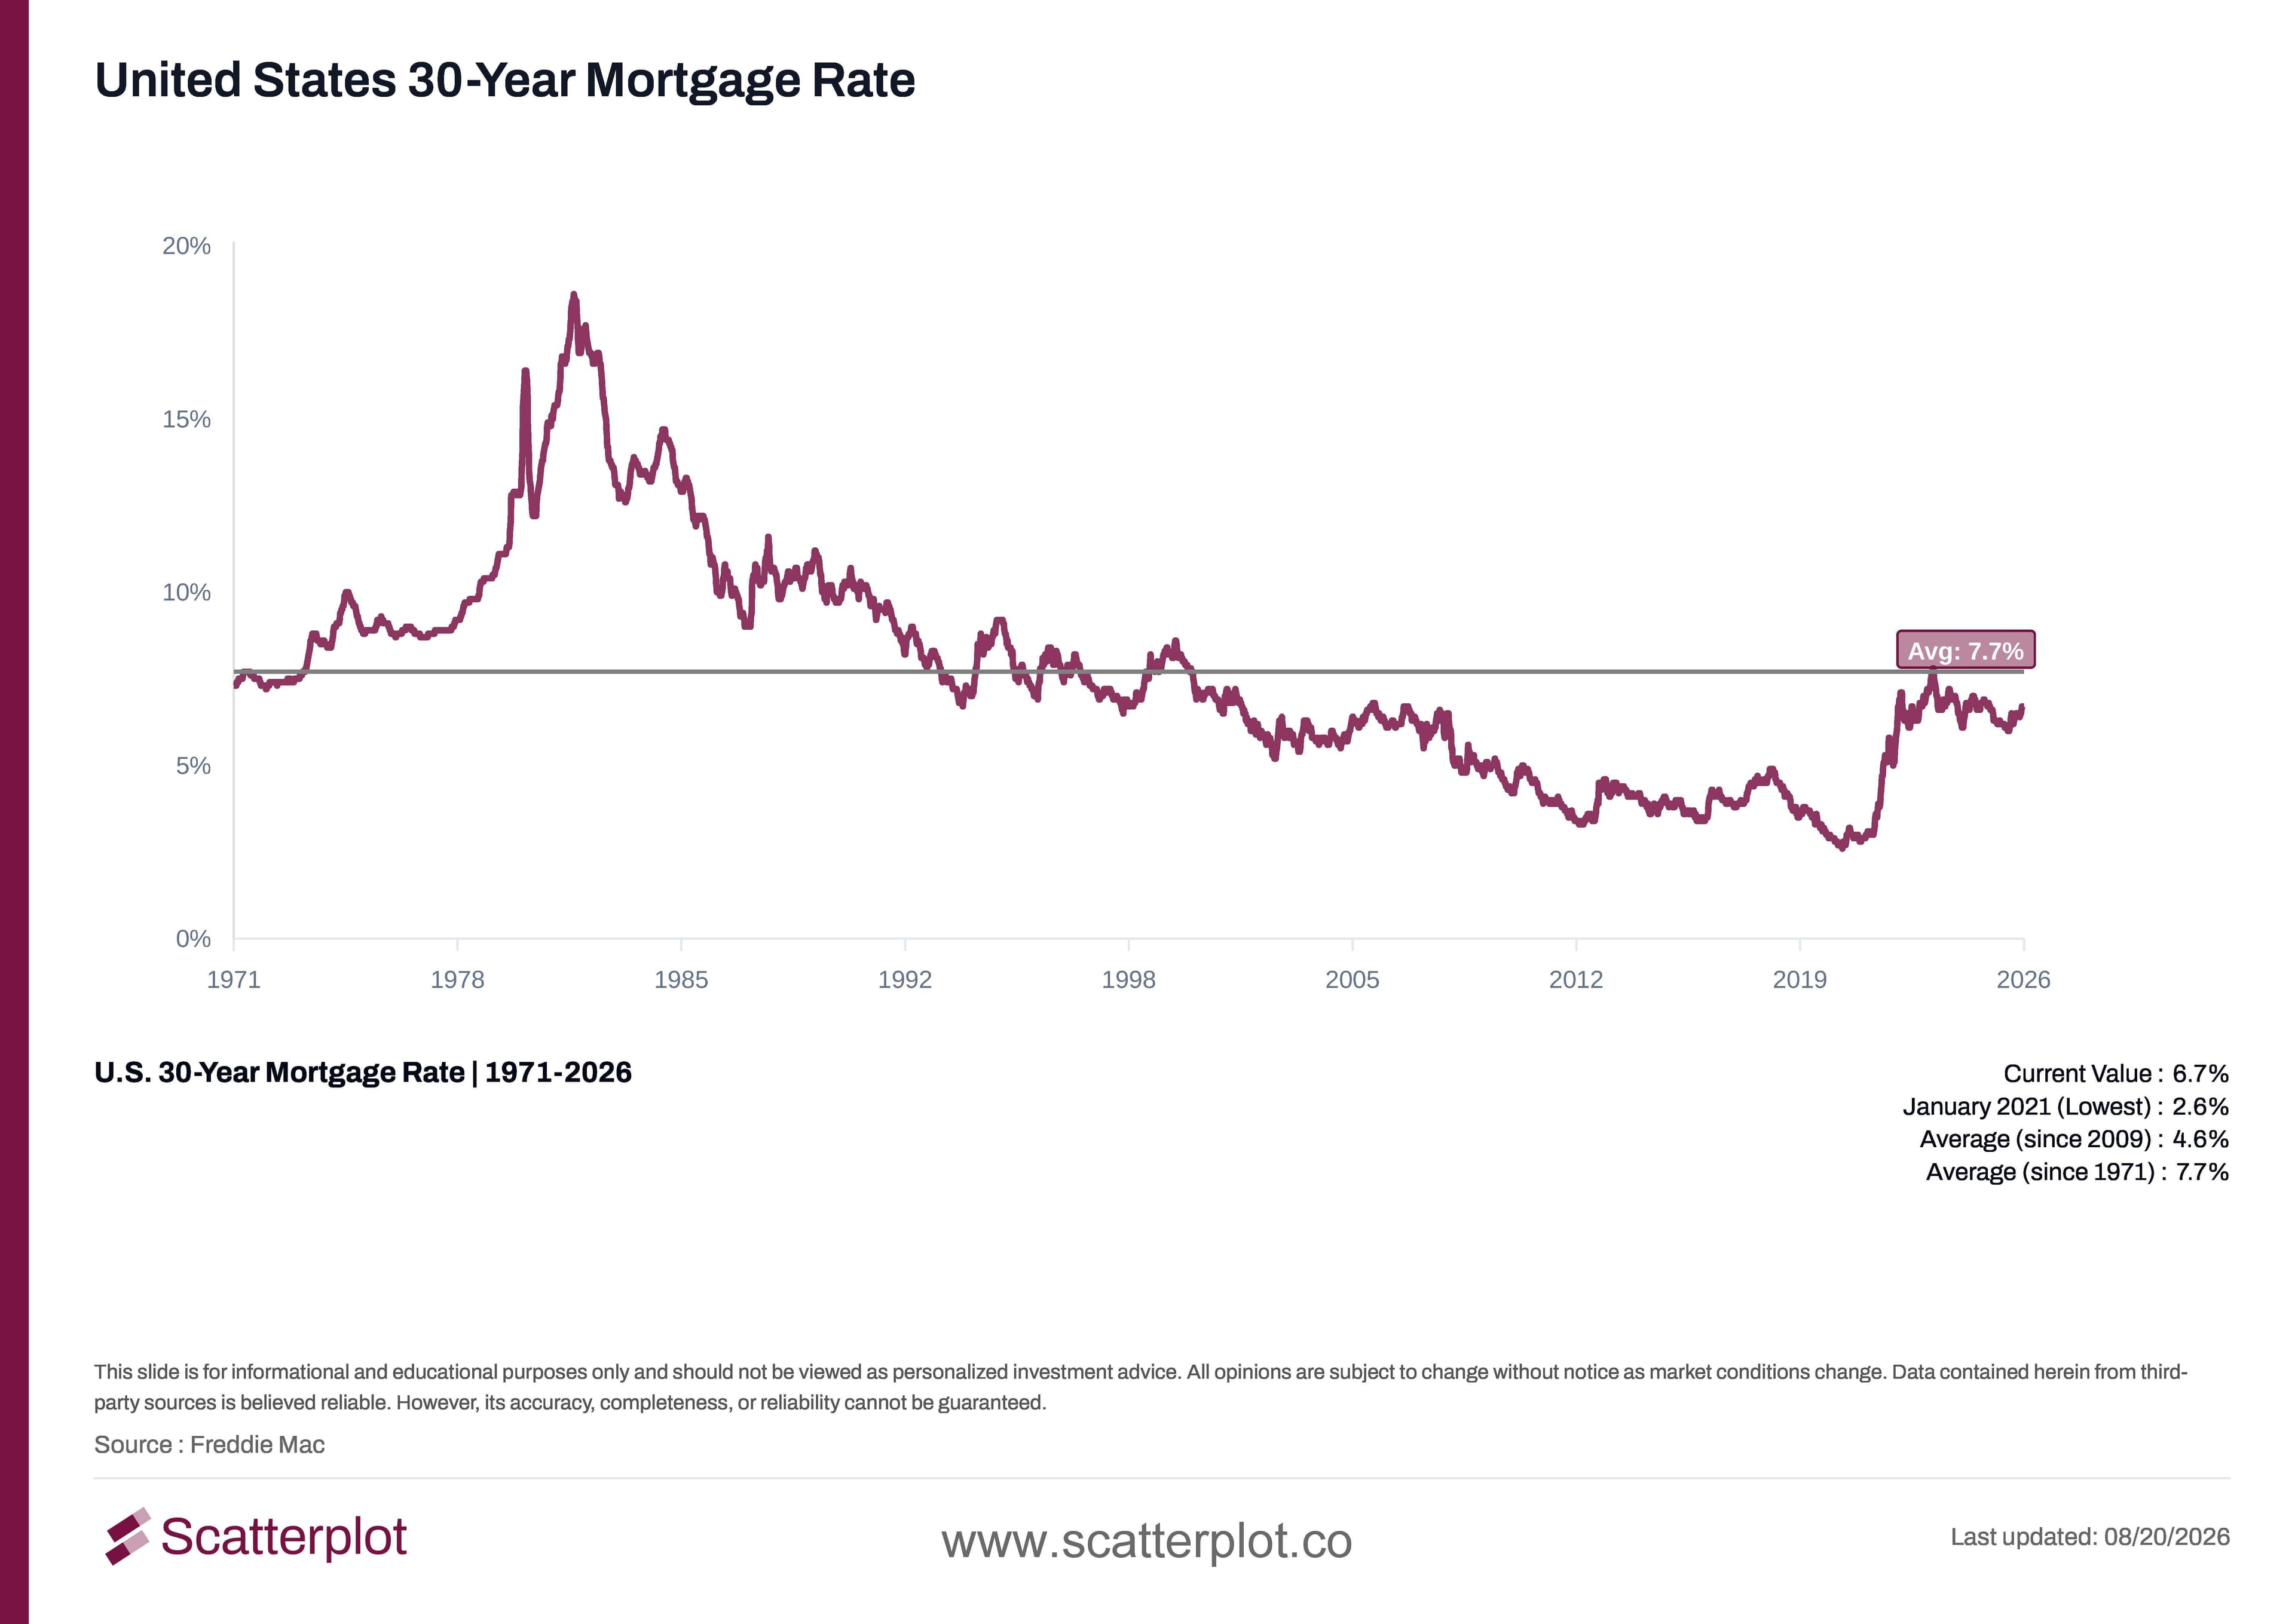
Higher Treasury yields continue to feed through to household borrowing costs. The average 30-year fixed mortgage rate was 6.65% as of August 20, according to Freddie Mac. That is up from 5.98% in late February and keeps mortgage borrowing costs well above the levels homeowners became accustomed to during the low-rate period.
The connection is not one-for-one. Despite both being described as 30-year instruments, mortgage rates are generally more closely linked to the 10-year Treasury yield, with an additional spread reflecting factors including credit, liquidity and prepayment risk.
This chart updates daily. Track it live at scatterplot.co
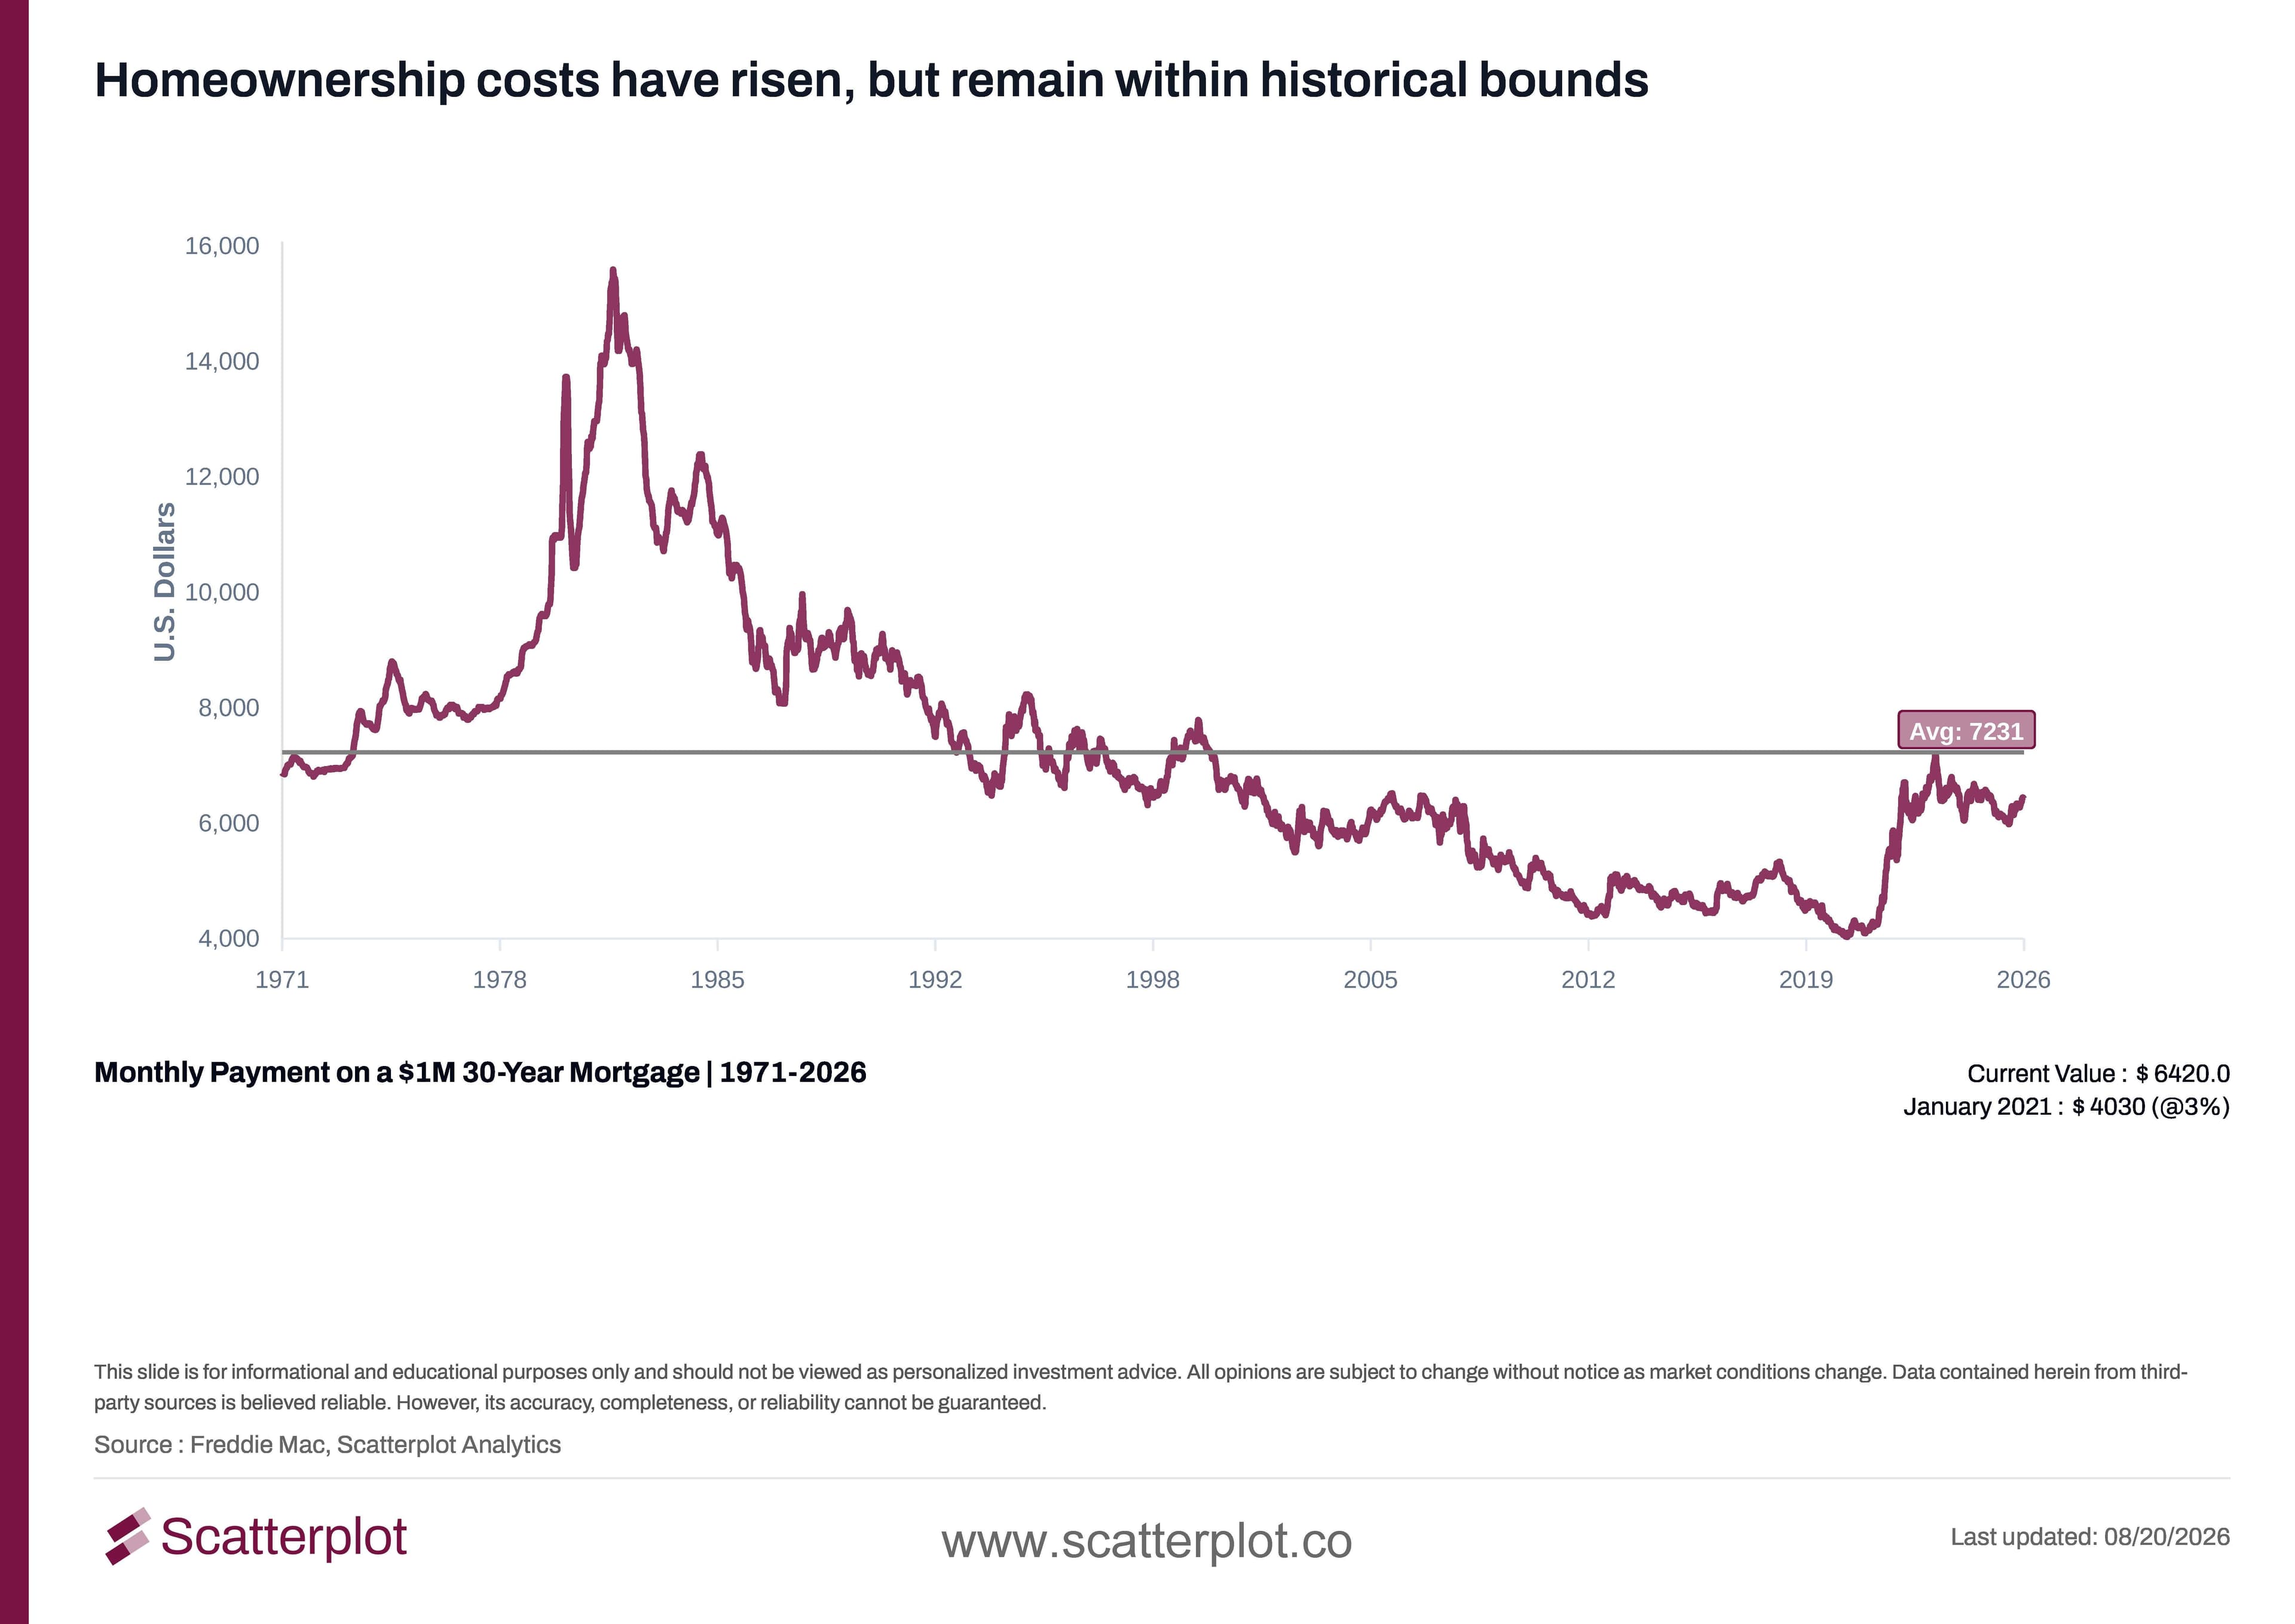
On a $1 million mortgage, that move translates directly into a higher monthly payment. In January 2021, before the Fed's historic rate hiking cycle, that payment was $4,030. Today it's $6,420, an increase of 59.3%.
This chart updates daily. Track it live at scatterplot.co
What does this mean for the federal budget?
As older, lower-rate debt rolls over into today's higher yields, net interest payments on federal debt continue to climb.
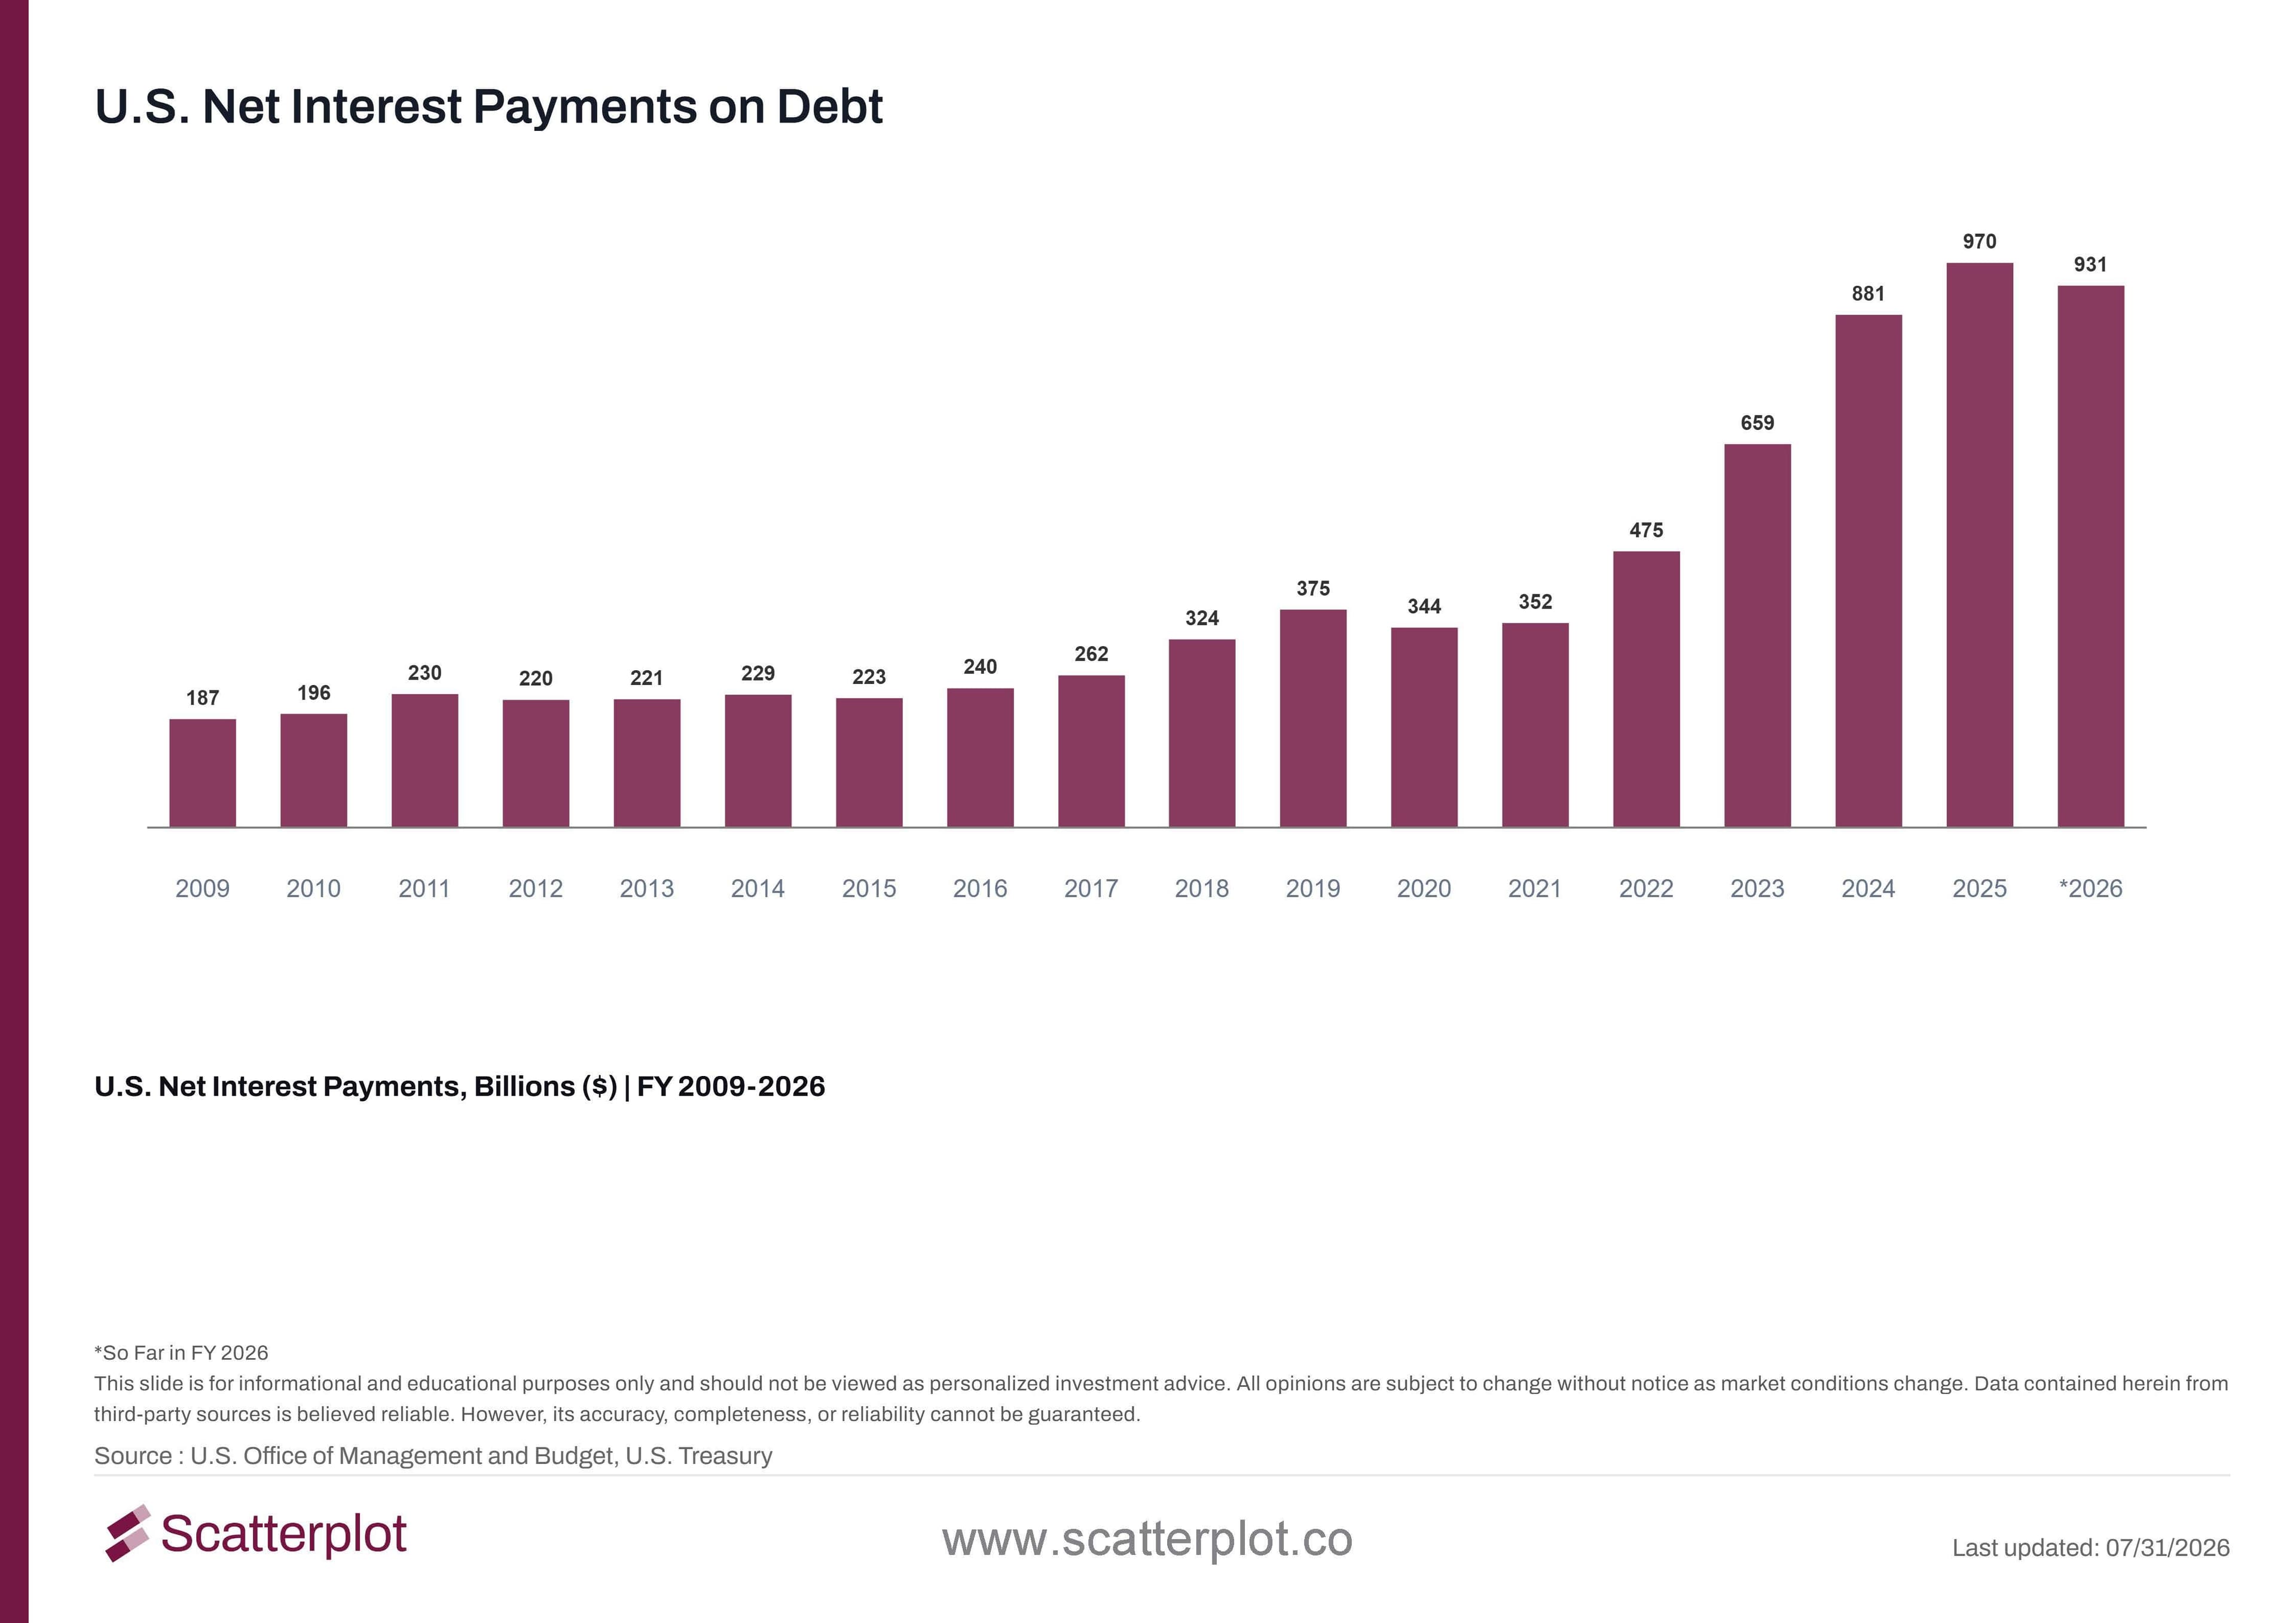
This chart updates daily. Track it live at scatterplot.co
The average rate the government pays across all its outstanding debt tells the same story: 1.56% in January 2022 versus 3.45% today, more than double. On top of a debt load that keeps growing, that means every dollar the government borrows now costs more to service than it did four years ago.
For more on the fiscal picture behind this, see our earlier post on the FY2026 debt and interest outlook.
Frequently Asked Questions
Why did the 30-year Treasury yield reach a 19-year high?
Long-term Treasury yields reflect expectations for inflation, economic growth and future short-term interest rates, as well as Treasury supply and the term premium investors demand for holding longer-duration securities. Persistent inflation concerns, large government borrowing needs and pressure across global bond markets have all contributed to higher long-term yields.
Does a higher 30-year yield mean the Fed raised rates?
No. The Fed directly sets its short-term policy rate. The 30-year Treasury yield is determined in the market and can move independently based on expectations for inflation, growth, fiscal policy, Treasury supply and future monetary policy.
How does the 30-year Treasury yield affect mortgage rates?
Mortgage rates tend to move with longer-term Treasury yields, but the 10-year Treasury is generally the more relevant benchmark. Mortgage rates typically trade at a spread above Treasury yields to compensate investors for risks including prepayment, credit and liquidity risk.
Why did Treasury double its long-term bond buybacks?
Treasury said the larger operations are intended to provide greater liquidity support in longer-dated nominal Treasury securities. The increase applies to the 10-to-20-year and 20-to-30-year sectors and raises the maximum purchase amount from $2 billion to at least $4 billion per operation. The program is a debt-management and liquidity tool, not monetary easing, and does not reduce the government's overall debt burden.
Disclosure
This content is provided for informational and educational purposes only and should not be relied upon as investment advice. No representation is made that any investment strategy or market view will be successful. Past performance is not indicative of future results. All investing involves risk, including the loss of principal. Please refer to our Terms and Conditions for more information.


Enjoyed this? Get more in your inbox.
Weekly insights for advisors
— charts, research, and practical tools. No fluff.
Market Insights
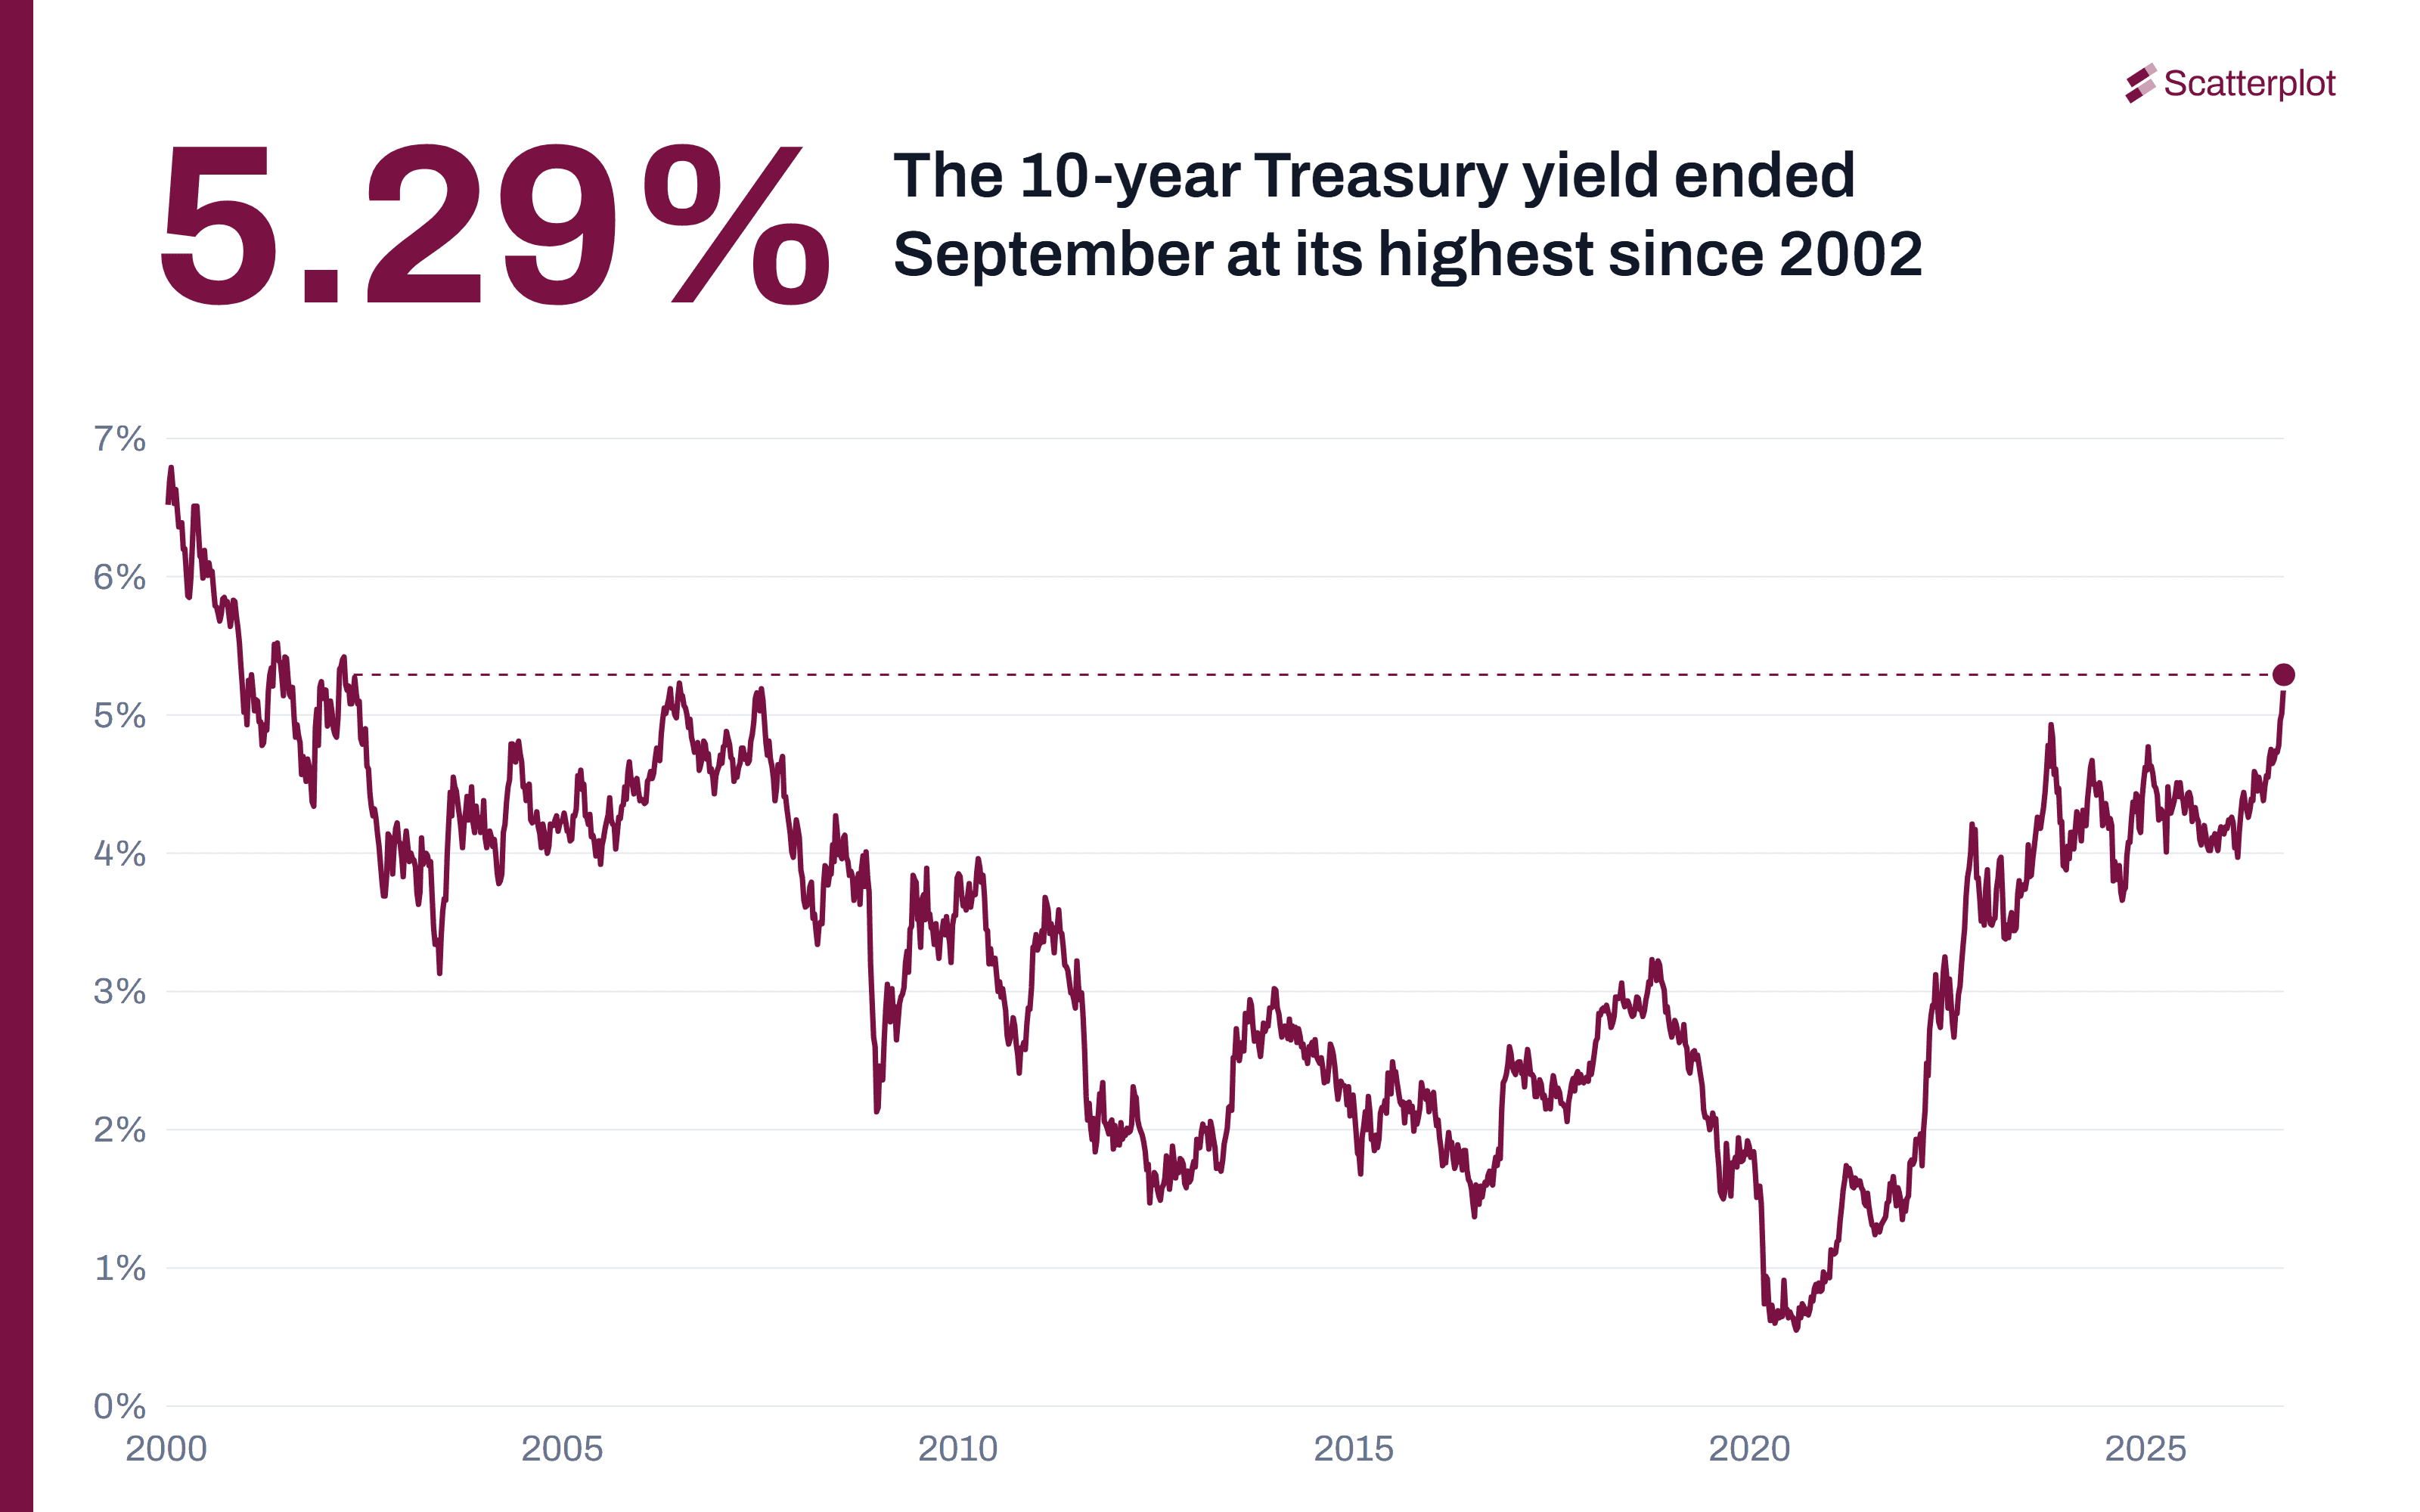
September 2026 Market Recap: The Fed Raises Rates and the 10-Year Treasury Yield Hits Its Highest Since 2002
A recap of the main market events of September 2026, in 13 charts.
Read moreSanjeev Pati, CFA
October 2, 2026 · 8 min read
Market Insights
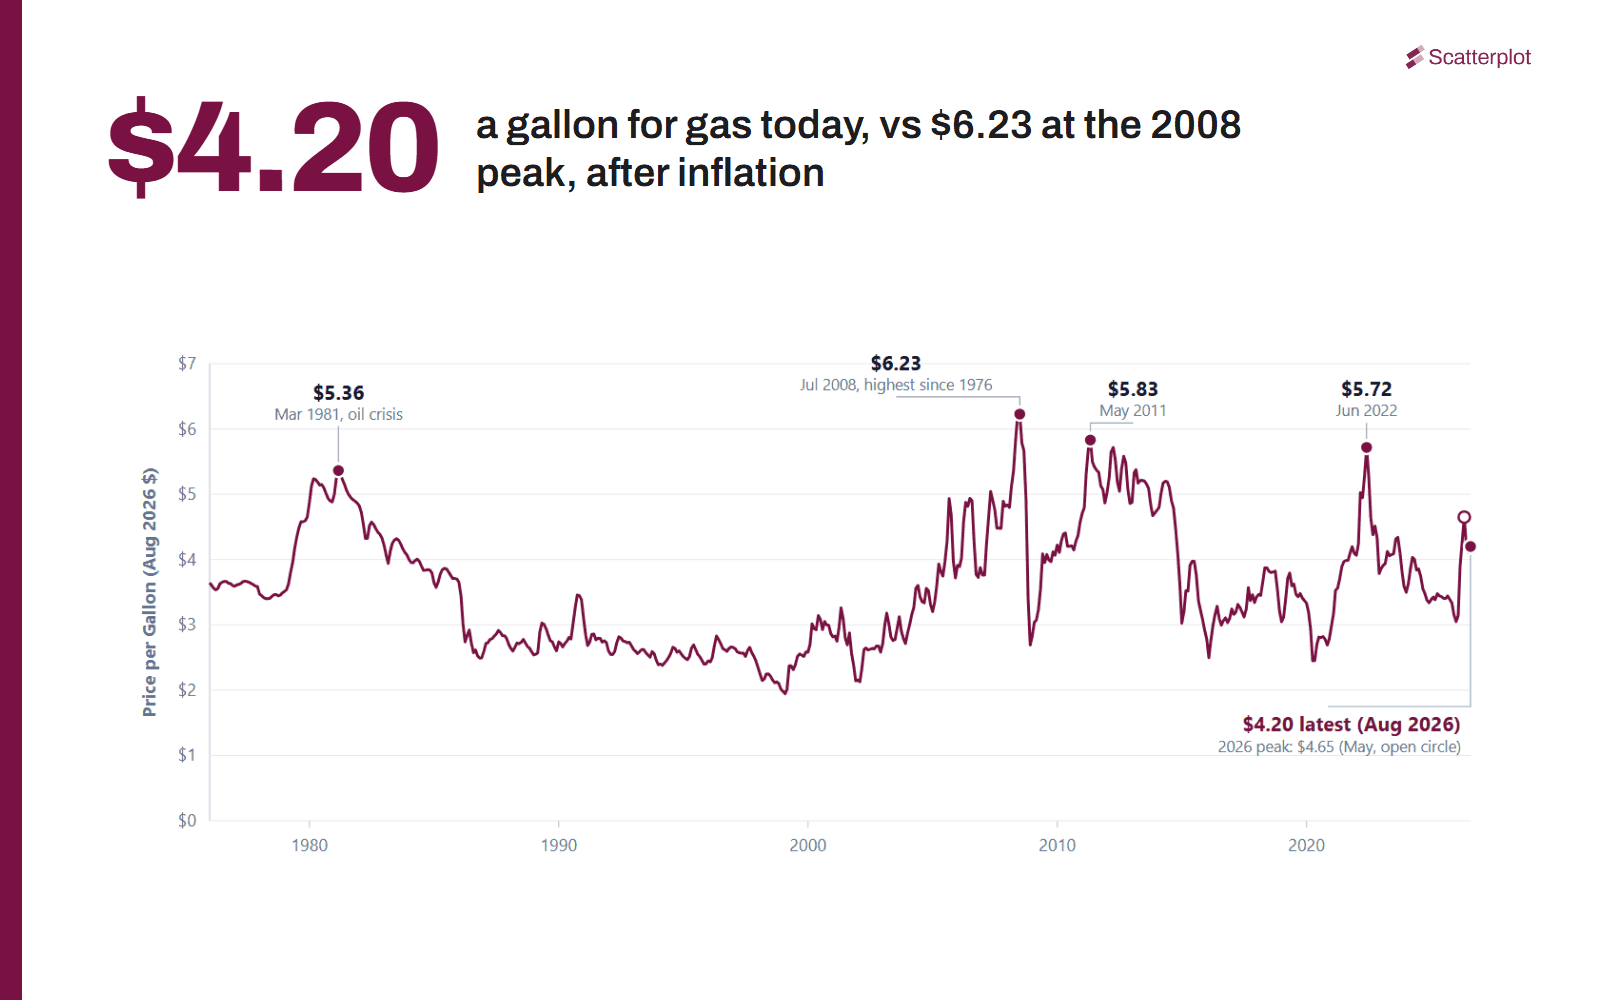
Why $100 Oil Hurts the U.S. Economy Less Than It Used To
Brent crude has traded above $100 a barrel repeatedly this year. That still stings. But the U.S. economy is less exposed to high oil prices than it was in the past, for three reasons.
Read moreSanjeev Pati, CFA
September 28, 2026 · 5 min read