
Data as of November 19, 2026.
Key takeaways
- Gold is the worst-performing asset class in 2026 through November 19, down 17.1%, after finishing first among the asset classes we track in both 2024 and 2025.
- Among the 11 rows of the asset class quilt, the 60/40 portfolio ranked between third and eighth in every year from 2016 to 2025, never first or last.
- U.S. equity (SPY) is down 5.3% in November through the 19th, a partial month, more than in any of the 12 full months before it on the monthly sector quilt.
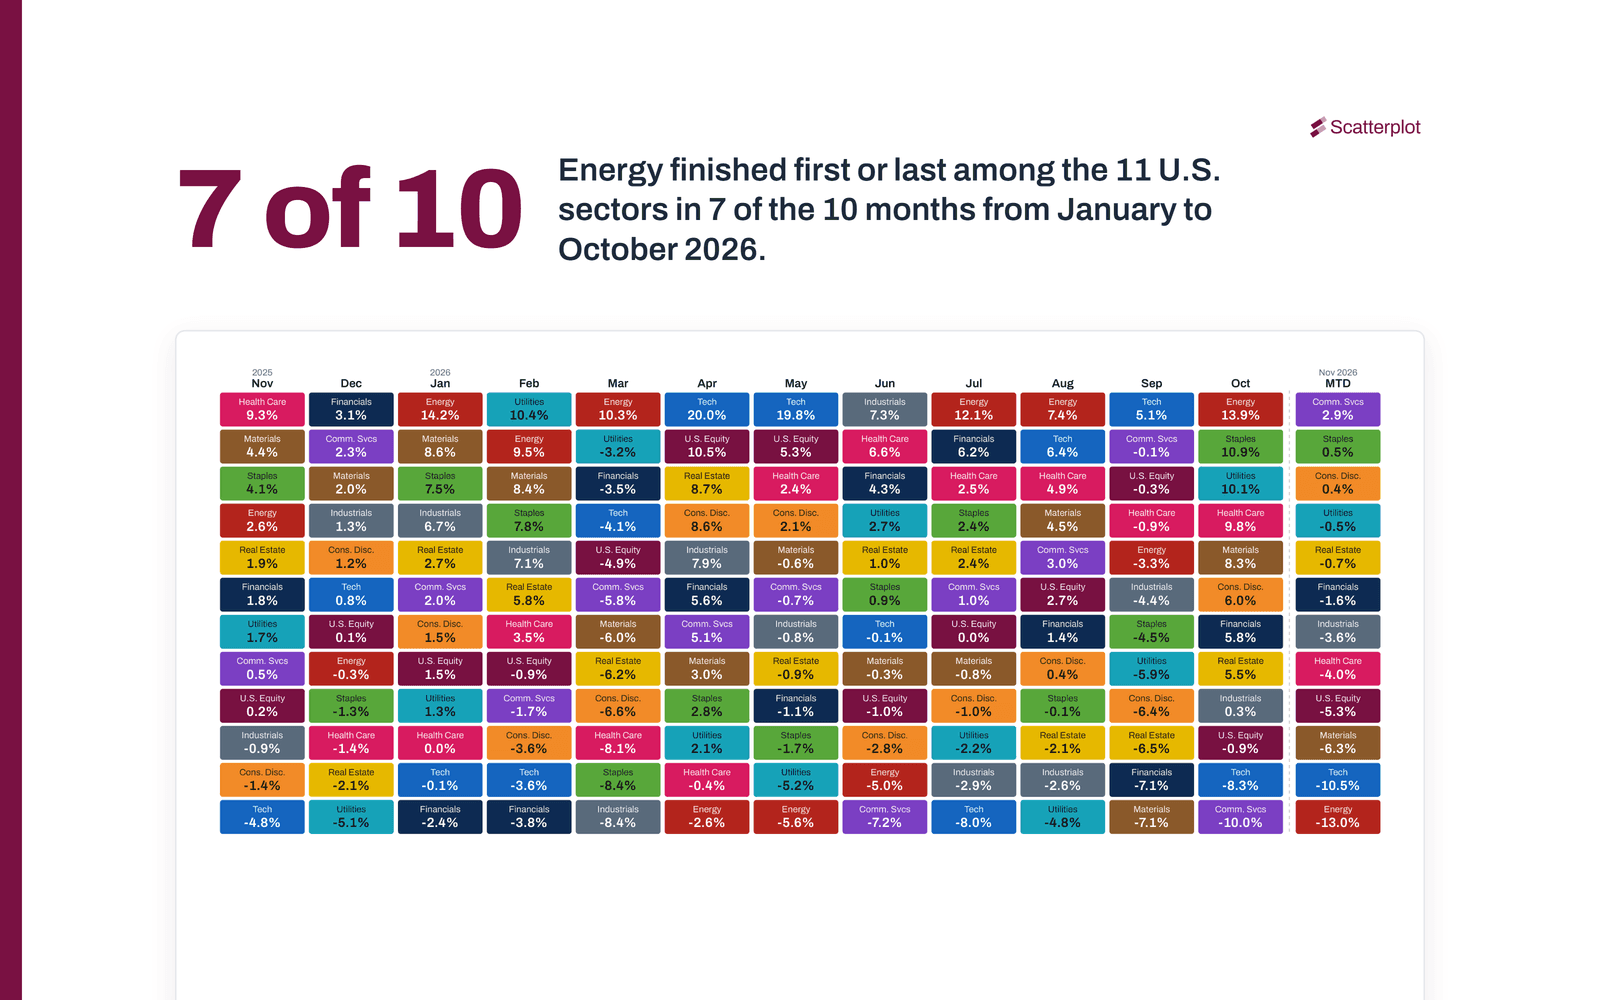
- Energy finished first or last among the 11 U.S. sectors in 7 of the 10 months from January to October 2026, and technology or energy was the top sector in 8 of the 10 years from 2016 to 2025.
What a quilt chart shows
A quilt chart ranks the returns of a group of investments from best to worst in each period and gives each investment one colour. Go down a column to see what led and what lagged in that period, then follow one colour across the columns to see how its rank changed.
Asset class quilt chart
The asset class quilt ranks 10 asset classes and a 60/40 portfolio: U.S. large-cap and small-cap stocks, international developed and emerging market stocks, U.S. bonds, high yield bonds, REITs, commodities, cash and gold, plus a portfolio of 60% U.S. equity and 40% U.S. bonds. Both versions are in the portal’s Investing Principles section.
Annual
Each calendar year from 2016 to 2025, 2026 to date, and each row’s annualized return from 2016 to 2025.

Monthly
The last 12 full months and the current month to date.

Sector quilt chart
The sector quilt ranks the 11 U.S. equity sectors, with U.S. equity as a twelfth row for comparison. Both versions are in the portal’s Markets section.
Annual
Each calendar year from 2016 to 2025, 2026 to date, and each sector’s annualized return from 2016 to 2025.

Monthly
The last 12 full months and the current month to date.

These charts update daily. Track them live at scatterplot.co.
Market observations
Gold went from first to last
In 2026 through November 19, U.S. equity (SPY) is up 5.8%, and gold is the worst-performing asset class, down 17.1% at the spot price early on November 20, when the chart was updated. Gold was the best-performing asset class we track in both 2024, at 27.2%, and 2025, at 64.6%. An earlier post looks at how recent returns shape what investors expect.
The 60/40 portfolio stays in the middle. From 2016 to 2025 it never finished first or last, ranking between third and eighth each year, and it is up 3.2% so far in 2026.
November so far
In November through the 19th, 9 of the 10 asset classes are down, and cash, up 0.2%, is the exception; the 60/40 portfolio is down 3.3%. U.S. equity (SPY), the comparison row on the monthly sector quilt, is down 5.3% month to date. The other 12 columns on that chart are full months, back to November 2025, and the weakest of them was March, down 4.9%.
Energy: first or last in 7 of 10 months
From January to October 2026, energy finished either first or last among the 11 sectors in 7 of the 10 months. It was first in January, March, July, August and October, and last in April and May. Across the ten calendar years from 2016 to 2025, energy was first or last in seven: first in 2016, 2021 and 2022, and last in each year from 2017 to 2020. For background on oil, see why $100 oil hurts the U.S. economy less than it used to.
Energy and tech
Technology or energy was the top sector in eight of the ten calendar years from 2016 to 2025. Technology led in 2017, 2019, 2020, 2023 and 2025, and energy in 2016, 2021 and 2022. The two exceptions were health care in 2018 and communication services in 2024. The same held in 8 of the 10 months from January to October 2026, when utilities led in February and industrials in June.
Chart notes
Asset class quilts: asset classes are represented by IWB (U.S. large cap, Russell 1000), IWM (U.S. small cap, Russell 2000), EFA (international developed), IEMG (emerging markets), AGG (U.S. bonds), HYG (high yield), VNQ (REITs), DBC (commodities), BIL (cash, 1-3 month Treasury bills) and the gold spot price. The 60/40 portfolio is hypothetical: 60% SPY (U.S. equity) and 40% AGG, rebalanced daily. ETF returns are total returns including reinvested distributions; gold is the spot price return. Gold’s year-to-date figure in the yearly quilt uses the spot price at the chart’s morning update (early November 20 for the figures in this article), a few hours after the ETFs’ November 19 closing prices; the monthly quilt ends gold at the same date as the ETFs.
Sector quilts: sectors are represented by the Select Sector SPDR ETFs XLC (Communication Services), XLY (Consumer Discretionary), XLP (Consumer Staples), XLE (Energy), XLF (Financials), XLV (Health Care), XLI (Industrials), XLK (Information Technology), XLB (Materials), XLRE (Real Estate) and XLU (Utilities); U.S. equity is SPY. Returns are total returns including reinvested distributions. XLC began trading in June 2018, before Communication Services became a sector in September 2018. The chart leaves out its partial 2018 return, so its first calendar year is 2019 and its annualized return covers 2019 to 2025. Rankings in this article count the 11 sectors and leave out the U.S. equity row; 2016 to 2018 have 10 sectors.
All quilts: returns include each ETF’s expense ratio, as reflected in its price, but not transaction costs, advisory fees or taxes. The annualized column covers the full calendar years shown in its header and excludes the current year. Monthly columns are compounded from daily total returns. The month-to-date column runs through the most recent close when the chart was last updated.
Disclosures
This article is for informational and educational purposes only and is not personalized investment advice or a recommendation to buy, sell or hold any security. References to specific funds illustrate general market concepts. All investments involve risks, including the loss of principal. Past performance is no guarantee of future results. ETF performance may differ from the underlying index because of fees and expenses. Returns across asset classes are not directly comparable because of differing risk, volatility and market dynamics. Sector-concentrated investments may involve greater risk and volatility than diversified investments. Returns over periods as short as one month can vary widely and may not reflect longer-term results. Data from third-party sources is believed reliable, but its accuracy, completeness or reliability cannot be guaranteed. Talk with a financial professional about your own situation.
Sources
- Scatterplot Analytics, Asset Class Returns Ranked by Year and Ranked by Month, data through November 19, 2026.
- Scatterplot Analytics, U.S. Sector Returns Ranked by Year and Ranked by Month, data through November 19, 2026.