

U.S. Market Concentration: The Largest Companies Are Gaining Weight, and a Bigger Share of Profits
Are the companies with the largest index weights also responsible for a substantial share of the index's aggregate financial results ? The data says they are.

Sanjeev Pati, CFA
Founder, Scatterplot
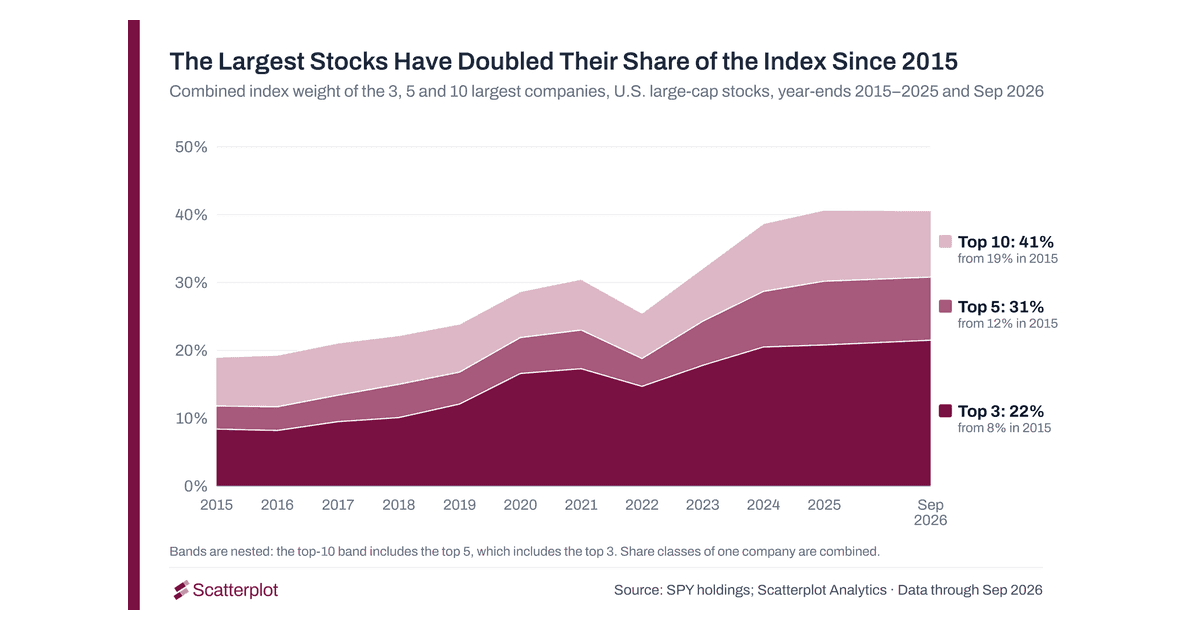
There has been a lot of discussion about how concentrated the US stock market has become, and the discussion is right about the fact. The ten largest companies were 19% of the US large-cap index (SPY) at the end of 2015. At the end of September 2026 they were 41%.
Index investing, and the mechanical flow it sends towards the largest names, is often cited as a reason. So is investor enthusiasm for particular themes. Both are commonly cited explanations, with supporting academic research. Gabaix and Koijen, in "The Inelastic Markets Hypothesis" (2021), find that money flowing into the stock market moves prices far more than its size would suggest.[1] Jiang, Vayanos and Zheng, in "Passive Investing and the Rise of Mega-Firms" (Review of Financial Studies, 2025), find that flows into passive funds raise the prices of the largest companies disproportionately, most of all those in high demand from other investors.[2] But in our view, above all of that, the underlying performance of the businesses matters, especially among large companies.
Rather than trying to separate the effects of investor flows and sentiment, we compared the largest companies' index weights with their underlying financial results. At every year-end from 2016 to 2025 we measured the ten largest companies' share of the index's net income, and the ten largest non-financial companies' share of its non-financial operating cash flow and capital spending, using whichever companies were largest at each date. What the comparison shows is that the largest companies' growing share of the index's profits, cash flow and investment has accompanied the rise in their market weight.
Key takeaways
- The ten largest companies went from 19% of the index at the end of 2015 to 41% in September 2026. The three largest went from 8% to 22%.
- Their share of the index's net income went from 21% at the end of 2016 to 35% at the end of 2025.
- The ten largest non-financial companies' share of non-financial operating cash flow went from 21% to 33%, and of capital spending from 17% to 34%.
- The five largest companies at the end of 2025 were 30% of the index and about 25% of its net income, and about 25% of its non-financial companies' operating cash flow and capital spending.
- Market concentration is a Global phenomena and most countries in the world have equity markets far more concentrated than the US Equity market.
1. How concentrated is the US stock market? The ten largest companies have doubled their share
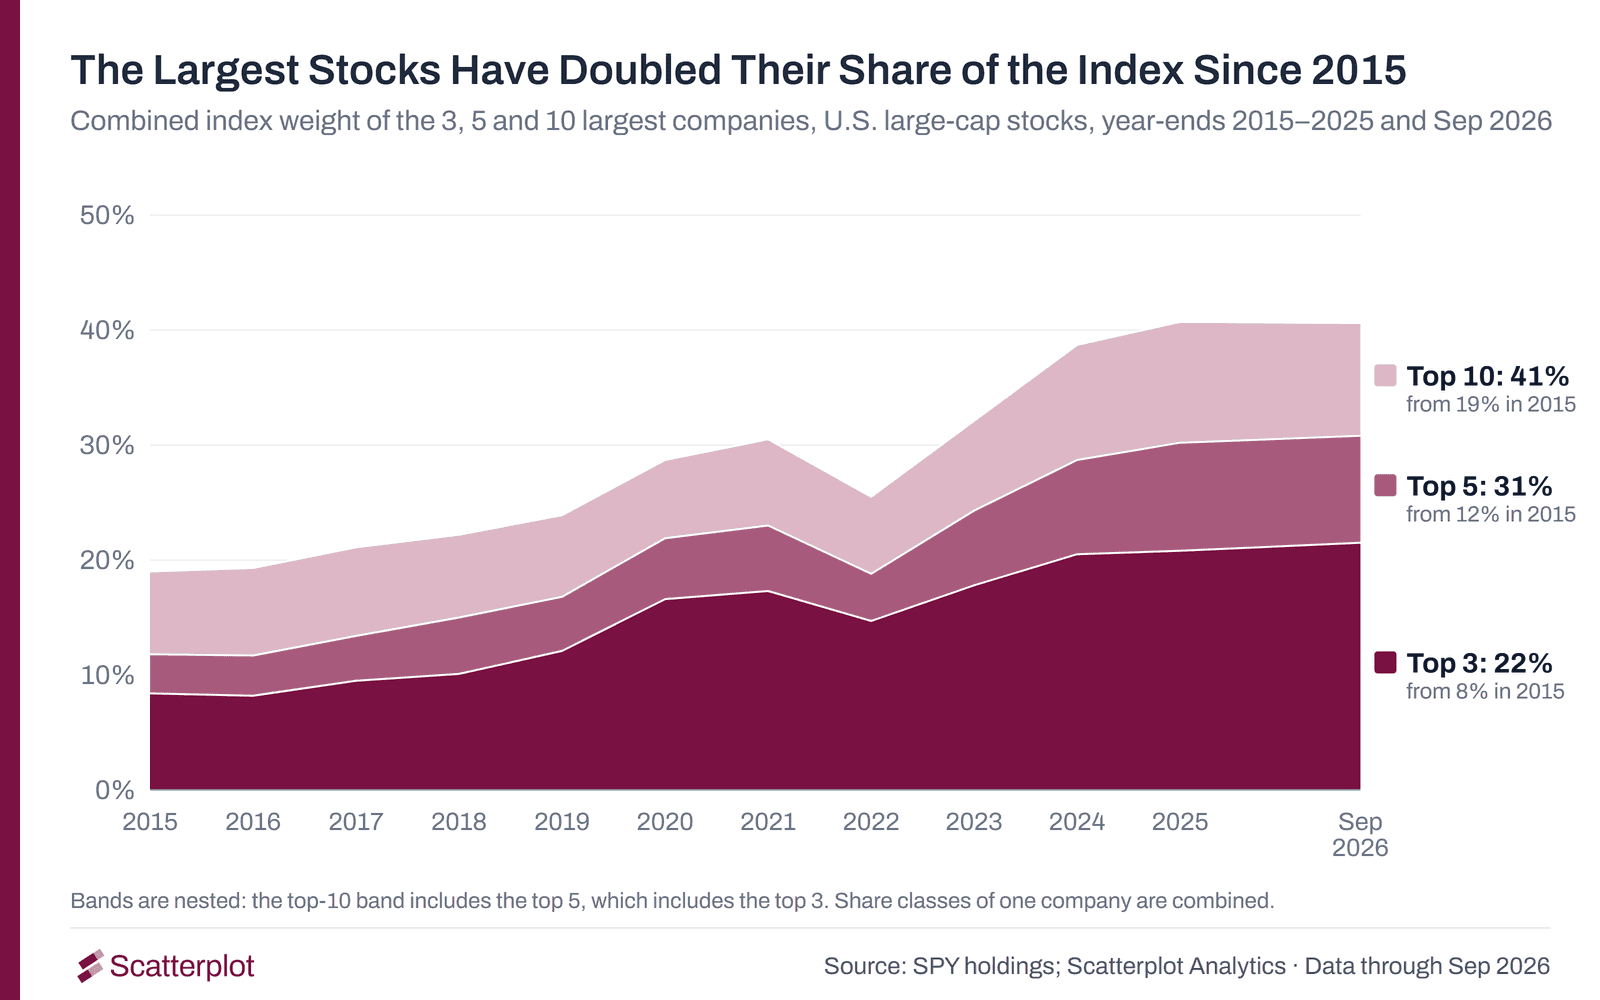
At the end of 2015, the ten largest companies in the index had a combined weight of 19%. By the end of 2025 it was 41%.
The growth was heaviest at the very top. The three largest companies went from 8% of the index to 22%, and the five largest from 12% to 31%. The names changed as well. The 2015 list included Exxon, General Electric, Johnson & Johnson and Wells Fargo. The September 2026 list is Nvidia, Apple, Microsoft, Alphabet, Amazon, Broadcom, Meta, Micron, Tesla and AMD.
2. Profits, cash flow and capital spending rose with the weight
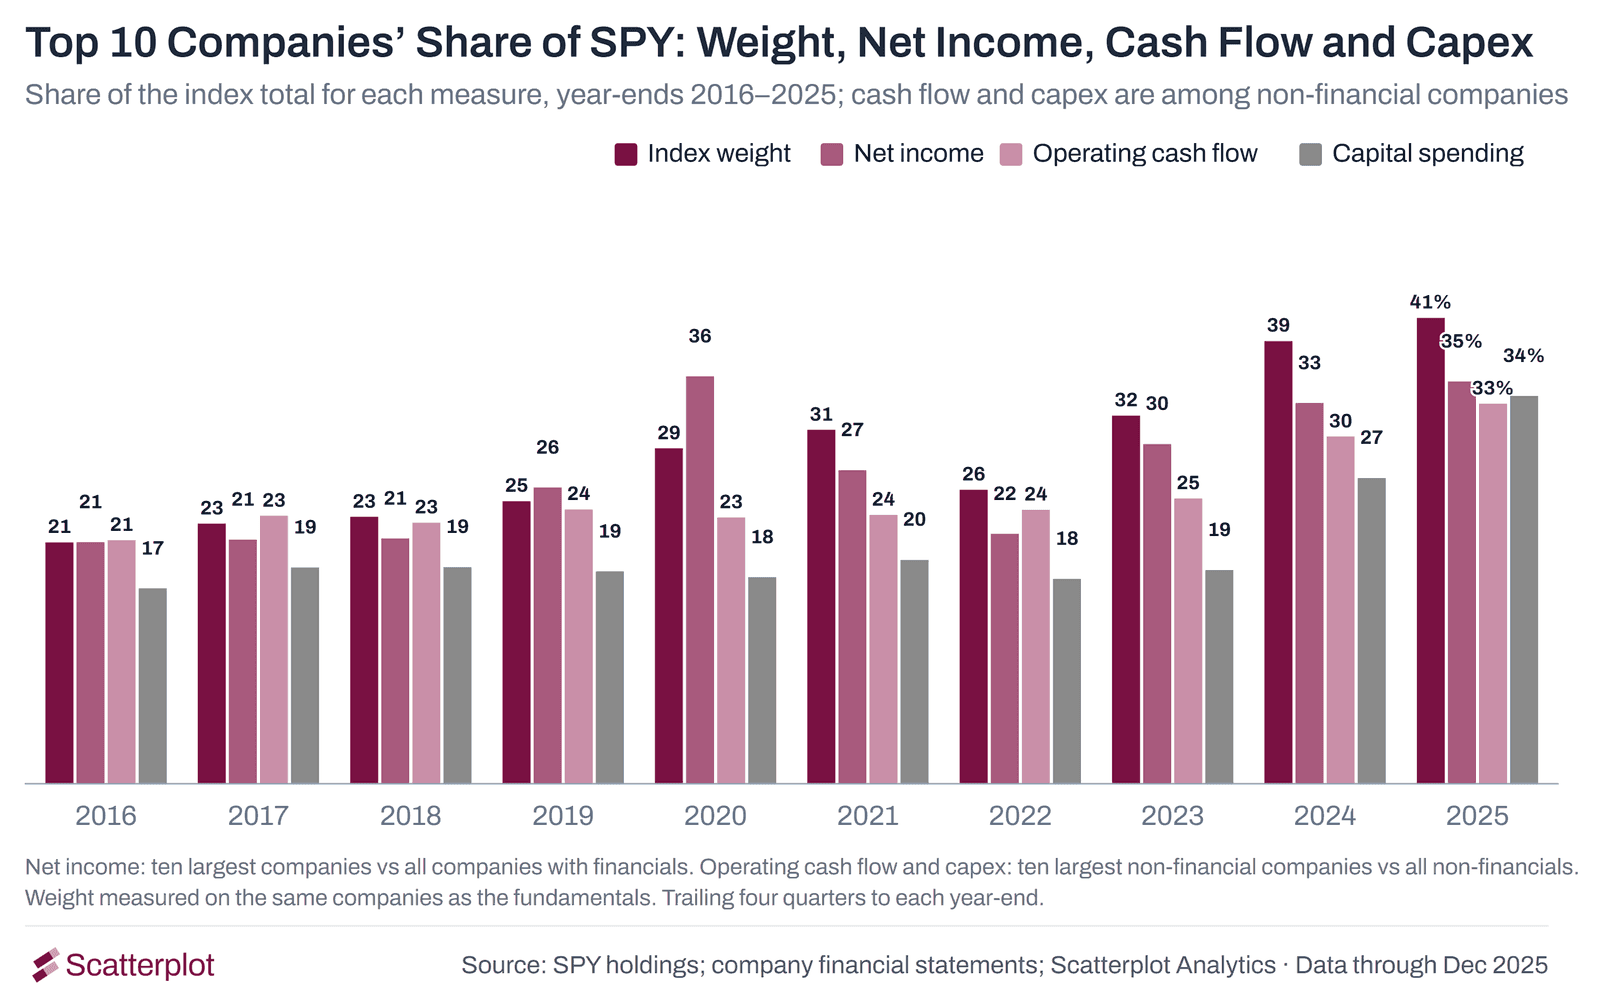
We measured four things at every year-end from 2016 to 2025. Index weight is a company's share of the fund's market value. Net income, Operating cash flow, Capital spending, or capex. Index weight and net income are the ten largest companies' share of all covered index companies.
Operating cash flow and capital spending are the ten largest non-financial companies' share of all non-financial companies, because bank cash flow and capital spending are not comparable with those of operating businesses.
Each group is re-ranked at each year-end, so the companies change over time; the 2016 list included Exxon and General Electric, and the 2025 list includes Nvidia and Broadcom.
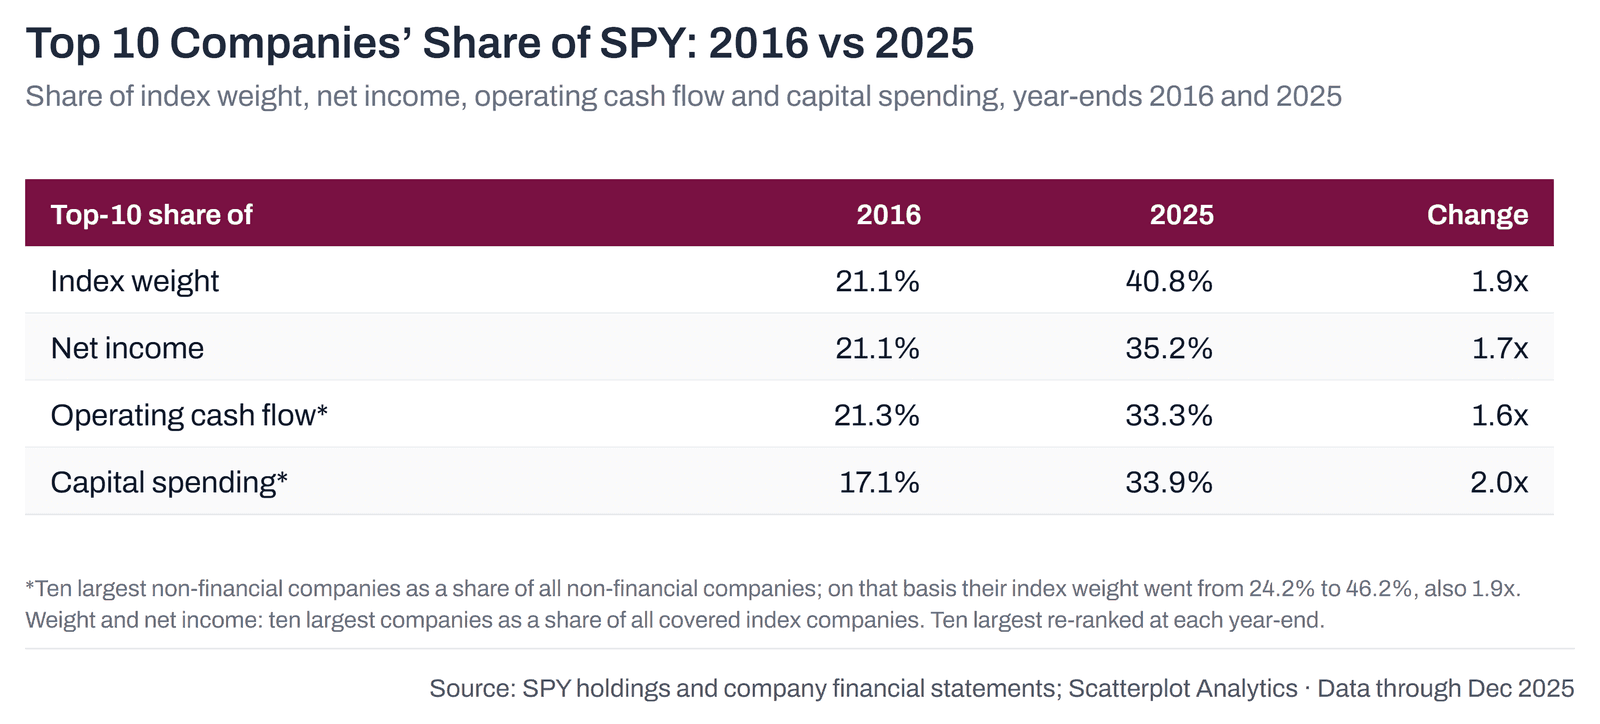
Every measure rose by between 1.6 and 2.0 times. Capital spending moved most, and most of that move came at the end: the ten largest non-financial companies' share of capex sat between 17% and 20% at every year-end from 2016 to 2023, then rose to 27% in 2024 and 34% in 2025. In 2025, ten companies accounted for a third of all the capital spending of the index's non-financial companies. Capital spending measures investment activity, not the return that investment will eventually earn.
3. The five largest names at the end of 2025
Here are the five largest companies in the index at the end of 2025, with their share of SPY's weight and net income, and their share of the operating cash flow and capital spending of SPY's non-financial companies.
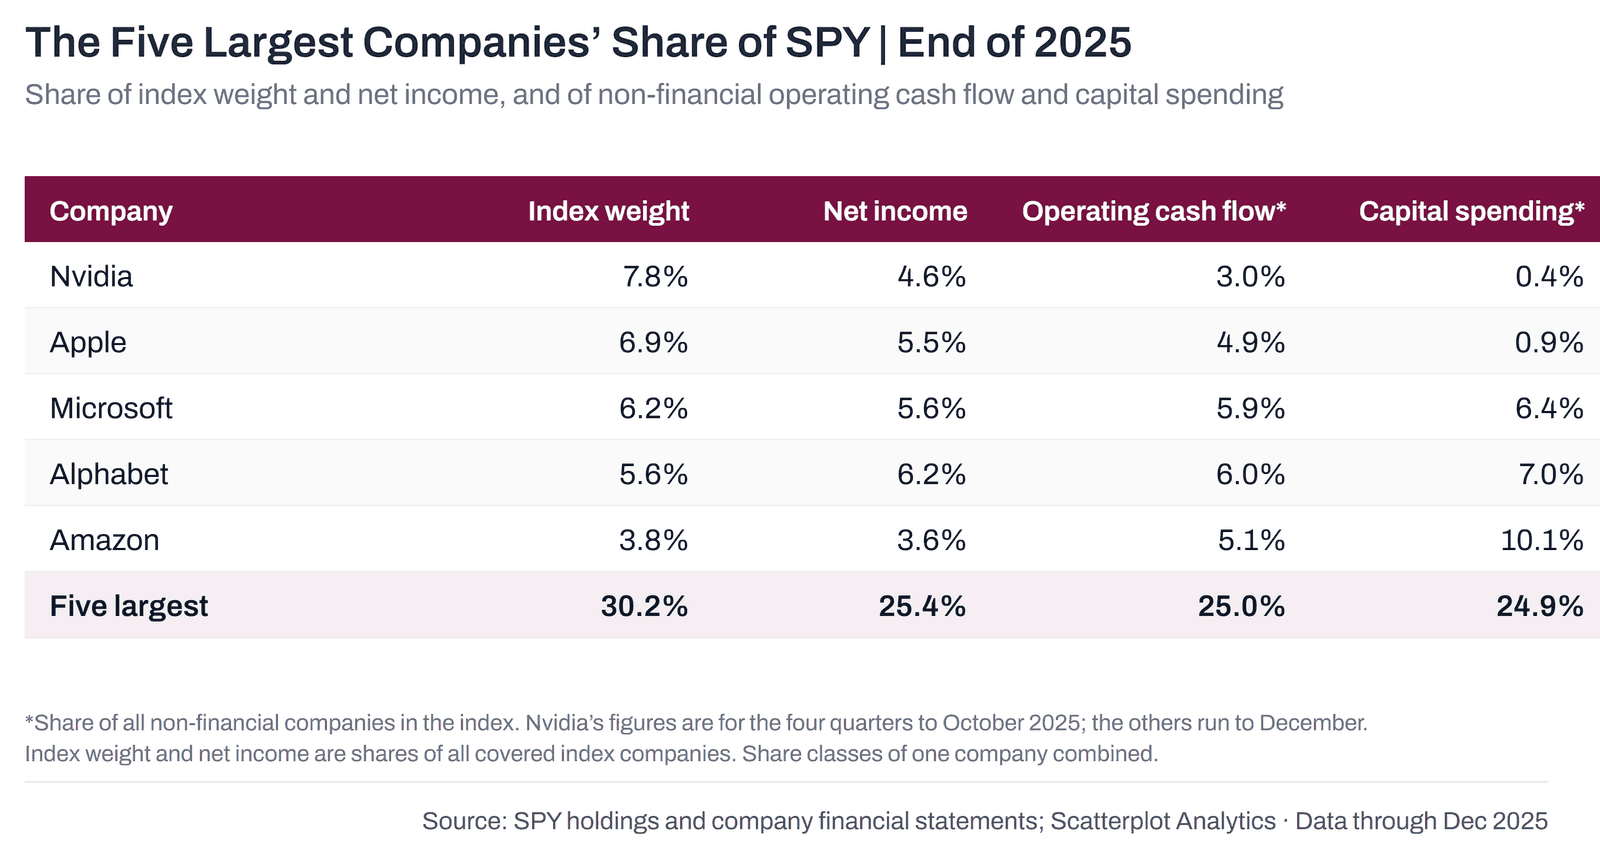
Take Apple. It is about 7% of the index by weight, and it produces about 5.5% of the index's net income and about 5% of the operating cash flow of its non-financial companies. The five have different financial profiles. Alphabet and Microsoft each produce about 6% of the index's net income and about 6% of non-financial operating cash flow, and 6% to 7% of non-financial capital spending. Amazon's capital spending share, at 10% of the non-financial total, is far larger than its net income share of 3.6%.
4. Market concentration outside the US
Measured the same way for three other country index ETFs, the ten largest companies were 21% of the Japan ETF at the end of 2015 and 31% in September 2026. In the UK ETF they went from 40% to 54%. In the Canada ETF they were 44% and 45%.
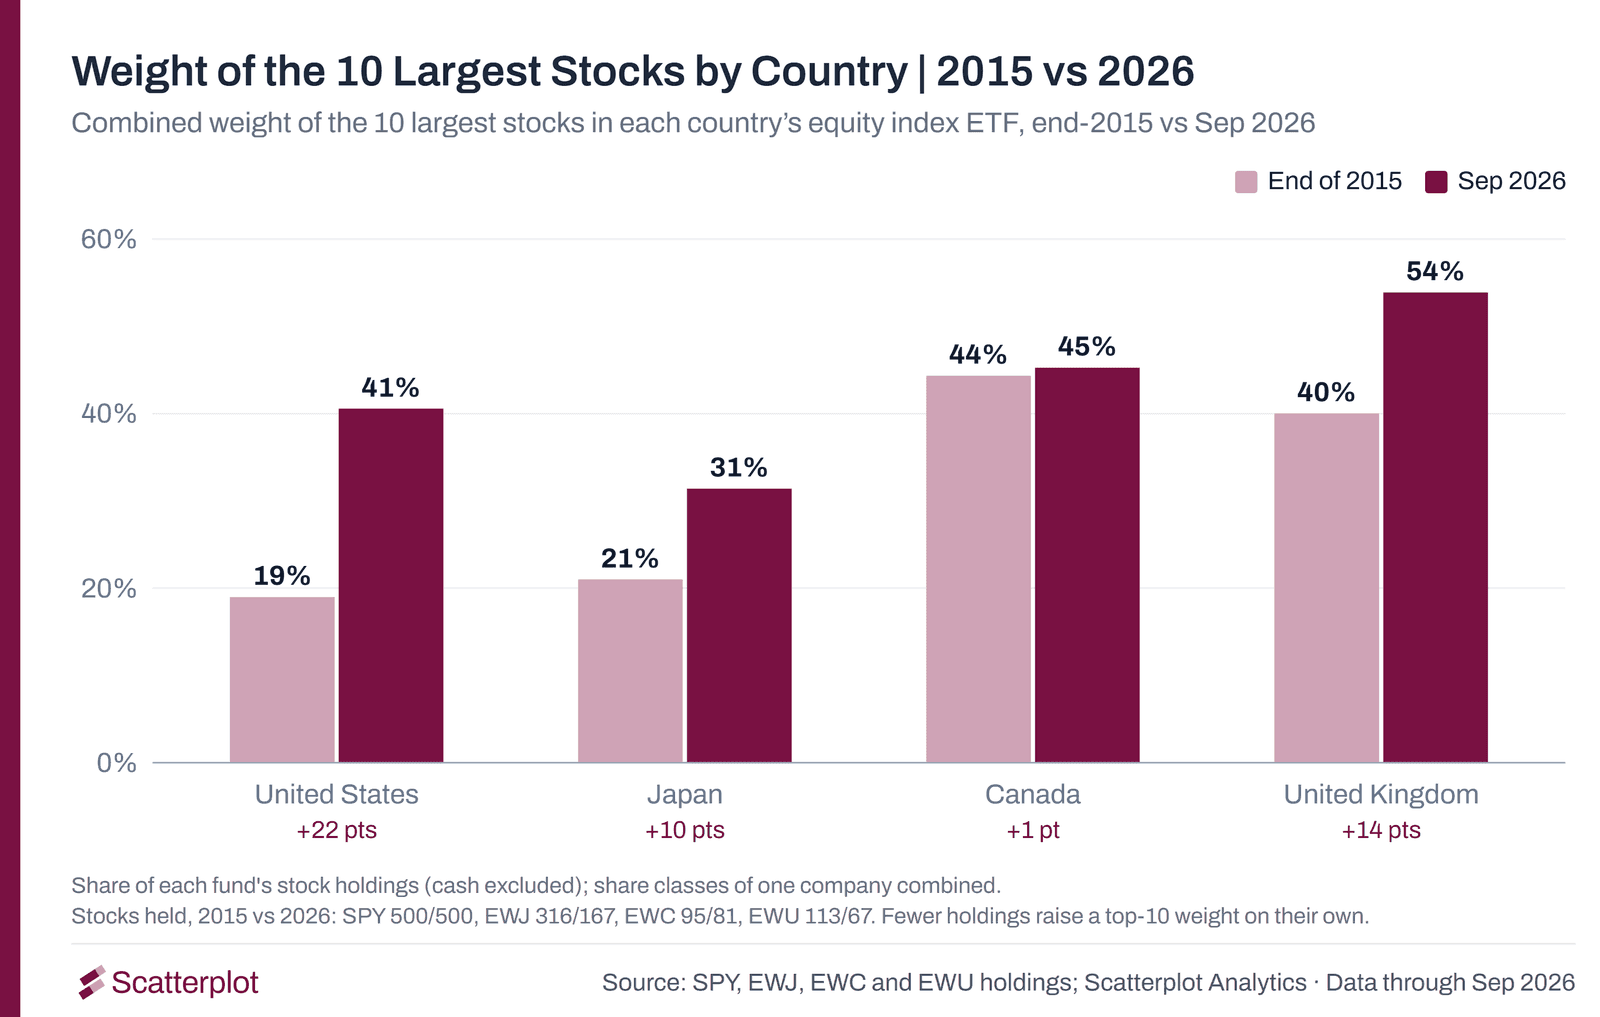
The US ETF was the least concentrated of the four in 2015 and is still not the most concentrated today. It is the one that moved the most, by 22 points against 10 for Japan and 14 for the UK.We looked at this from the global side in an earlier post, Global equity markets were always concentrated. The U.S. is just catching up.
5. What the numbers say about US market concentration
Concentration on its own is neither a warning nor a comfort. The question behind it is whether the companies with the largest index weights are also responsible for a substantial share of the index's aggregate financial results, and the data says they are. At the end of 2025 the ten largest companies were 41% of the index and 35% of its profits, and the ten largest non-financial companies accounted for a third of the operating cash flow and capital spending of the index's non-financial companies.
A 2026 paper in the Financial Analysts Journal reached a related conclusion from a different direction: the US market "has indeed become more concentrated," but "has not become riskier as it has become more concentrated."
For an advisor talking to a client, both things are true at once. The index is twice as concentrated as it was ten years ago, and the companies at the top of it generated a third of its profits in 2025.
Ultimately, in our view, the durability of earnings, cash flow and returns on investment will be central to whether the largest companies keep their position in the index. Our historical comparisons cannot establish how those future results will unfold.
Chart notes and method
Derived from the method statements in the analysis scripts.
- Index and weights. "The index" is the US large-cap index as held by the SPY ETF. Weights are the fund's holdings at each date. "Ten largest" is re-ranked at every date, so the group is not fixed. The two share classes of one company (such as Alphabet) are combined, so "ten largest" means ten companies. The area and country charts use the fund's stock holdings in full (cash excluded) at each date; the year-end table measures weight on the companies that have financial statements in our data (see below), which is why 2016 reads 19% in the area chart and 21.1% in the table. Weights run to 30 September 2026; financial statements run to December 2025.
- Fundamentals. Trailing four quarters ending on or before each December 31, from company financial statements, one filing series per company. Companies with other fiscal calendars are up to three months behind. Net income is net income available to common shareholders as reported. Capital spending is summed as a positive number.
- One dataset, two groups. Every year-end figure is drawn from the same set of companies: those with financial statements in our data, which were 92% of index weight at the end of 2016 and 100% at the end of 2025 (companies that left the index before 2022 have no financials, which overstates the early-year fundamentals shares slightly). Within that set, index weight and net income use the ten largest companies against all companies, and operating cash flow and capital spending use the ten largest non-financial companies against all non-financial companies. The same two denominators apply in the five-largest table.
- Financial companies. Net income includes banks and insurers. Operating cash flow and capital spending use the ten largest non-financial companies against all non-financial companies, both ranked and summed without the financial sector. Payment companies that were reclassified from technology to financials in March 2023 are treated as non-financial at year-ends up to 2022.
- Country chart. Each market is represented by its country index ETF (EWJ for Japan, EWC for Canada, EWU for the UK) and the US by SPY, at the end of 2015 and on 30 September 2026, measured on each fund's stock holdings with cash excluded. The four markets are the ones in the portal's own chart. The country funds hold fewer companies than in 2015 (Japan 316 to 167, UK 113 to 67, Canada 95 to 81; the US 500 at both dates), which on its own raises a top-10 weight, so the comparisons are indicative.
Sources
- Xavier Gabaix and Ralph S. J. Koijen, In Search of the Origins of Financial Fluctuations: The Inelastic Markets Hypothesis, NBER Working Paper 28967 (June 2021).
- Hao Jiang, Dimitri Vayanos and Lu Zheng, Passive Investing and the Rise of Mega-Firms, Review of Financial Studies (2025).
- Mark Kritzman and David Turkington, The Fallacy of Concentration, Financial Analysts Journal, vol. 82, no. 2 (2026).
Index weights, company financial statements and all calculations: Scatterplot Analytics. Data through September 2026 (weights) and December 2025 (financial statements).
Important disclosures
This article is provided for informational and educational purposes only and should not be viewed as personalized investment advice. References to specific companies, securities and funds are provided solely to illustrate general market concepts, in this case the composition of an index, and are not intended as a recommendation or solicitation to purchase, sell, or hold any security or investment.
All investments involve risk, including the loss of principal. Investment returns and principal value will fluctuate and are subject to market volatility. Past performance is no guarantee of future results, and there is no assurance that historical trends or relationships will continue. The figures above describe what happened over the stated periods and are not a forecast.
References to indices and index funds (SPY, EWJ, EWC and EWU) are for illustration. Indices are unmanaged and cannot be invested in directly. ETF performance and composition may differ from the underlying index due to fees, expenses and holdings. Market conditions, including periods of market concentration, may increase volatility and risk.
All opinions are subject to change without notice as market conditions change. Company financial figures are taken from reported financial statements and third-party data providers, and the shares and ratios shown are Scatterplot Analytics calculations. Data contained herein from third-party sources is believed to be reliable; however, its accuracy, completeness, and reliability cannot be guaranteed.
Methodology, definitions, assumptions and data sources for each chart and table are provided in the Chart notes and method section above. Please talk with a qualified financial professional about your own situation before making investment decisions.


Enjoyed this? Get more in your inbox.
Weekly insights for advisors
— charts, research, and practical tools. No fluff.
Market Insights
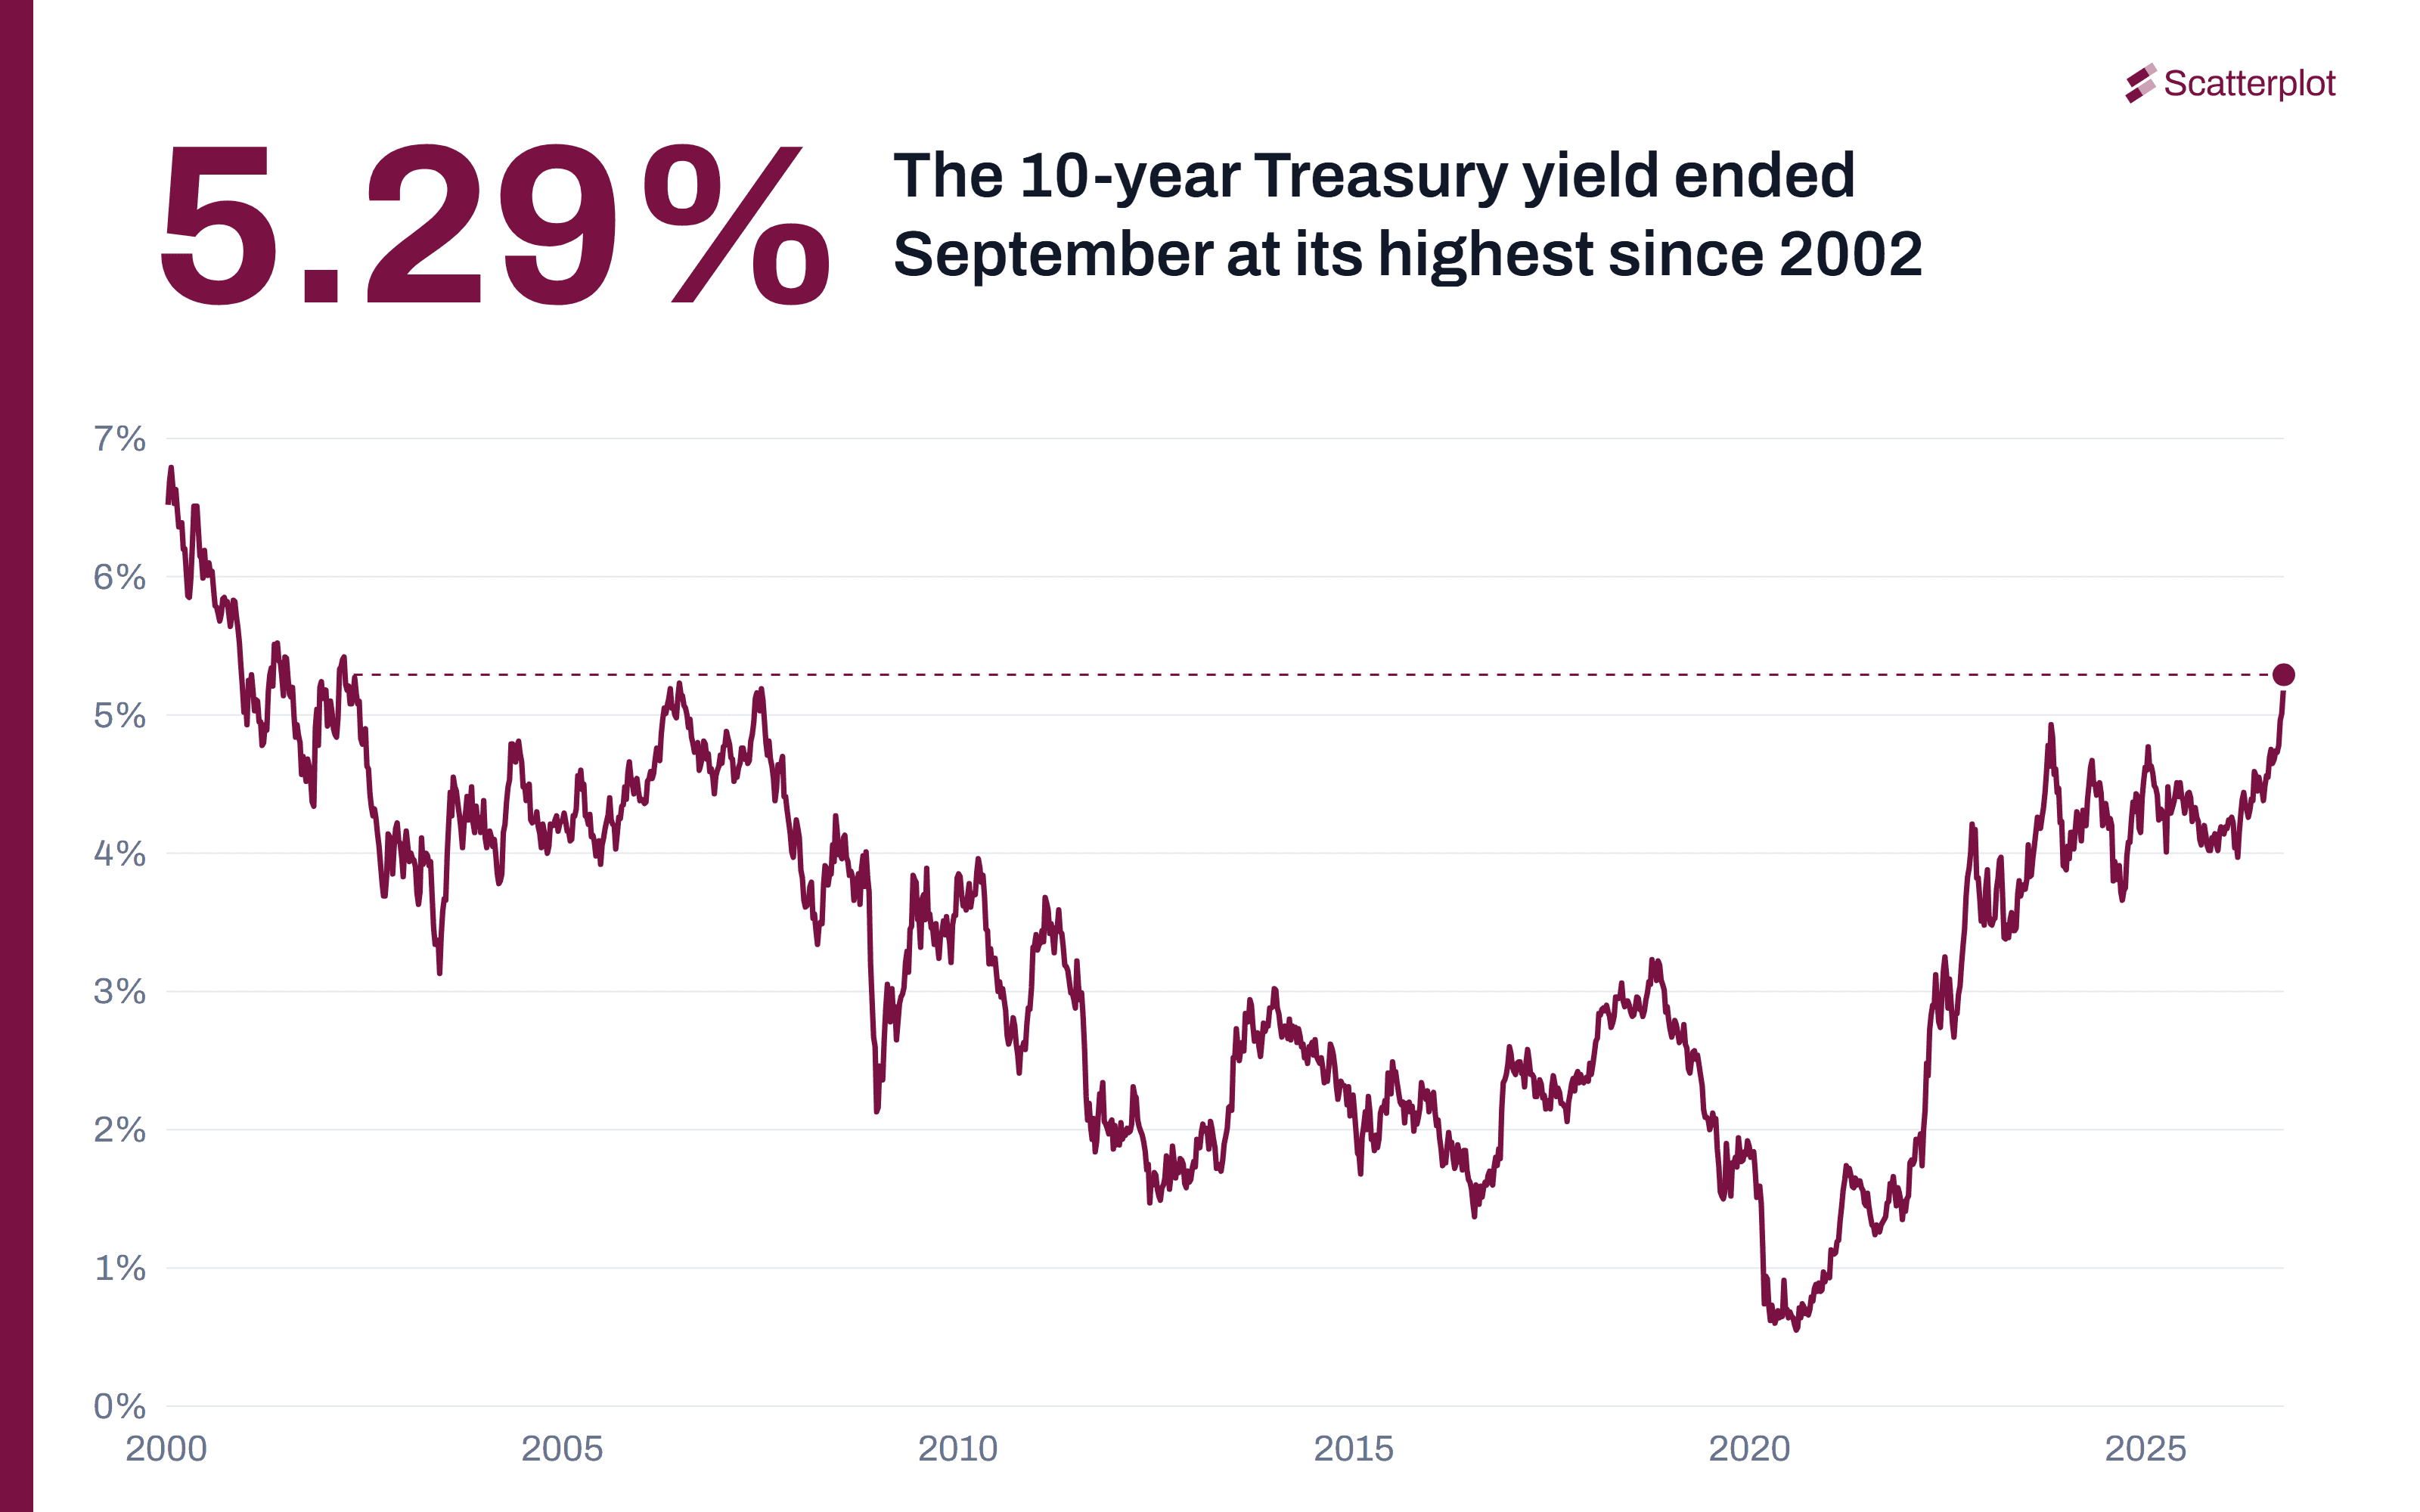
September 2026 Market Recap: The Fed Raises Rates and the 10-Year Treasury Yield Hits Its Highest Since 2002
A recap of the main market events of September 2026, in 13 charts.
Read moreSanjeev Pati, CFA
October 2, 2026 · 8 min read
Market Insights
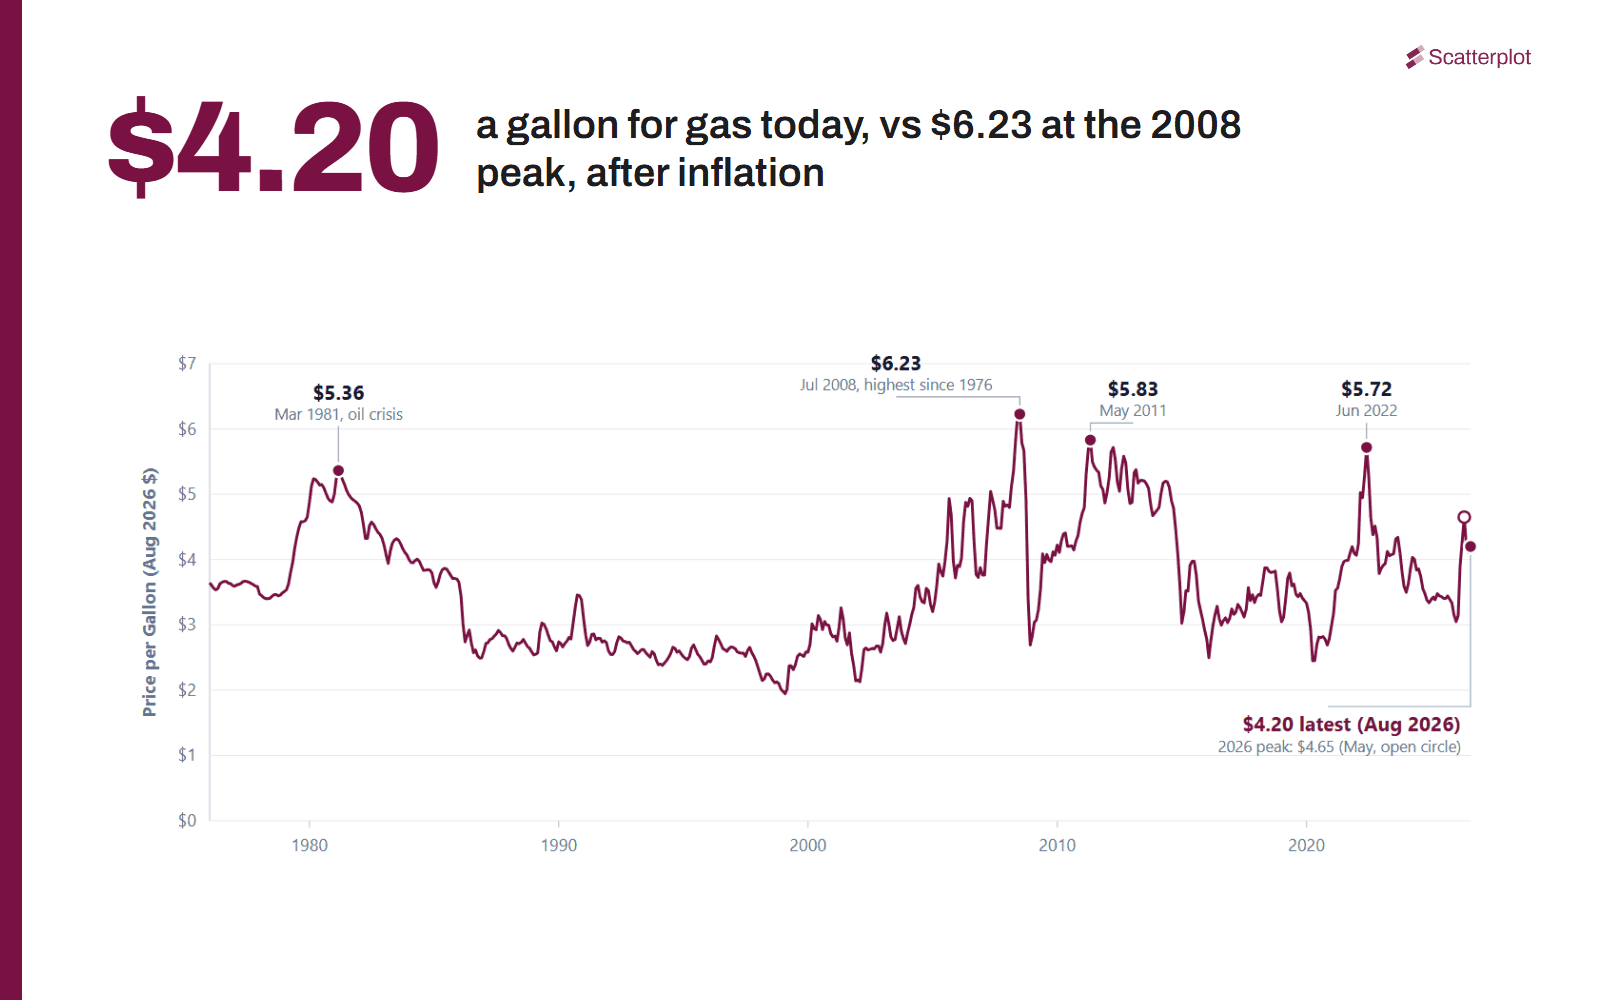
Why $100 Oil Hurts the U.S. Economy Less Than It Used To
Brent crude has traded above $100 a barrel repeatedly this year. That still stings. But the U.S. economy is less exposed to high oil prices than it was in the past, for three reasons.
Read moreSanjeev Pati, CFA
September 28, 2026 · 5 min read