

US Housing Market in October 2026: Introducing the U.S. Housing Daily
In October 2026, the 30-year mortgage rate is 7.40% and the monthly payment on a median-priced home is the highest in ten years. Existing-home sales are near three-decade lows, months of supply is the highest in ten years, and builders are cutting prices.


Sanjeev Pati, CFA
Founder, Scatterplot
Introducing the U.S. Housing Daily
The U.S. Housing Daily is a one-page view of the US housing market available in our portal. It tracks 14 housing indicators and updates every business day.
Each row shows the latest number, the change since the last release, and how that number ranks against the past ten years: 100th is the highest, 0th the lowest.
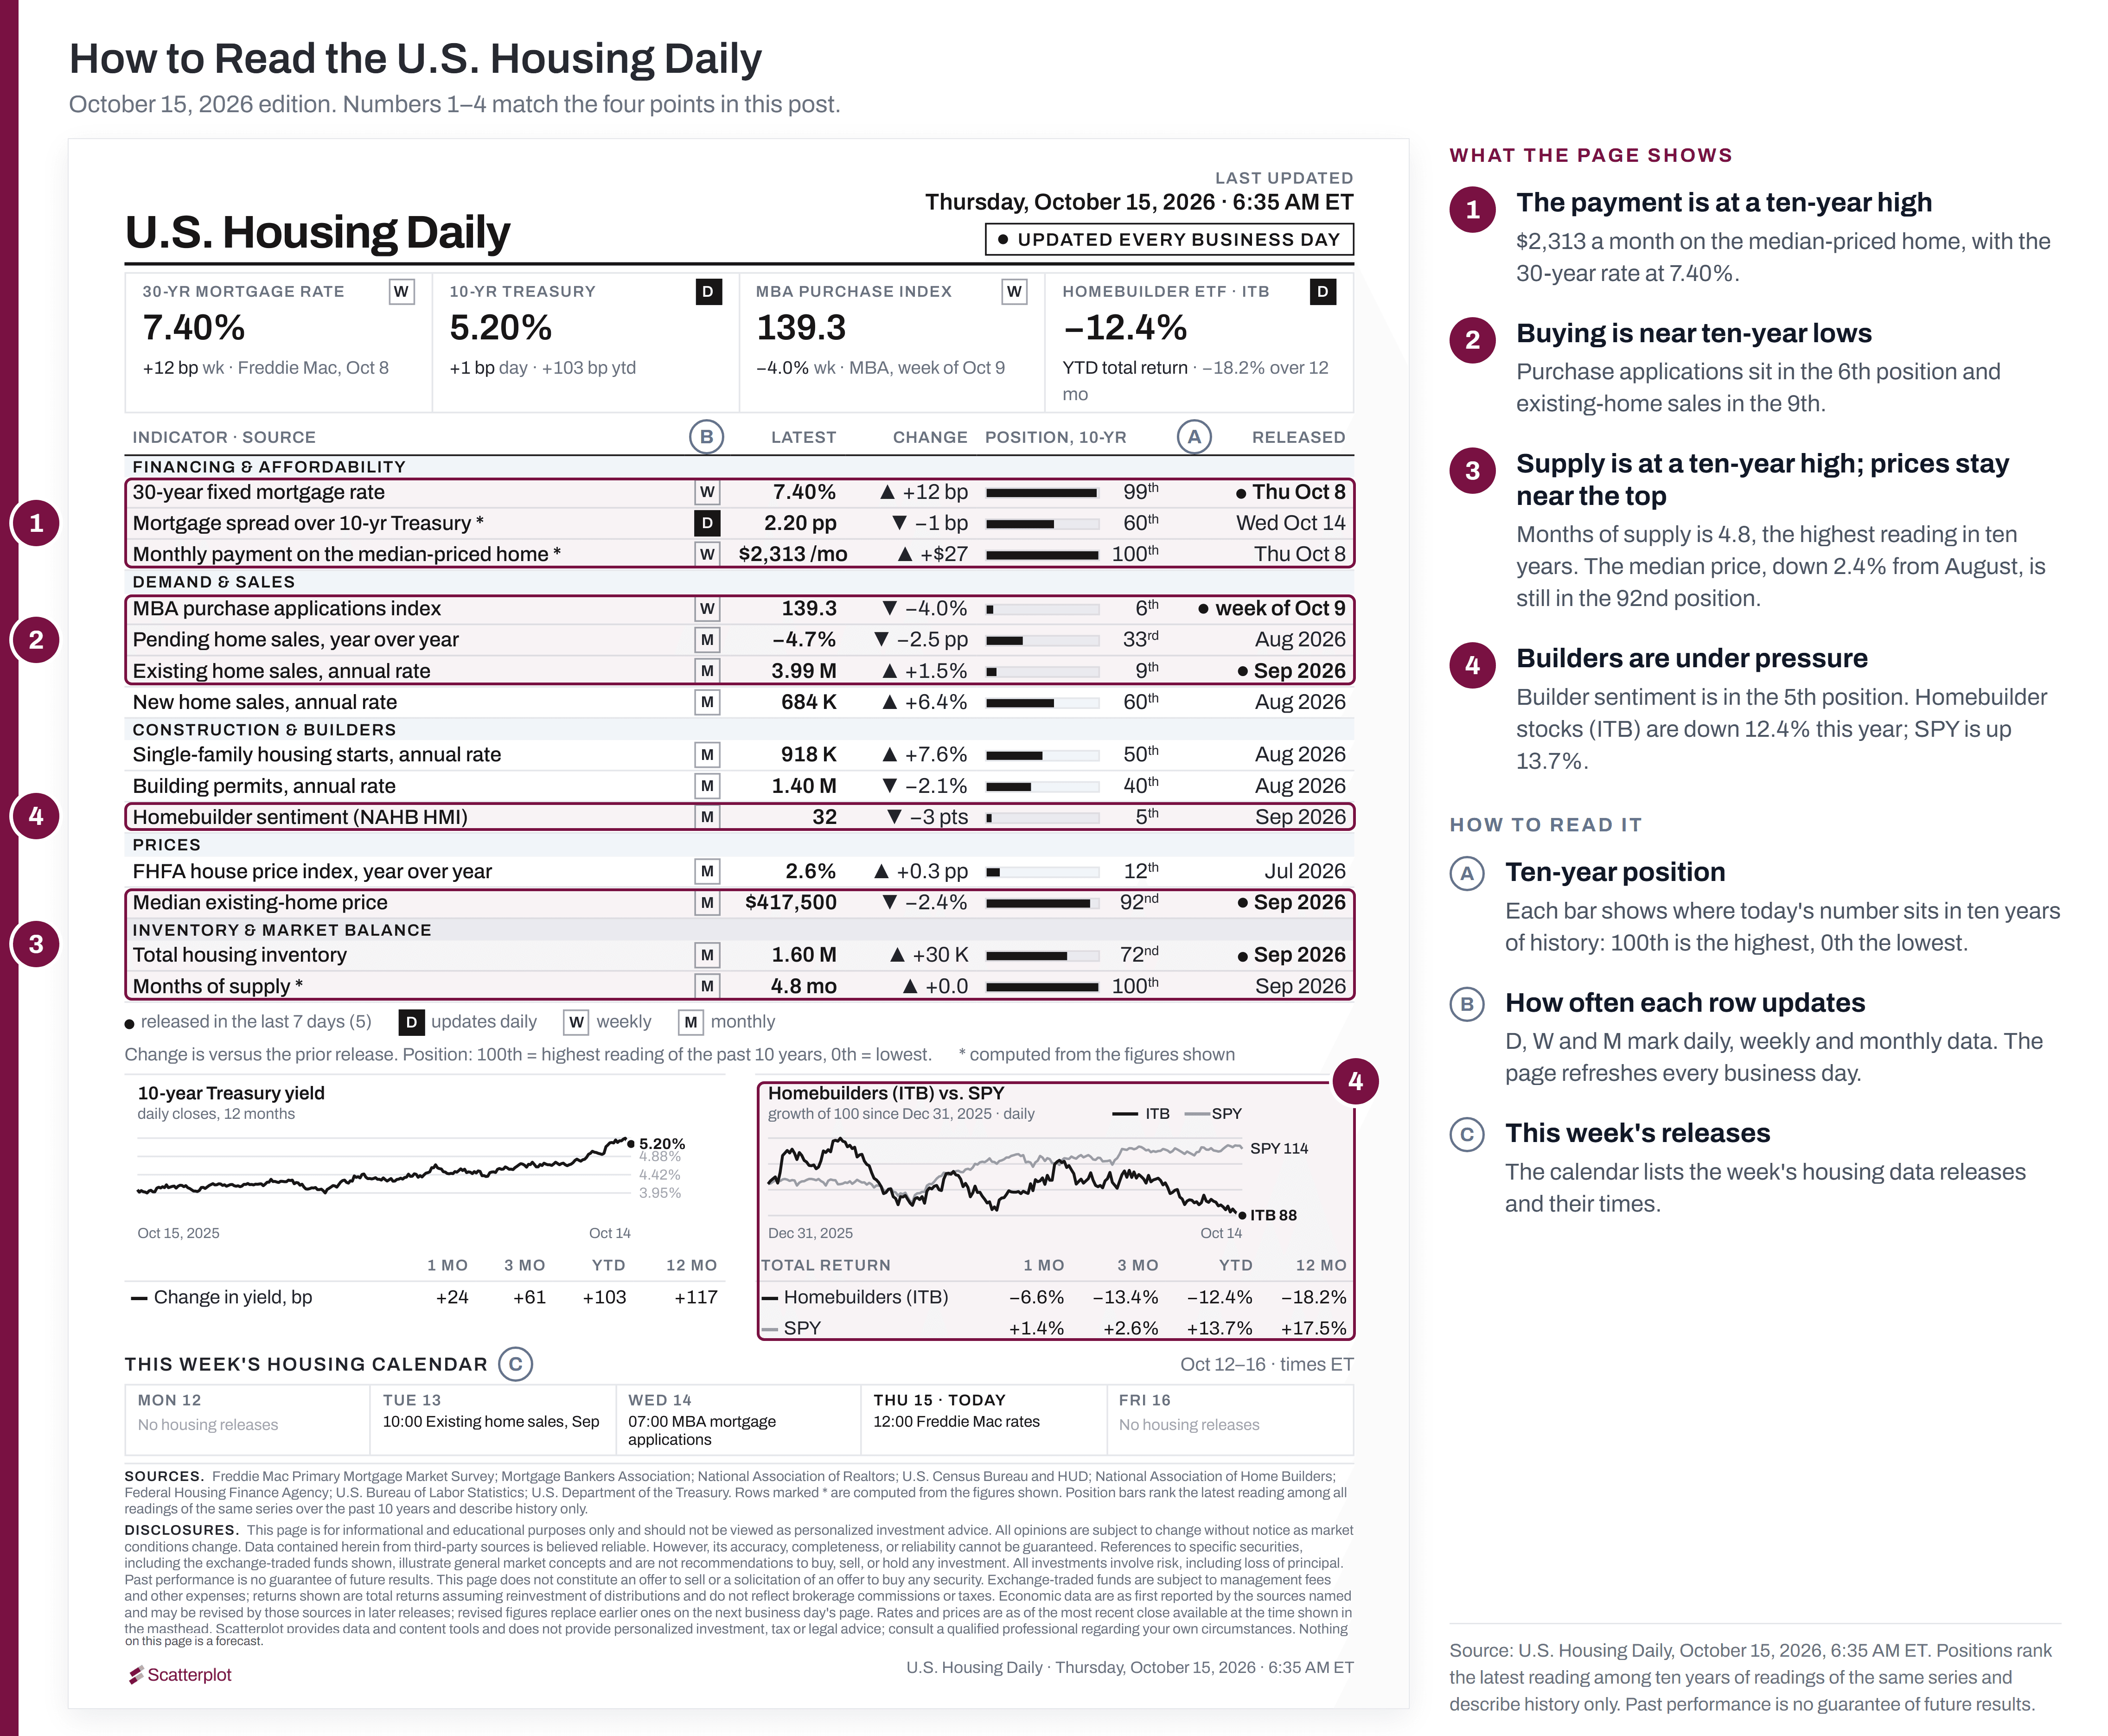
The numbered markers match the four points below.
The charts in this post use the same data as the page.
Every indicator on the page also has its own ten-year line chart in the Scatterplot portal.
01 · Mortgage Rates Today: The Monthly Payment Is the Real Affordability Problem
Rates near a three-year high, home prices near their ten-year high, and a mortgage payment at the top of its ten-year range.
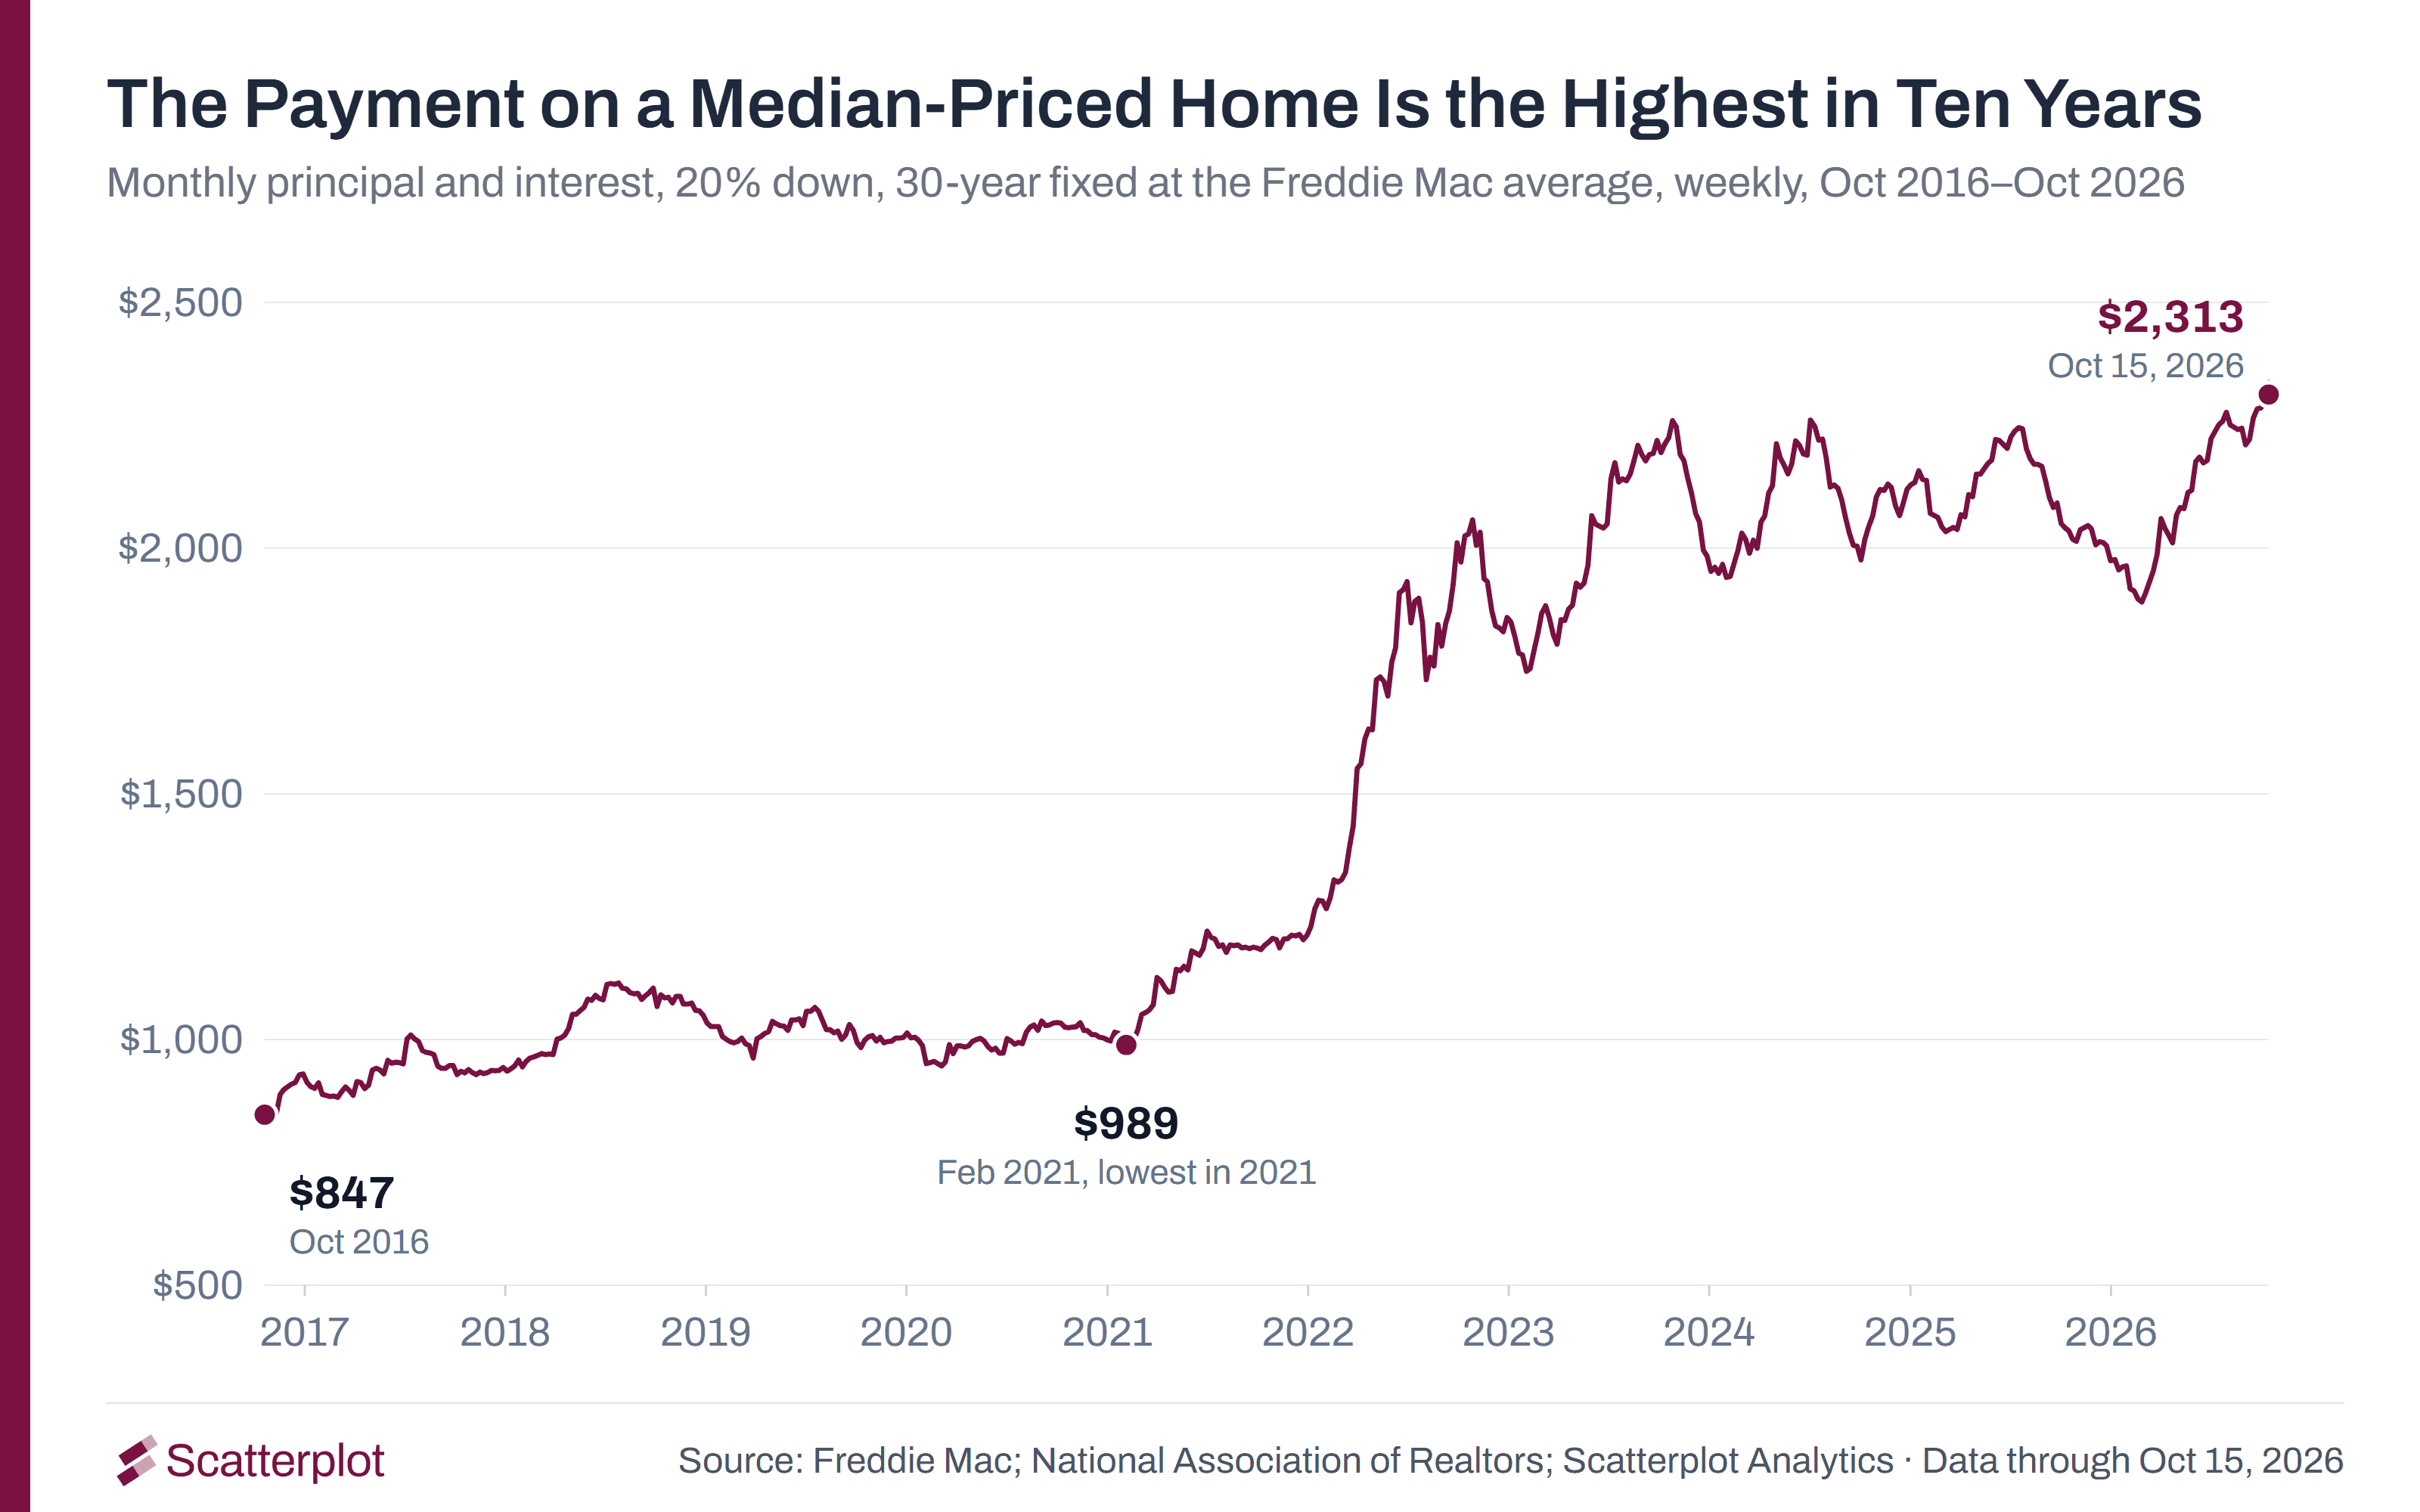
The 30-year mortgage rate is 7.40%, the highest since November 2023. The median home price is $417,500, near the top of its ten-year range. The monthly principal and interest payment on that home is $2,313, the highest in ten years.
A year ago, the 30-year rate was 6.27%. At that rate, the same loan would cost about $250 a month less. The median price rose 1.3% over the year.
The 10-year Treasury yield rose from 4.18% at the end of 2025 to 5.21% in October. Mortgage rates rose with it, and the gap between the two changed little. Our September 2026 Market Recap covers the rise in Treasury yields. An affordability measure from the Federal Reserve Bank of Atlanta fell in July to its lowest in 21 years.
02 · Resale Market: Why Existing-Home Sales Remain Near Their Lows
Purchase applications, transactions, and the mortgage lock-in effect explain why activity is so subdued.
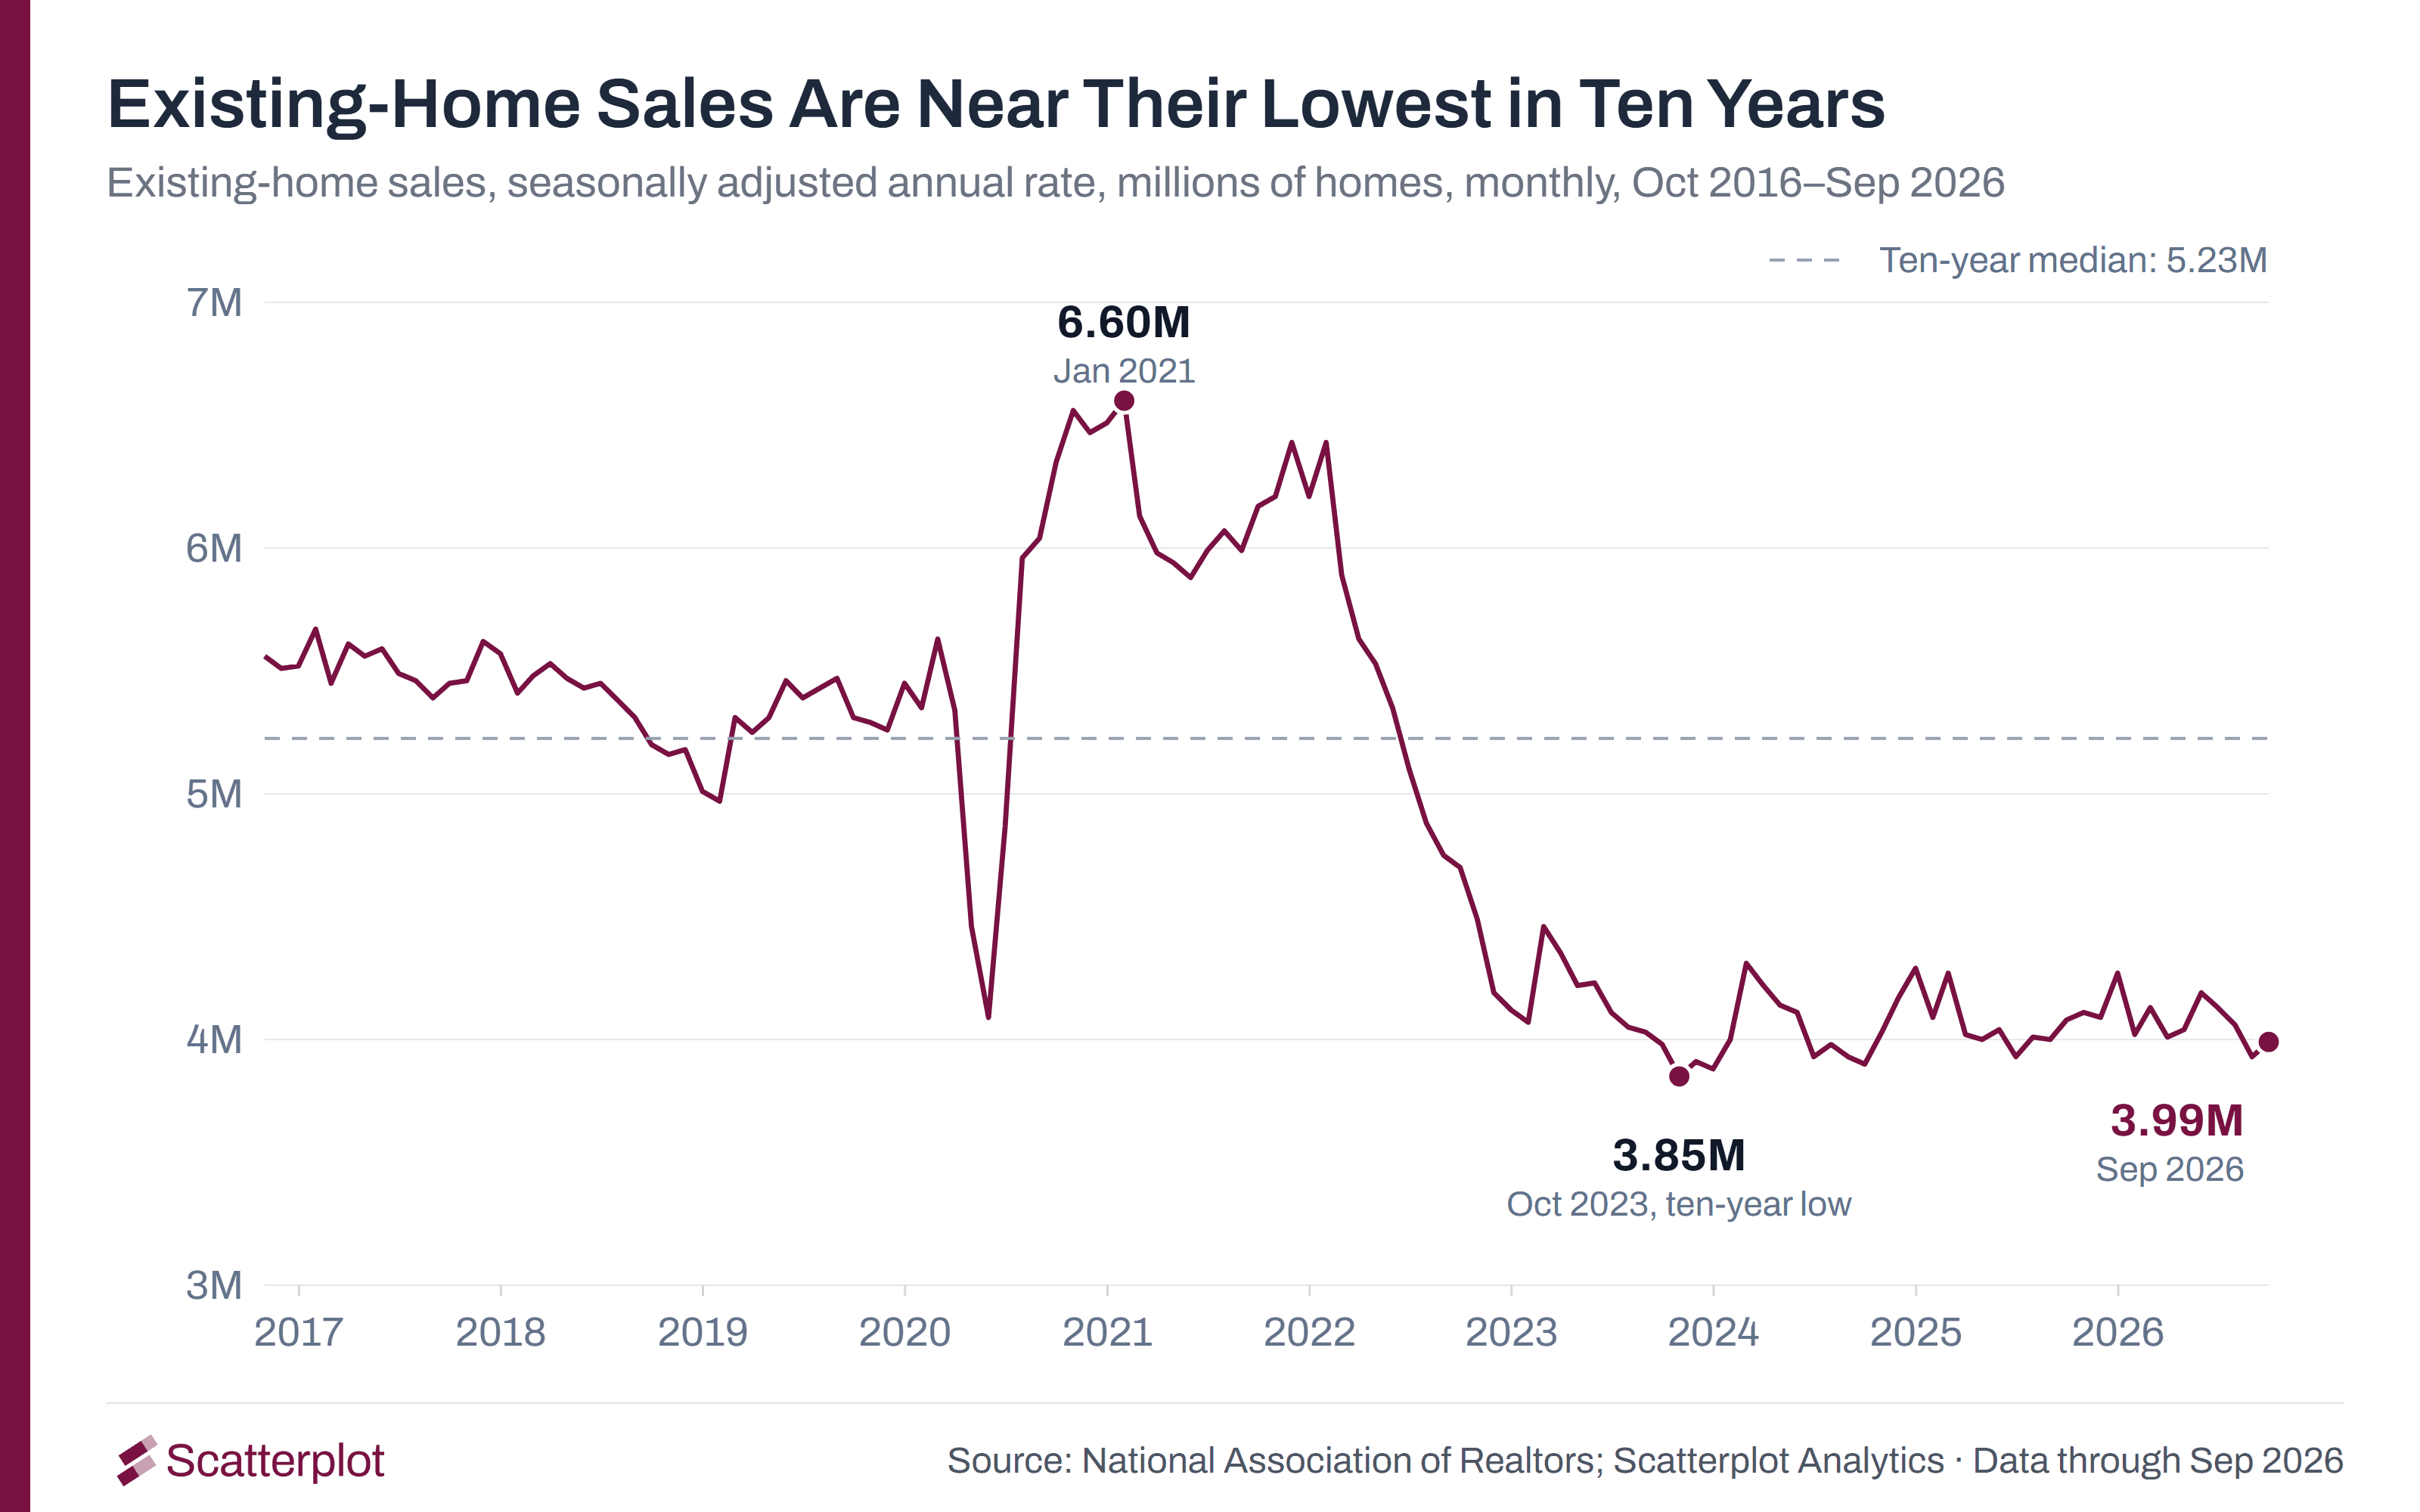
Existing-home sales ran at a 3.99 million yearly pace in September, near the bottom of their ten-year range and 2.2% lower than a year ago. Mortgage applications to buy a home were 16% lower than a year earlier. Harvard's housing center says existing-home sales are "stuck at a three-decade low".
About half of all mortgages are at 4% or less, and nearly 80% are below 6%. Harvard's housing center notes that owners with these low rates move less often. Redfin counted fewer buyers in September than at any time since its records began in 2013. Our September post, US Housing Market: Resale Is Frozen, New Construction Is Not, covers the resale market in more detail.
03 · Are Home Prices Dropping? More Homes for Sale, But Little Relief on Prices
Inventory and months of supply are rising, yet national home prices remain higher than a year ago.
The median sale price is 1.3% higher than a year ago, and the FHFA home price index is up 2.6%. Consumer prices rose 3.4% in the year to July, so home prices fell after inflation.
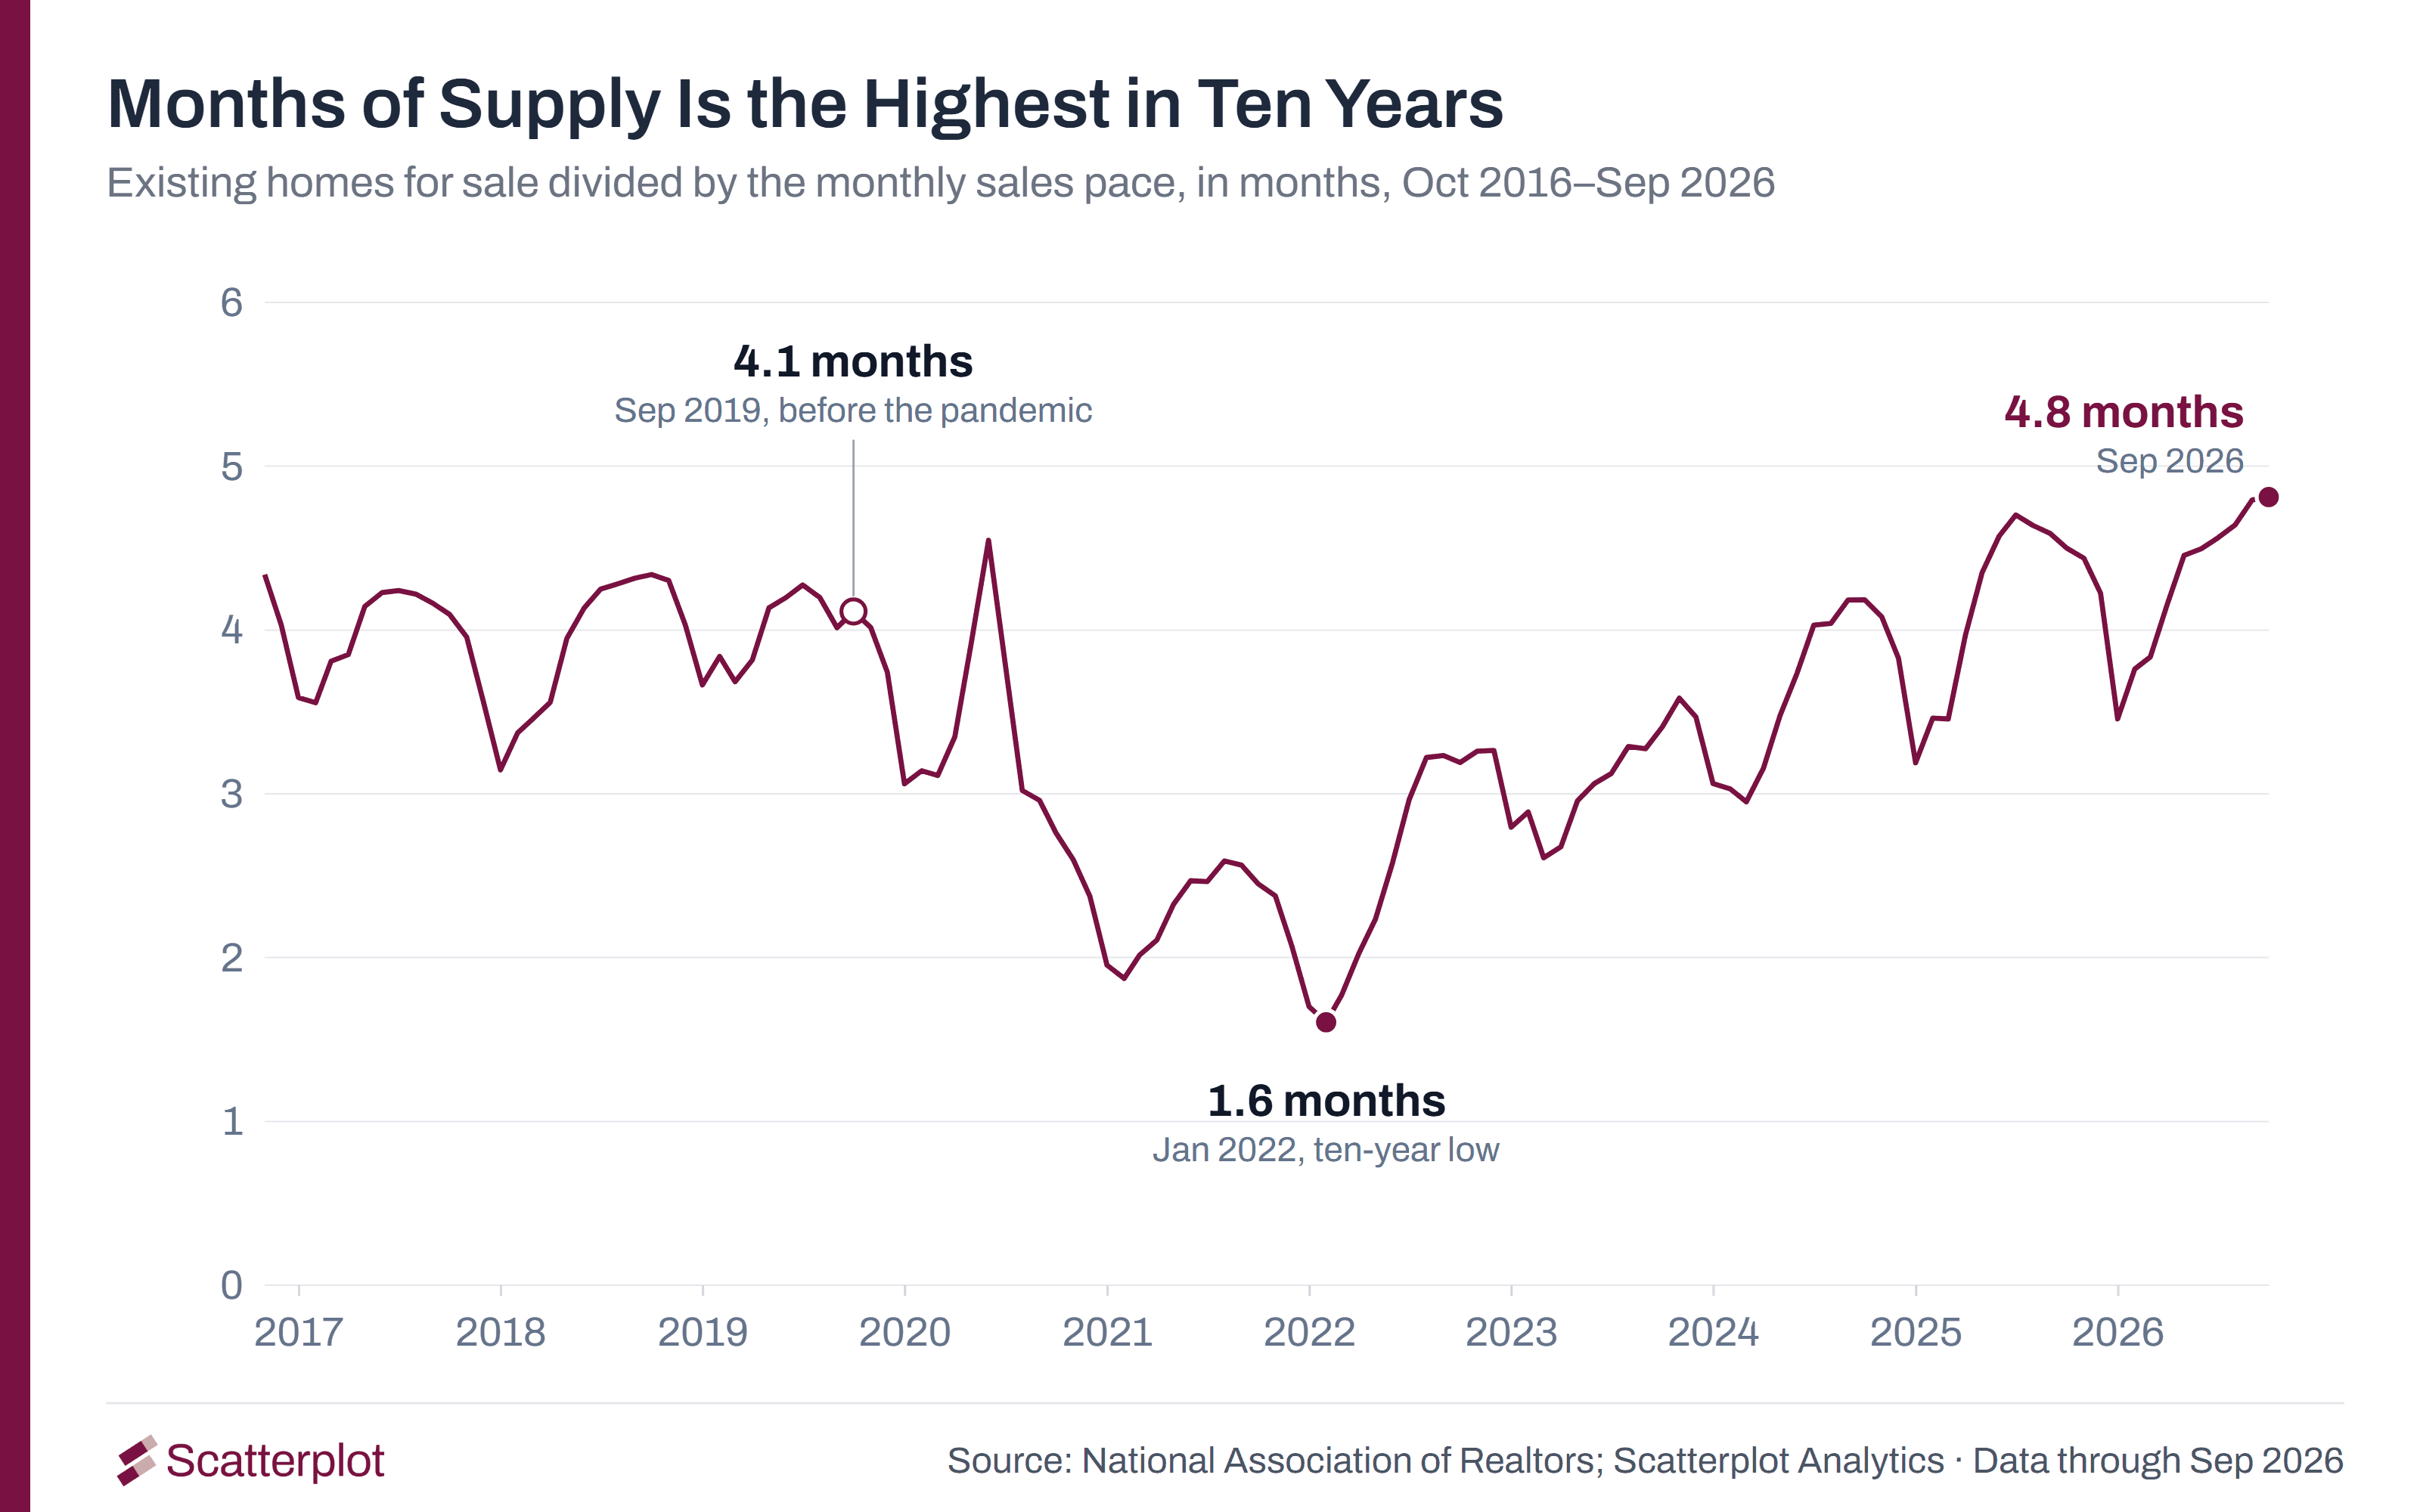
There were 1.60 million homes for sale in September, 4.6% more than a year earlier. At today's sales pace, it would take 4.8 months to sell them all, the longest in ten years.
Listings are still 5.2% below September 2019, while signed contracts are about 30% below the years before the pandemic. Compared with before the pandemic, the higher months of supply comes from slower sales, not more listings.
About one in five listings had a price cut in September, the most for a September since 2018.
04 · New Construction: Homebuilders Are Keeping Sales Moving, At a Cost
Sales incentives and mortgage buydowns explain the relative resilience of new-home activity, even as confidence and homebuilder stocks struggle.
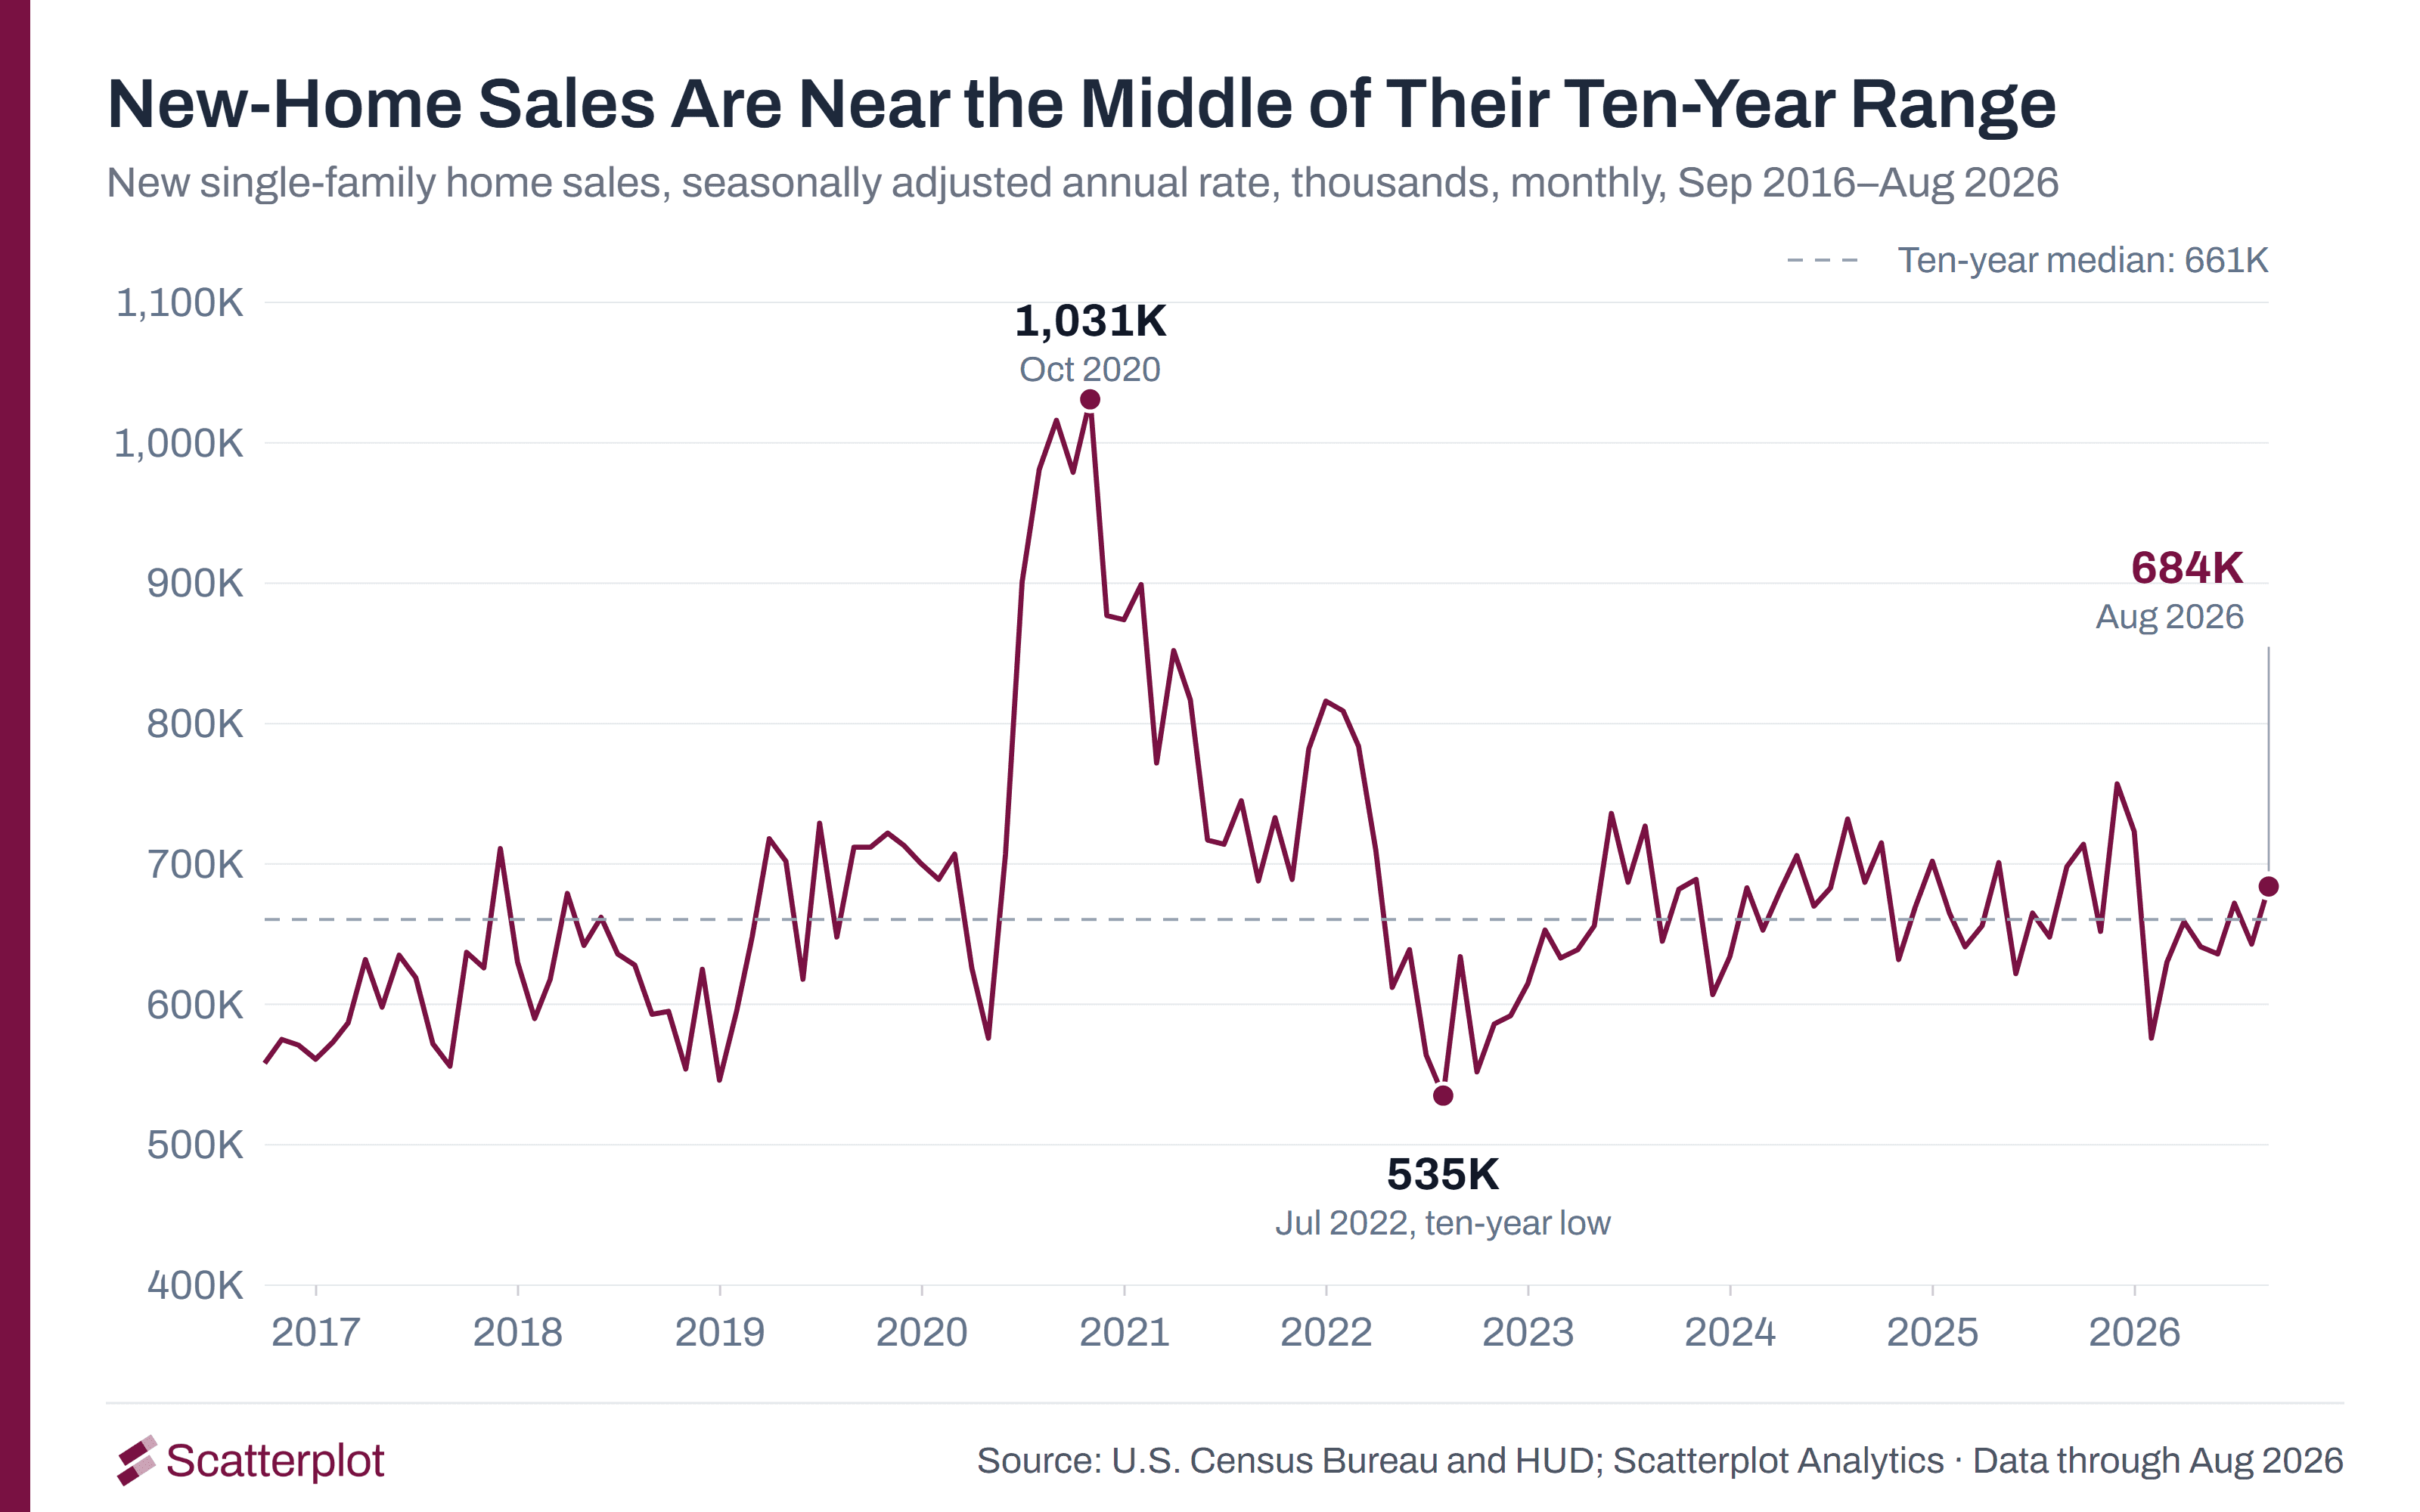
New single-family home sales ran at a 684,000 yearly pace in August, near the middle of their ten-year range.
In September, 38% of builders cut prices and 66% offered incentives, such as lower mortgage rates. Lennar said its incentives averaged about 12% of the price, and its margin on home sales fell to 15.8% from 17.5%. The median new home now sells for less than the median existing home.
Builder confidence is among its lowest readings in ten years. Homebuilder stocks (ITB) are down 12.4% this year through October 14, while US stocks (SPY) are up 13.7%.
Next on the page
Housing starts come out October 20 and new-home sales October 27. Each appears on the page the next business day.
Chart notes
- Ranking: the latest reading compared with all readings of the same series over the past ten years. It describes history only.
- Ten-year charts: each covers the last ten years of readings up to the latest one. The dashed line is the median of those readings. Charts are built from the same series and formulas as the U.S. Housing Daily.
- Monthly payment: principal and interest on the median existing-home price, 20% down, 30-year fixed at the Freddie Mac average. Computed for each weekly rate using the latest monthly median price available on that date. Excludes taxes and insurance.
- Months of supply: existing homes for sale divided by one month of existing-home sales (the annual sales rate divided by 12), same month.
- Stock returns: total returns with distributions reinvested, through October 14, 2026. ITB and SPY are examples, not recommendations.
- Inflation: Consumer Price Index (all urban consumers, not seasonally adjusted), July 2026 versus July 2025, matched to the July FHFA reading.
Disclosures
This post is for informational and educational purposes only and should not be viewed as personalized investment advice. Data from third-party sources is believed reliable, but its accuracy and completeness cannot be guaranteed. Economic data are as first reported and may be revised. References to specific securities and companies illustrate general market concepts and are not recommendations to buy, sell or hold any investment. Past performance is no guarantee of future results. All investments involve risk, including the loss of principal. Nothing in this post is a forecast. Consult a qualified professional about your own circumstances.
Sources
- Scatterplot, U.S. Housing Daily (October 15, 2026 edition). Underlying data: Freddie Mac, Mortgage Bankers Association, National Association of Realtors, U.S. Census Bureau and HUD, National Association of Home Builders, Federal Housing Finance Agency, U.S. Department of the Treasury.
- Freddie Mac, Primary Mortgage Market Survey (October 15, 2026, and weekly history).
- National Association of Realtors, Existing-Home Sales Increased 1.5% in September (October 13, 2026).
- U.S. Department of the Treasury, Daily Treasury Par Yield Curve Rates, 10-year, via FRED series DGS10 (December 31, 2025, and October 13, 2026).
- Board of Governors of the Federal Reserve System, Monetary Policy Report, Part 1 (July 2026).
- Michael S. Barr, Federal Reserve Board, A Long-Term View on the Costs of Shelter (September 23, 2026).
- Mortgage Bankers Association, Mortgage Applications Decrease in Latest MBA Weekly Survey (October 14, 2026).
- Joint Center for Housing Studies of Harvard University, State of the Nation's Housing 2026, press release (June 2026).
- Redfin, Buyers vs. Sellers, September 2026 (October 14, 2026).
- Realtor.com, September 2026 Monthly Housing Trends Report (September 30, 2026).
- National Association of Realtors, Pending Home Sales Report, August 2026 (September 17, 2026).
- Federal Housing Finance Agency, FHFA House Price Index Up 0.3 Percent in July; Up 2.6 Percent from Last Year (September 29, 2026).
- U.S. Bureau of Labor Statistics, Consumer Price Index for All Urban Consumers, not seasonally adjusted, via FRED series CPIAUCNS (July 2026).
- U.S. Census Bureau and HUD, New Residential Sales, August 2026 (September 24, 2026).
- National Association of Home Builders, Builder Sentiment Falls on Higher Interest Rates and Costs (September 16, 2026).
- Lennar Corporation, Third Quarter 2026 Results (September 16, 2026).
- National Association of Home Builders, Eye on Housing, New vs. Existing Home Prices: What the National Median Misses (September 4, 2026).
- U.S. Census Bureau and HUD, New Residential Construction, August 2026 (September 17, 2026).
A Note From the Scatterplot Research Desk
Do you want your own daily-updating one-pager on the data you follow? Send us a note at support@scatterplot.co.


Enjoyed this? Get more in your inbox.
Weekly insights for advisors
— charts, research, and practical tools. No fluff.
Market Insights
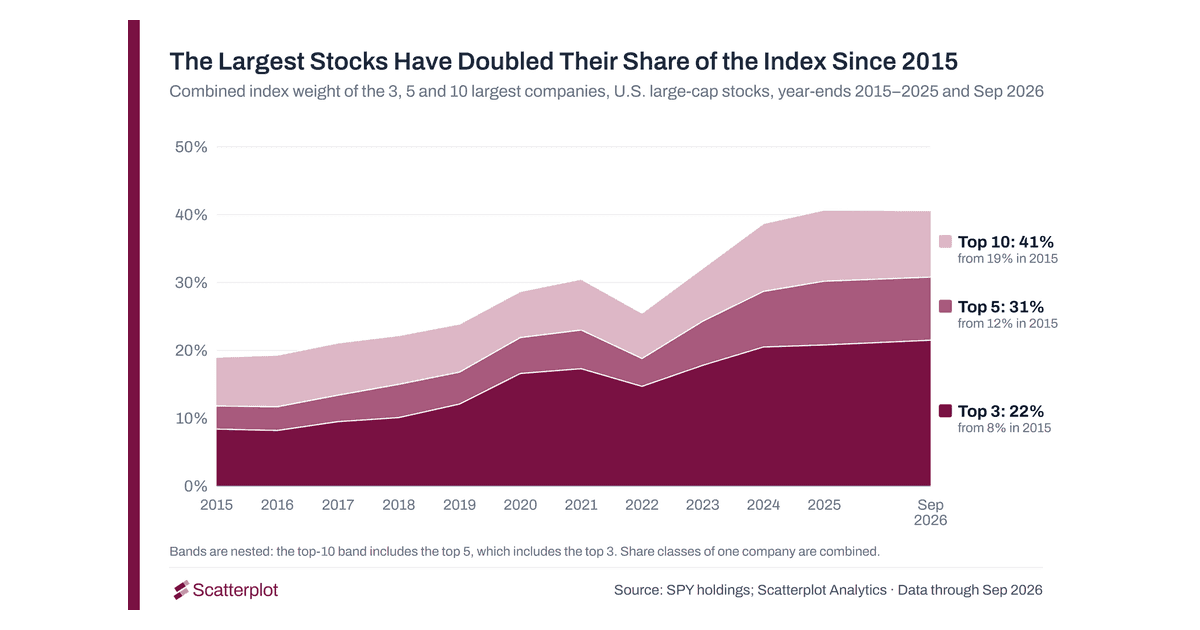
U.S. Market Concentration: The Largest Companies Are Gaining Weight, and a Bigger Share of Profits
Are the companies with the largest index weights also responsible for a substantial share of the index's aggregate financial results ? The data says they are.
Read moreSanjeev Pati, CFA
October 9, 2026 · 10 min read
Market Insights
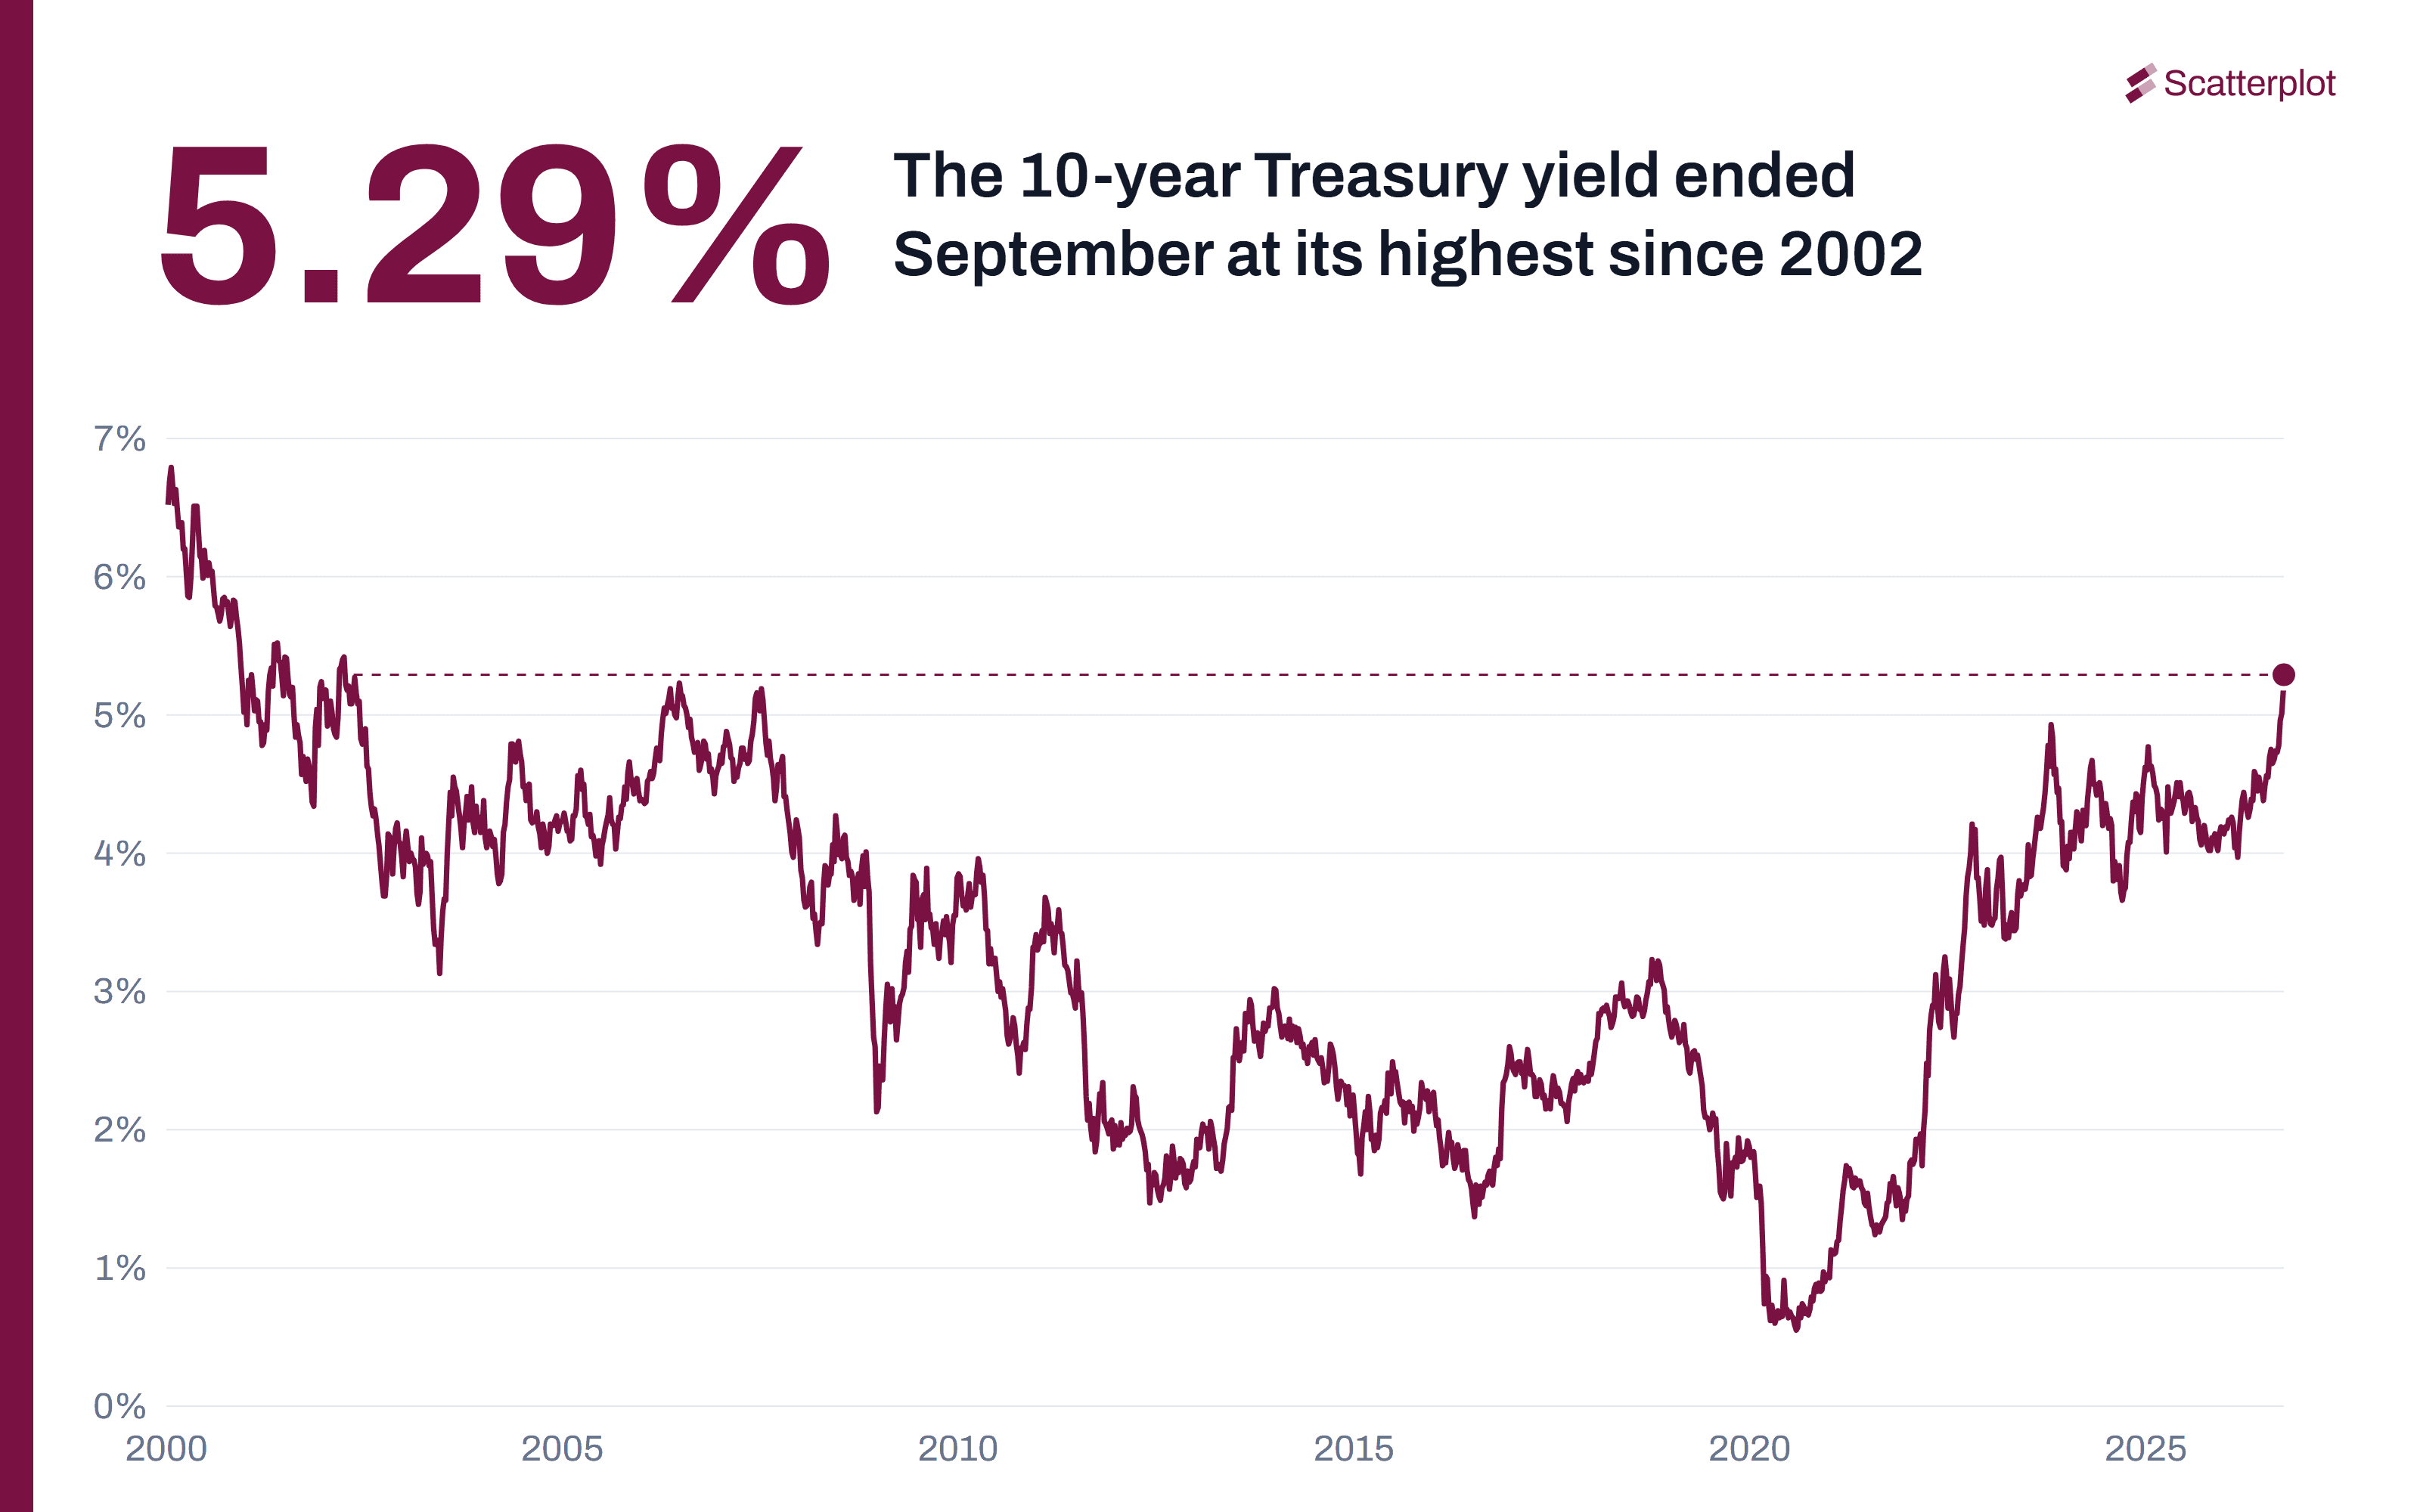
September 2026 Market Recap: The Fed Raises Rates and the 10-Year Treasury Yield Hits Its Highest Since 2002
A recap of the main market events of September 2026, in 13 charts.
Read moreSanjeev Pati, CFA
October 2, 2026 · 8 min read